×

The G20, human health and sustainability: an interview with Jeffrey D Sachs

We must reinvigorate our sense of humanity, justice and foresight

Jeffrey Sachs is an American economist and Director of The Earth Institute, Quetelet Professor of Sustainable Development and Professor of Health Policy and Management at Columbia University. He is Special Adviser to United Nations Secretary-General Ban Ki-Moon on the Millennium Development Goals, having held the same position under former UN Secretary-General Kofi Annan. He is known as a commentator and advocate for the relief of poverty, the achievement of improved health in developing countries and for environmental sustainability. From 2000 to 2001, he chaired the World Health Organization Commission on Macroeconomics and Health, which made clear the linkage between health gain, relief of poverty and economic growth.

Sachs is author of The end of poverty: economic possibilities for our time (2005). His most recent book is To move the world: JFK’s quest for peace (2013).

He was interviewed by the Editor-in-Chief of the Medical Journal of Australia, Stephen Leeder, who worked with Sachs in New York in 2003–2004, about the upcoming G20 meeting in Brisbane, Australia, in November.

What is your primary message as an economist interested in the relief of poverty about sustainability and its relation to both economics and human health?

It is not possible to consider ending poverty in the midst of human-induced climate change. Even if poor countries, such as those in Africa, make some short-term progress in the fight against poverty, this progress will be overtaken by climate disruption. Africa already is suffering from food price shocks, famine, heatwaves, droughts and other extreme climate shocks. We’ve got to get real: fighting poverty and environmental degradation go hand in hand.

How could the upcoming G20 meetings in Brisbane be an important forum for consideration of the economics of sustainability?

The G20 countries are the world’s most important economies. They account for the lion’s share of global greenhouse gas emissions. If the G20 gets its house in order, the world can be saved. If not, the G20 will wreck the world, pure and simple. So what will it be? Will the richest and most powerful countries also be the most short-sighted, or will they understand that they hold not only their fate but the fate of humanity in their grasp? Brisbane is therefore crucial. The prospects are not bright. The Australian Government claims it is driven by science, but it seems to us on the outside that it is driven by mining interests, or by the likes of Rupert Murdoch, the world’s number one anti-science propagandist.

The G20 should acknowledge that 2015 is the most important year of diplomacy on sustainable development in at least 15 years. We have three mega-summits next year. The first is on Financing for Development, in Addis Ababa, Ethiopia, in July 2015. The next is on Sustainable Development Goals, at the UN headquarters in New York, in September 2015. The third is on climate change — the so-called COP21 [21st Conference of Parties] of the UN Framework Convention on Climate Change — in Paris in December 2015. The Brisbane G20 should help to prepare the world’s leading countries to be true forward-looking problem solvers during these three crucial summits next year.

Can the world still prevent runaway climate disaster?

Yes, but we’ve almost run out of time. In 2009, and again, 2010, the world’s governments agreed to fight to keep global warming below 2°C. Yet we are on a trajectory of 4–6°C by the end of this century. In fact, we could trigger runaway climate change, in which warming unleashes various feedback processes (such as the release of carbon dioxide from vegetation, soils and permafrost) that could lead to runaway climate disaster. That’s why the 2°C limit is also called a “guardrail” for the world: one that keeps us from spinning completely out of control.

So, to be more specific, can we still keep warming below 2°C?

Yes, just barely, if all major economies of the world begin to take very strong and consistent actions to decarbonise their national energy systems in three main ways: shifting to low-carbon electricity, moving from fossil fuels to electricity in vehicles and buildings, and massive gains of energy efficiency. A fourth main global pillar is to shift from deforestation to reforestation and to reduce emissions from agriculture. These transformations are deep, but they are feasible. And they will not only protect the climate but also boost prosperity if we apply our efforts and ingenuity to the effort. We are running out of our planet’s carbon budget — that is, the amount of carbon the world can burn and still remain below 2°C.

But do you see these transformations being achieved by economic reasoning alone?

No. A reinvigoration of a global moral code must also be a lifeline in the 21st century. Pope Francis is utterly correct and compelling when he speaks of the “globalisation of indifference”. We have lost our moral compass as a global society. The mass media, the cynicism of Murdoch and others, have crowded out decency, humanity, justice and foresight. Yet each of us wants our children and grandchildren to survive and to flourish. We each have an instinct, a moral fibre, to keep the world safe for the future and for each other. Yet we have to reinvigorate this morality, to overcome the immorality of greed and power that drive our societies today.

At a time when our societies have unprecedented technological capacity in hand to end extreme poverty, a billion people worldwide are chronically hungry and destitute; in a period when health care technology enjoys astounding advances, 6 million children under the age of 5 worldwide still die each year of utterly preventable causes; and in an era when sustainable technologies for energy, industry, buildings and transport could reign in climate change, the world rushes headlong towards climate catastrophe — our attitudes and moral judgements will be the most important determinants of our fate, not our resources or our capacities.

At this stage of history, humanity is at a crossroads, with the future course of our own choosing. We have the technical means to solve our national and global problems — to banish poverty, fight disease, protect the environment, and train the illiterate and unskilled. But we can and will do so only if we care enough to mount the effort.

President John F Kennedy made the point compellingly a half-century ago. In his inaugural address in January 1961, he noted: “For man holds in his mortal hands the power to abolish all forms of human poverty and all forms of human life”. Two years later, on the quest for peace with the Soviet Union, J F K made the most essential point, the key reason for hope in peaceful problem solving, on poverty, climate change and the end of war itself:

So, let us not be blind to our differences — but let us also direct attention to our common interests and to the means by which those differences can be resolved. And if we cannot end now our differences, at least we can help make the world safe for diversity. For, in the final analysis, our most basic common link is that we all inhabit this small planet. We all breathe the same air. We all cherish our children’s future. And we are all mortal.

The cost-effectiveness of primary care for Indigenous Australians with diabetes living in remote Northern Territory communities

Australia’s Northern Territory has an estimated population of 234 800 people — just 1% of the national total. More than half the population lives in the greater Darwin area or in Alice Springs.1 Of all states and territories, the NT has the highest proportion (30%) of Aboriginal and Torres Strait Islander peoples (Indigenous Australians), many of whom live in small communities in remote and very remote areas (remoteness area categories 3 and 4).2 Indigenous people continue to experience higher rates of unemployment, lower levels of education and more crowded living conditions compared with other Australians. These social determinants contribute to poor health, including higher rates of chronic diseases and hospitalisation, higher mortality and lower life expectancy.3

Primary care is an effective and efficient means of providing a range of basic health services that improve health outcomes.4,5 However, providing high-quality, cost-effective primary care for a small population dispersed over a large remote area poses challenges. Cost-effectiveness refers to value for money, with better health outcomes achieved at less cost for patients as well as the health system.6 Indigenous people in remote settings experience barriers to accessing health services, including poor availability of general practitioners, geographical isolation, costs associated with travel and variable levels of cultural safety.7,8 Rates of potentially avoidable hospitalisations (PAHs) are indicators of access to primary care and include hospitalisations that may have been avoided by preventing illness or managing chronic disease.8

Undiagnosed or poorly controlled diabetes often results in serious complications leading to PAH, disability and premature death. In the NT between 1998–99 and 2005–06, Indigenous people were hospitalised for potentially avoidable causes at four times the rate of non-Indigenous people. This was largely attributable to diabetes complications, and highlights barriers to accessing effective primary care.9 Together with other chronic diseases, diabetes accounts for a large proportion of hospital resources, indirect costs through loss of productivity and impacts on social and family life.10

The NT is disadvantaged with regard to funding, as with fewer GPs in remote areas there is less Medicare and Pharmaceutical Benefits Scheme (PBS) subsidisation of consultations and prescribed medicines. Many health services in remote Indigenous communities are provided by nurses and Aboriginal health workers, whose services are largely not covered by Medicare or the PBS.11 This disadvantage is compounded by the high cost of providing primary care in remote locations compared with equivalent services in metropolitan areas.12 Additional funds are provided by the federal government, but between 2003 and 2012, there was a persistent gap of about $37 million annually between actual Medicare payments for NT residents and expected payments based on the national average. The 2012 rate of use of the PBS was only one-quarter of the national average.13 These comparisons are based on a per capita share and do not take into account the greater health needs of the Indigenous population or the cost of delivering services.14

There appears to be a significant need to improve availability of primary care services in remote communities in the NT. While the costs of providing these services are relatively high because of remoteness and a lack of economies of scale, there is a shortage of cost-effectiveness data showing whether there is a net benefit in terms of health outcomes and costs of investing in primary care. We undertook a population-based retrospective cohort study, from a health service perspective, to evaluate the costs and the health outcomes associated with primary care use by Indigenous people with diabetes in remote communities in the NT, using the incremental costs and benefits among a population of patients with different levels of primary care use.

Methods

We linked two databases at the individual level using patients’ unique hospital registration numbers. Individuals were categorised to one of three groups based on their level of use of primary care services. Data were stratified by disease stage. We compared marginal costs and marginal effects on health outcomes using hospitalisations, PAHs, deaths and years of life lost (YLL). We calculated cost-effectiveness ratios with 95% confidence intervals.15 All costs and monetary benefits are reported in 2006–07 Australian dollars.

Inclusion criteria

Inclusion was restricted to residents of remote and very remote areas of the NT2 who had been diagnosed with diabetes; were aged 15 years and over as of 1 January 2002; identified as Indigenous; and visited a public hospital in the NT or one of the remote clinics managed by the NT Department of Health at least once during the study period. The quality of Indigenous status reporting in NT hospital admission data is estimated to be 98% accurate.16

All primary care visits and hospitalisations of NT Indigenous patients in the catchment localities of the clinics between 1 January 2002 and 31 December 2011 were included for analysis. In the case of multiple residential localities, the locality with the highest frequency of recorded visits or hospitalisations was used. Direct transfers from clinics to hospital were not included in measures of use.

Classifications

Diabetes was defined using the International Classification of Primary Care, 2nd edition (ICPC-2)17 and the Australian Refined Diagnosis Related Groups, Version 4 (AR-DRG)18 (Box 1). PAHs were identified using the International Statistical Classification of Diseases and Related Health Problems, Tenth Revision, Australian Modification (ICD-10-AM).19 The principal diagnosis and procedure codes and up to nine secondary codes were used to identify complications of diabetes and PAHs.20

Data sources

We used two administrative databases: the primary care information system (PCIS) and the Caresys hospital admission data system. Data from 54 remote clinics and all five public hospitals in the NT for the 10 years 2002–2011 were extracted for statistical analysis.

We used the government accounting system to extract financial data for primary care costs. Operational and personnel expenditures were allocated based on activity. These expenditures covered patient travel, property maintenance and cleaning, and salaries for doctors, nurses and Aboriginal health workers. Costing information was derived using a “top-down” approach based on the total remote health expenditure and total clinic visits. The mean cost per visit was derived by dividing the total recurrent expenditure by the total number of clinic visits. Hospitalisation costs were taken from the national hospital costing data collection which excluded capital expenditure and patient travel. Indigenous patients in remote communities are not required to contribute a copayment for their care. We did not include any incidental costs borne by patients.

Statistical analysis

The two variables of interest were disease stage and primary care use. To define disease stage, patients were allocated to one of three groups depending on disease severity. ICD-10-AM and ICPC-2 were used to identify new cases and complicated cases. A new case was identified by checking previous health records. A new diagnosis was assumed if the patient did not have a previous diabetes-related hospital admission or clinic visit. The three groups were:

  • New cases: patients with a new diagnosis and without complications, as identified by applying the formula in Box 2;
  • Established cases: patients who were neither a new nor a complicated case;
  • Complicated cases: patients with one or more disease complications in any field of diagnosis, as defined in Box 1.

Patients were also allocated to one of three groups according to annual number of primary care visits:

  • Low-use group: 0–1
  • Medium-use group: 2–11
  • High-use group: ≥ 12.

Recommended best practice in the CARPA (Central Australian Rural Practitioners Association) Standard Treatment Manual 5th edition was used to develop the range of annual visits for each group.21

Propensity score matching and weighting were used to improve the comparability of the three groups.22 The propensity score was computed using key demographics and numbers of chronic diseases. A χ2 test was used to check comparability of the three groups.

Outcomes were measured in terms of annual hospitalisation rates (mean number of hospitalisations per person); annual PAH rates; deaths per 100 population; and YLL per person for between-group comparison. Deaths were identified using both PCIS and Caresys data. Age at death and Australian age-specific life expectancy were used to estimate YLL. The level of significance was set at P < 0.05. The cost-effectiveness ratio (CER) was calculated as the incremental cost per hospitalisation averted for both medium- and high-use groups, compared with the low-use alternative. If the CER is less than the “willingness-to-pay” threshold (a criterion for determining cost-effectiveness), that level of use is deemed cost-effective.15 The mean hospitalisation cost in the NT in the 2006–07 financial year was used as the threshold for hospitalisation assessment. The net benefit, expressed in monetary terms, was evaluated on the basis of primary care costing, hospitalisations saved or YLLs averted and the willingness-to-pay threshold. To assess the uncertainty relating to the cost-effectiveness of primary care, we calculated a cost-effectiveness acceptability curve,15 which allows estimation of the probability that primary care is cost-effective in reducing hospital admissions or YLLs, against different values placed on a hospital admission or a year of life. The statistical value of a life-year was $120 000 for the YLL assessment threshold.23 SAS 9.3 (SAS Institute Inc) was used for statistical analysis.

Ethics approval for this project was obtained from the Northern Territory Department of Health and Menzies School of Health Research Ethics Committee (Approval Number: 2012-184) and from the Central Australian Human Research Ethics Committee (HREC 12-57).

Results

A total of 14 184 patients were eligible to be included in the study. After propensity score matching, there were no significant differences in age (P = 0.980), sex (P = 0.354) or number of comorbidities (P = 0.348) between the low-, medium- and high-use groups. The mean cost per primary care visit in 2007–08 was estimated at $175. The mean cost per hospitalisation was $2915 (AR-DRG hospital inpatient costing is based on 2007–08 and 2008–09 financial year figures).

Overall, compared with the low-use group, the medium- and high-use groups (patients who used primary care two or more times annually) experienced lower rates of annual hospitalisation, PAH and death and fewer YLL (Box 3). Among complicated cases, the medium-use group had a lower mean annual hospitalisation rate than the low-use group (1.2 v 6.7 hospitalisations per person [P < 0.001]); the mean annual PAH rate was lower (0.72 v 3.64 per person [P < 0.001]); and the death rate and YLL were also lower (1.25 v 3.77 per 100 population [P < 0.001] and 0.29 v 1.14 per person-year [P < 0.001], respectively). Only marginal differences were observed for patients using primary care ≥ 12 times annually. For new cases in the medium-use group compared with the low-use group, the death rate was lower (0.48 v 2.17 per 100 population [P = 0.001]), as were YLL (0.13 v 0.81 per person-year [P < 0.001]). Lower rates were also shown for established cases in the medium-use group compared with the low-use group (deaths, 0.15 v 1.65 per 100 population [P < 0.001]; YLL, 0.05 v 0.57 per person-year [P < 0.001]).

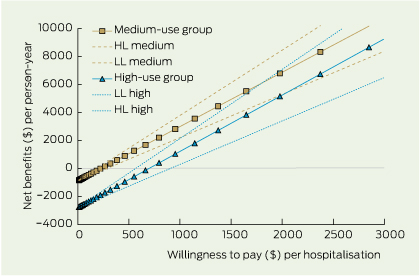
The net health benefits in saved hospitalisations provide a summary measure for the value-for-money of primary care. The net health benefit, as measured by hospitalisations saved per person per year, is achieved at a lower cost when primary care is used between two and 11 times per year. While higher use of primary care achieves slightly greater net benefits, it does so at a greater cost as measured by willingness to pay (Box 4).

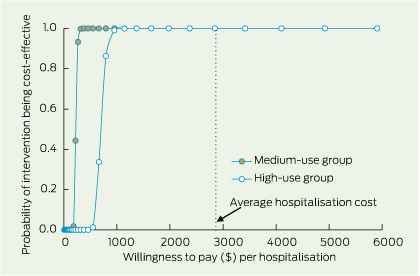
Using 2007–08 and 2008–09 financial year figures, there is an almost 100% probability that both medium and high primary care use are cost-effective in terms of hospitalisations avoided (Box 5).

Investing $1 in medium-level primary care for people with diabetes in remote Indigenous communities could save $12.90 in hospitalisation costs. Investing $1 in high-level primary care use could save $4.20.

The cost of preventing one hospitalisation for diabetes was $248 for those in the medium-use group and $739 for those in the high-use group. In both cases the cost was much less than the mean cost of one hospitalisation, $2915.

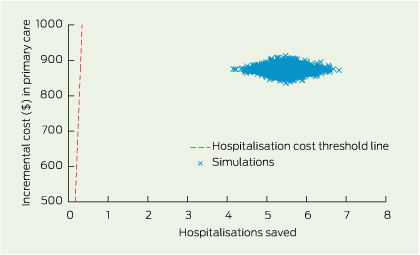
Uncertainty in the cost and effect estimates was assessed by 2000 bootstrapped simulations (Box 6).

Discussion

In the NT, improving the availability of primary care services is the key to improving access.7 The current model of service delivery in the NT results in low rates of primary care use and high rates of hospitalisation, suggesting patients with diabetes are not receiving optimal care aimed at monitoring and preventing complications. Investment in primary care in remote areas in the NT is costly compared with metropolitan settings.12 However, the alternative, hospital-based care, is even more expensive and results in poorer health outcomes. Our study has shown that improving use of primary care would not only yield better health outcomes for patients with diabetes, but would be cost-effective. The savings calculated in this study could be increased by improving the social determinants of health, in which process primary care has an important role through intersectoral action.4

These results are valuable to policymakers and health service planners charged with resource allocation. While there is general agreement in the international literature that improved access to primary health care results in fewer PAHs,24 evidence that this is true for remote communities in Australia and that this is cost-effective is scarce.25 Our study shows that improved access to primary care is both cost-effective and associated with better health outcomes for residents of remote communities. The results may be generalisable for other chronic diseases and to other jurisdictions in Australia. They may also be relevant to other countries where remoteness poses similar challenges.

The results are also of value to primary care managers and service providers who can aim to ensure their patients with diabetes are using services adequately (2–11 times per year). In Indigenous communities, it is particularly important that primary care services are culturally appropriate and reflect community preferences, including connection to culture, family and land, and opportunity for self-determination.26

Our study has limitations. Researchers did not have access to mortality data beyond 2007 and used hospital and PCIS mortality data only, so some deaths may have been missed. We did not have access to data from Aboriginal Community Controlled Health Services, and acknowledge that some patients may have been using primary care elsewhere. Some patients undergoing renal dialysis in hospital may have obtained primary care there rather than in their home community. A sensitivity analysis revealed that eliminating renal dialysis hospitalisations made little difference to the outcome (results are not reported). We did not include costs incurred in transporting patients from remote locations to hospital, so the total costs of hospitalisation are an underestimation. We were not able to eliminate any potential confounding effects of distances from patient’s residence to clinics or to hospital due to lack of data on geocoded localities.

Indigenous people in remote communities in the NT experience high rates of diabetes and poor access to primary care with resultant high mortality, morbidity and hospitalisation rates. This study used reliable, linked data to provide new evidence that there are significant cost savings and better health outcomes for patients with diabetes when access to primary care is improved.

1 Disease groups, definitions of diabetes and complications of diabetes

Coding

Diabetes


Primary care ICPC-2 codes

T87, T89, T90

Hospital AR-DRG codes

F11A, F11B, F13Z, K01Z, K60A, K60B

Hospital ICD-10-AM codes

E10-E14

ICPC-2 complication codes

A07, F83, K01, K02, K74-K76, K86, K89, K90, K91, N94, U88

ICD-10-AM complication codes

R40, R07, I20-I25, I10, G45, G46, I60-I69, H35, H36, G54-G64, N00-N19


ICPC-2 = International Classification of Primary Care, 2nd edition. AR-DRG = Australian Refined Diagnosis Related Groups, version 4. ICD-10-AM = International Classification of Diseases.

2 Criteria used for deciding a new case of diabetes

Data source

Criteria*


Hospital data

(last admission > 3 years AND no diabetes) OR


(last admission > 2 years AND no diabetes in the last two admissions) OR


(last admission > 1 month AND no diabetes in the last three admissions)

Primary care data

(last visit > 1.5 years AND no diabetes) OR


(last visit > 1 year AND no diabetes in the last two visits) OR


(last visit > 1 month AND no diabetes in the last three visits) OR


(last visit ≤ 1 month AND no diabetes in the last four visits)


* A new case must satisfy one of the criteria in both hospital and primary care data.


3 Mean annual hospitalisation, potentially avoidable hospitalisation, death rate and years of life lost for Indigenous people with diabetes in remote communities in the Northern Territory, by primary care use group, 2002–2011


Mean annual rate (95% CI)


No. of patients, and outcomes, by disease stage

Low-use group (0–1 primary care annual visits; n = 1421)

Medium-use group (2–11 primary care annual visits; n = 1892)

High-use group (≥ 12 primary care annual visits; n = 772)


New cases

n = 119

n = 63

n = 18

Established cases

n = 278

n = 393

n = 50

Complicated cases

n = 1024

n = 1436

n = 704

Hospitalisations per person


New cases

0.7 (0.58–0.89)

0.8 (0.59–1.04)

0.9 (0.46–1.36)

Established cases

0.4 (0.36–0.52)

0.7 (0.60–0.77)

0.3 (0.16–0.48)

Complicated cases

6.7 (6.56–6.88)

1.2 (1.18–1.30)

1.0 (0.94–1.09)

Total

5.0 (4.87–5.11)

1.1 (1.06–1.16)

1.0 (0.89–1.04)

Avoidable hospitalisations per person


New cases

0.31 (0.21–0.42)

0.35 (0.20–0.50)

0.38 (0.09–0.67)

Established cases

0.20 (0.14–0.25)

0.38 (0.32–0.44)

0.11 (0.02–0.21)

Complicated cases

3.64 (3.52–3.76)

0.72 (0.68–0.77)

0.57 (0.51–0.63)

Total

2.69 (2.60–2.78)

0.64 (0.60–0.67)

0.54 (0.48–0.59)

Deaths per 100 population


New cases

2.17 (1.32–3.02)

0.48 (0.00–1.03)

0.00 (–)

Established cases

1.65 (1.17–2.14)

0.15 (0.03–0.28)

0.46 (0.00–1.06)

Complicated cases

3.77 (3.39–4.16)

1.25 (1.06–1.43)

0.84 (0.62–1.06)

Total

3.23 (2.92–3.53)

0.99 (0.85–1.14)

0.80 (0.59–1.00)

Years of life lost per person


New cases

0.81 (0.76–0.86)

0.13 (0.10–0.16)

0.00 (–)

Established cases

0.57 (0.54–0.60)

0.05 (0.04–0.06)

0.21 (0.17–0.25)

Complicated cases

1.14 (1.12–1.16)

0.29 (0.28–0.30)

0.20 (0.19–0.21)

Total

1.00 (0.99–1.02)

0.24 (0.23–0.24)

0.20 (0.19–0.21)

4 Net benefits in hospitalisations avoided with 95% confidence intervals, by willingness-to-pay per hospitalisation


HL = high limit. LL = low limit.

5 Cost-effectiveness acceptability curve for patients in the medium-level group for use of primary care for diabetes, compared with the high-level group, in terms of hospitalisations avoided

6 Bootstrap simulations with 2000 replications on the cost-effectiveness plane of primary care, for patients in the medium-level of primary care for diabetes

Can we sustain health spending?

Australian governments currently spend relatively little on health. Are cutbacks really what’s needed?

The assertion that health spending is unsustainable has been made with remarkable regularity, most recently by the Federal Minister for Health, Peter Dutton.1 Despite publication of a major review by the National Health and Hospitals Reform Commission2 less than 5 years ago, the Minister has called for a far-reaching debate about the health system.3 Consistent with the rhetoric, the recent federal Budget has introduced copayments and foreshadowed cutbacks that are expected to reduce federal health spending by $8.6 billion over the 4-year forward estimates.4

The evidence usually cited to demonstrate the unsustainability of health spending is its impact on government finances. Between the 2001–02 and 2011–12 financial years, health expenditures by all levels of government rose from 19.8% to 25.6% of total tax revenues,5 and projections by the National Commission of Audit prior to the recent Budget suggested that federal spending alone could rise from $65 billion in 2013–14 to over $120 billion in 2023–24.6 These trends are commonly linked to the ageing of the population to conclude that significant structural reforms are needed to reduce spending on health services, and the recent budget measures may be seen as a first step in this direction.

Despite these projections, the unsustainability thesis is remarkably weak. Economies are flexible and the composition of spending varies significantly over time and between countries. At the time of federation, agriculture, manufacturing and the services sector accounted for 19%, 12% and 31% of gross domestic product (GDP), respectively. By 2011–12, the shares were 2%, 6% and 56%, respectively.7 Technological change reallocates resources, and the expansion of industries is usually seen as desirable because it employs the displaced workforce and generates additional benefits. The anomalous concern with the costs and not the benefits of an expanding health sector implies comparative lack of concern or confidence in the benefits despite evidence that better health is one of the diminishingly few ways in which we can improve the quality of life of the population.

The flexibility of economic systems is also apparent when countries are compared. Australia currently devotes 9.5% of GDP to health, while the proportion in the United States has reached 17.7% (Box). The efficiency of the US health system may be questioned, but there is no suggestion that it has impaired the economy or sapped the vitality of the country.

The US case is interesting for another reason. Despite having the largest health expenditures in the world, when compared with the wealthy countries of the Organisation for Economic Co-operation and Development (OECD) the proportion of the population above the age of 65 years in the US is the smallest. In contrast, the country with the oldest population – Japan – spends little more than the OECD average on health. This illustrates a common error: the belief that health spending is tightly linked to the demographic structure and that ageing necessarily drives health expenditures. Historically, this has not been true, as health expenditures have been driven by technology and the increasingly generous provision of health services as GDP rises.12

Nevertheless, the pressure from ageing is likely to intensify. By 2050 the proportion of the population above 65 years of age in Australia is likely to rise from 14% to 22% and the proportion over 80 years to double from 4% to 8%.8 The pressure is likely to be exacerbated by expensive health technologies targeting individuals rather than broad disease categories. However, even with the slowing in the rate of per capita GDP growth to the average 1.4% per annum that occurred between 1970 and 1990, by 2050 GDP per capita will expand by 65%. Even if total health expenditures rose to the US level of 17.7% of GDP there would be an expansion of non-health-related per capita GDP of 50%, which could be devoted to the improvement of the material standard of living. This is not a paradox. Even if GDP grows more slowly than health expenditures, the absolute (not percentage) increase will be greater than the absolute increase in health expenditures. A 65% rise in GDP from a (index) base of 100 will increase resources by 65 points. A 200% rise in health expenditures from a (index) base of 9.5 increases resource use by 19 points. Resources for other uses would rise by 46 points. Given the evident sustainability of health spending for some decades, it might be asked why health has been targeted for cutbacks. At 6.6% of GDP, public health expenditures by all governments in Australia are the tenth lowest of the 33 countries in the OECD database and the lowest among wealthy countries in the group (Box). Even US governments, which channel 8.3% of GDP into public health programs, outspend Australian governments. Further, as indicated in the Box, Australia has been relatively successful in restraining the growth of health spending.

A possible reason for the Minister’s concern is that, irrespective of comparative statistics, health spending in Australia — or public health spending in particular — may be inefficient. For example, a survey by Runciman and colleagues13 found that compliance with indicators of appropriate care was highly variable as judged by a retrospective review of medical records and telephone interviews with at least 1000 Australians. However, neither this nor the many other problems with the organisation and provision of services are likely to be resolved by increased copayments or reduced public spending. Both options would increase pressure for private health insurance (PHI) to cover the gap, and there is little or no evidence that private insurers would be more willing than the public sector to undertake the reforms needed to improve the quality of care. In principle, managed care might be used by private health insurers to achieve this goal, but the evidence of its success is limited and it appears unlikely that this is an option that Australian governments would be prepared to pursue, at least in the short run.

It is possible that copayments are seen as a way of controlling total costs; however, the effect of the recent budgetary measures on economic costs — resource use — will be miniscule. Evidence unequivocally indicates that copayments have a relatively small effect on service use. The $6 copayment initially proposed by the Australian Centre for Health Research14 was estimated to reduce service use sufficiently to save $750 million over 4 years — 0.3% of federal health spending, 0.14% of total health spending. The greater part of the 4-year federal budgetary saving of $5.5 billion on Medicare Benefits Schedule items and $866 million from the Pharmaceutical Benefits Scheme will therefore be a result of cost shifting to the public, not reduced service use. However the burden of private spending falls unevenly on the public: it self-evidently falls on the sick. Bulk-billing primarily assists those who are on a low income. The principle effect of its elimination will be a redistribution of income from this group to the healthier, wealthier members of the community. Copayments will, additionally, divert patients from lower-cost general practitioner care to higher-cost outpatient care. Those who defer needed treatment are likely to eventually need more expensive specialist care.

Perversely, in the longer run, eliminating bulk-billing is likely to increase GP fees and expenditures by reducing competitive pressures. An increase in the copayment from $7 to $10 is less likely to adversely affect an individual GP practice than the cessation of bulk-billing and the initial introduction of a copayment. Inflation of fees will be accelerated when the government succumbs to pressure to allow PHI to cover the widening gap. Increased GP fees may be independently desirable given the low level of GP incomes — the lowest relative to average wages listed by the OECD after Estonia and Hungary. However, a more equitable remedy would be to increase, not decrease, the rebate.

Reduced budgetary expenditures are not a necessary response to unsustainable spending or a solution to demonstrated inefficiencies. Rather, they are a response to budgetary pressures arising from inadequate tax collections and the failure of successive governments to implement suggested reforms. The 26.5% of GDP raised by all forms of taxation in Australia in 2012 was the fourth lowest of the 34 OECD countries after Chile, Mexico and the US. Proportionally, Northern European countries collect 40%–75% more than Australia. The result of lower taxation is lower levels of community services and infrastructure, and a long-term structural problem for government finances — outcomes which are strikingly evident in the US.

The damage to be inflicted on the health sector by reduced public spending is part of the price Australians will pay for the persistent failure of government to address this problem and to raise taxation to a level that allows improvement in the economic infrastructure, better community services and spending on all of the health services which — after careful evaluation — have been shown to provide cost-effective health benefits to the Australian community.

Health spending, older population and taxes for selected countries

Total health spending*


Public spending


Population aged 65+*


Taxes


1980 (% GDP)

2011 (% GDP)

PP increase

2012 (% total)

2011 (% GDP)

2011 (% total)

2012 (% GDP)


Australia

6.1%

9.5%**

3.4

69.7%**

6.6%**

13.7%

26.5%††

France

7.0%

11.6%

4.6

76.9%

8.7%

17.1%

45.3%

Canada

7.0%

11.2%

4.2

70.1%

7.4%

14.7%

30.4%

Japan

6.4%

9.6%

3.2

82.5%

7.8%

23.3%

28.6%

Sweden

8.9%

9.5%

0.6

81.7%

7.7%

19.3%

44.2%

Netherlands

7.4%

11.9%

4.5

79.8%

9.5%

15.9%

38.6%

United Kingdom

5.6%

9.4%

3.8

82.5%

8.1%

16.2%

35.7%

United States

9.0%

17.7%

8.7

46.4%

8.3%

13.2%

24.0%

OECD

6.6%

9.3%

2.7

na

na

15.4%

34.1%


GDP = gross domestic product. PP = percentage point. OECD = Organisation for Economic Co-operation and Development. na = not applicable. AIHW = Australian Institute of Health and Welfare.

* OECD.8 † OECD.9 ‡ World Bank.10 ¶ OECD.11 ** AIHW.5 †† 2011 figure, as 2012 figure was not available.

Evaluating the costs and benefits of using combination therapies

Fixed-dose combination therapy can improve compliance; but at what cost?

Fixed-dose combination (FDC) therapies, which involve combining two or more pharmaceutical drugs in a single tablet, are being increasingly prescribed in Australia, particularly for people with long-term chronic conditions such as diabetes and cardiovascular disease. The use of combination therapies can reduce out-of-pocket costs to the patient (ie, there is only one dispensing fee of $6.60 and copayment of up to $36.90). There is evidence that patients given combination therapies have greater adherence and compliance than those taking these medications separately.1 However, combination therapies that are subsidised through Australia’s Pharmaceutical Benefits Scheme (PBS) can be more costly than using the component therapies. Our aim is to review evidence on benefits, use and the costs of combination therapies. We then propose a framework for pricing and evaluation of combinations that would ensure they are a cost-effective option for the Australian health care system.

The growth in use of combination drugs to treat diabetes and cardiovascular disease is illustrated in Box 1, which shows total expenditure on these therapies over time. Australian guidelines for the treatment of blood pressure (BP) recognise that combinations of antihypertensive drugs are required to achieve BP targets.2 Similarly, patients with type 2 diabetes are often on multiple therapies to adequately control their blood glucose.3 The clinical rationale for using FDCs is underpinned by studies such as the UMPIRE (Use of a Multidrug Pill in Reducing Cardiovascular Events) trial,4 which showed an improvement in adherence for patients taking FDC cardiovascular medications. An earlier meta-analysis of three cohort studies and two clinical trials of FDC antihypertensive agents showed a 21% increase in compliance compared with corresponding free-drug combinations (95% CI, 1.03–1.43) and a non-significant trend toward a reduction in BP levels.1

Combination therapies are evaluated by the Pharmaceutical Benefits Advisory Committee (PBAC) following industry submissions, which generally justify listing a combination therapy on the PBS on the basis of cost minimisation, which means that the combination is clinically non-inferior to the separate components at the same or a lower price.5 While the initial price of a combination product is generally lower, subsequent reductions in the price of the FDC drug are not necessarily linked to equivalent reductions in the prices of components.

There are several circumstances under which the combination therapy can become more expensive than the sum of the individual therapies.

First, the PBAC must advise the Minister for Health if there is a significant improvement in compliance, a significant improvement in efficacy or a significant reduction in toxicity over the alternative therapies.5 The Minister may act on this advice when pricing combinations, so that there are smaller or no price reductions for such products. In practice, the PBAC has only rarely provided this advice, as a search of PBAC indicates that ezetimibe and simvastatin is one of the few combinations that have been deemed to fulfil these criteria. Even for this FDC, the additional cost to the government is around $20 million per year. In contrast to the PBAC, the National Institute for Health and Clinical Excellence in the United Kingdom does not recommend using FDCs with ezetimibe due to the higher cost.6

Second, only single-brand combination items have their costs linked to their component drug therapy items, so when prices of the components fall, these reductions flow onto the FDC. When there are multiple brands of the same combination (even if they are supplied by the same manufacturer), the costs are subject to a mechanism known as price disclosure.7 This mechanism bases future PBS subsidies on the average wholesale cost to pharmacies of individual drugs, so over time the government pays a cost that reflects the market price. When multiple brands of an FDC are available, price disclosure only takes into account the wholesale costs of these drugs, and there is no link to the cost of the separate components.

The current pricing arrangements have a significant impact on the way many FDCs are priced relative to their component therapies. A prime example is the combination of clopidogrel with aspirin, which can reduce the risk of cardiovascular events, but at an increased risk of bleeding compared with aspirin alone.8 The PBAC recommended listing the combination on the PBS for the treatment of acute coronary syndromes and long-term atherothrombotic events on a cost-minimisation basis, and it became available in late 2009.

Box 2 shows the cost per dose of clopidogrel compared with the FDC with aspirin. On initial PBS listing, the price of the combination was set at 1 cent cheaper than the cost of clopidogrel and this was maintained until a month before the PBS subsidy for clopidogrel was due to decline by 18% because of the price disclosure mechanism. At that time (September 2011) a new brand of the FDC was introduced by the same manufacturer, and this changed its status on the PBS formulary. From that time onward, the costs of the combination and of the individual components were not linked, and the marginal cost of adding aspirin has been as high as $1.36 per tablet.

Many other combinations are initially listed on the PBS at a reduced cost, but end up costing far more, as there are fewer manufacturers of these therapies. This means that combinations are subject to less competition that would generate the discounting to pharmacists that drives the prices of generic drugs lower. The longer-term pricing implications of FDCs do not appear to have been taken into account by the PBAC and its various sub-committees, as almost all combinations have been listed on the basis of cost minimisation, even though the subsequent PBS subsidy often exceeds the costs of component therapies after pricing becomes delinked. The overall cost to the government of listing diabetes and cardiovascular combination therapies is around $120 million more annually, compared with the sum of their equivalent individual therapies.

Further, the uptake of some combination therapies has been much greater than forecast in submissions to the PBAC. For example, the amlodipine and atorvastatin combination was forecast by the manufacturer to involve fewer than 200 000 prescriptions within the first 4 years after listing on the PBS (at an estimated cost to the PBS of less than $10 million per year). Based on Medicare Australia data, the actual volume of prescriptions over the first 4 years was 2.95 million, at a total cost of $215 million.1 While this therapy was listed on a cost-minimisation basis, the link between the price of the combination and the component drugs was broken when the manufacturer introduced a second brand of the same drug. This again resulted in moving off the combination drug list, thus exempting the FDC from the 25% price cut to atorvastatin in December 2012.9 The most common FDC of this therapy (10 mg amlodipine and 40 mg atorvastatin) currently has a dispensed price of $76.10, while the dispensed price of these purchased separately would be $40.78 with consequently a lower cost to the government.

A new pricing framework is needed to ensure these medications are a cost-effective option for government and patients. The most obvious reform is to permanently link the dispensed price of FDCs to their individual components, rather than just for an initial period after their listing on the PBS. There is precedence for the PBAC to take this approach, as it has recommended linking the price of two off-patent drugs, atorvastatin and simvastatin, although this has yet to adopted by the government.9

A price differential in favour of FDCs could be justified if they can be shown to improve adherence in a general practice setting and thereby reduce risk factors for these chronic diseases. A key source of evidence could come from commissioning pragmatic randomised controlled trials of FDCs versus free-dose combinations in an Australian health care setting. Such studies should distinguish between the effects of charging the patient a lower out-of-pocket cost and the improved adherence associated with the convenience of having to take fewer tablets. If the results of these trials show improved clinical outcomes, then the PBAC could determine a price premium for these therapies based on the additional expected health benefits.10 Such an approach would be far superior to the current process, which involves minimal evaluation of combinations and a flawed regulatory pricing system that generates large long-term costs to the taxpayer.

The recent McKeon review into health and medical research suggests that the government invest 3%–4% of current health expenditure on research to improve the health care system.11 In the context of cardiovascular and diabetes combination therapies, Australia is spending $600 million per year, so around $18–$24 million annually on research would be consistent with the report’s recommendations. In the current financially constrained environment, where could this money be found? If there was no price premium for combinations that have been listed on the PBS on a cost-minimisation basis, it would save around six times this amount. Given the government’s responsibility to ensure an equitable and sustainable health care system, only paying a premium for combination therapies where there is demonstrated evidence of clinical benefit would reduce waste in the Australian health care system.

1 Total government expenditure on combinations by therapy class*


* Adjusted for inflation to 2012 dollar value using gross domestic product final consumption expenditure price deflator.

2 Cost of clopidogrel compared with clopidogrel and aspirin combination*


* Cost per tablet ($) pricing is calculated from dispensed prices as per the Pharmaceutical Benefits Scheme for the respective month. Prices from April 2014 are based on calculated prices from the National Health (Weighted average disclosed price – main disclosure cycle) Determination 2013 (No. 2) and Medicare Australia’s “Pricing of PBS Medicine”.

Changes in health financing

The medical profession has an important role in the stewardship of the health system

In the past month, we have seen many opinions on what health financing changes have to be made to ensure we have a sustainable health care system. The most notable proposal has been the often-recycled idea of imposing a patient copayment for visits to general practitioners — a concept the Australian Medical Association does not support, for very good reasons.

When governments get nervous about spending in health, they have three options: reduce the price they pay; spend more wisely; or collect more revenue.

In terms of spending on medical services, medical practitioners have done their bit over the past decade on price. The proportion of health expenditure on medical services was 18.8% in the financial year 2001–02 compared with 18.1% in 2011–12.1 Average annual growth in health expenditure on medical services in the decade to 2011–12 was 4%, compared with growth in expenditure on pharmaceuticals covered by the Pharmaceutical Benefits Scheme (PBS) of 6.0% and 9.3% for products at the pharmacy.1 Further, growth in average health expenditure by individuals on medical services in the decade to 2011–12 was 4.0%, compared with 5.3% for PBS medicines and 7.5% for products at the pharmacy.1 And the average growth in Medicare benefits paid per service in the decade to 2012–13 was 4.7%,2 less than the real growth in total health spending of 5.4% in the decade to 2011–12.1

Today, 81% of GP consultations are bulk billed,2 and 89% of privately insured inhospital medical services are charged according to the patient’s private health insurer’s schedule of medical benefits.3 Patients had no out-of-pocket cost for their doctor’s fee for 93.5 million GP consultations in 2012–13, and for more than 26 million inhospital services covered by private insurance.

The message from these figures is clear. The price of medical services is not where the problem lies, and it is not where the focus of the federal government should be.

The drivers of health cost lie in the volume of services — specifically, those related to the growth in non-communicable diseases — and the demand this places on the health system. In this area, the medical profession is critical to decision making about health financing.

On the world stage, Australia’s health system delivers an enviable service. If you become seriously unwell, you will receive world-class care in Australia. We need to ensure that when acute treatment is needed, people continue to get the care that is currently being delivered. However, we need to reshape the current system to meet the challenge being thrown up by an emerging set of problems. An ageing population with chronic and complex health needs changes the demand for health care.

While mortality from heart attacks decreased from 14 443 in 2001 to 9811 in 2011,4 more Australians are now living with coronary heart disease and the disability that follows an attack. It is far cheaper if we can prevent people developing such disease in the first place.

Consequently, better support is needed for GPs to provide effective preventive care and improved disease management. Although this would require increased investment from Medicare, it would save the government money in the longer term.

For its part, the medical profession has two areas on which to focus: first, changing the way we provide health care, where we provide it and when we provide it for non-communicable diseases; and second, identifying cost-effective services. Both of these require wise spending.

In terms of our clinical practice, we must have a structured process for translating what we know into what we do. This requires much greater scrutiny of what we are doing, through participating in more research into and review of our own practice, so we avoid practices that don’t provide real outcomes for patients.

The challenge for the medical profession is to accept that we do have a role in the stewardship of the health system. Otherwise, government will step in, and health care will be dictated by health financing experiments, rather than evidence-based and effective health care.

Climate change and diabetes: averting two linked catastrophes

To the Editor: Zimmet draws attention to the looming catastrophe of diabetes.1 However, there is a concomitant health catastrophe — climate change, “the biggest global health threat of the 21st century”.2

We believe that it is not useful to argue whether diabetes or climate change is a greater threat to health. Rather, diabetes and climate change are predictable manifestations of contemporary human ecosystems:

The conjoined processes of industrialisation, urbanisation, modernisation and the rise of consumer culture have influenced both . . . food energy intake and . . . physical activity . . . From this perspective the problem is primarily one of a systemic change in our way of living, rather than a consequence of defective individual behaviour.3

Obesity, with its pathological consequences, including diabetes, and climate change have “similar environmental aetiology, based in modern human lifestyles and their driving economic forces”.4

Our lifestyles and the economic forces behind them are driven by fossil fuels rather than agricultural or other renewable sources of energy. As a result, we perform less physical activity, and greenhouse gases are emitted to support our lifestyles and the economy in which we live.3 The industrialisation of food production was made possible by fossil fuels. This has increased the volume of agricultural output and reduced costs, enabling increased consumption of energy-rich, nutrient-poor food.5 Rising rates of obesity, diabetes and greenhouse gas emissions are an inevitable result.2,3

Therefore, effective control of diabetes and climate change at the global population level requires common strategic action.4 This includes:

  • increasing local food production;

  • designing cities and transport systems for sociability and physical activity; and

  • regulaton of corporations to support rather than undermine health and sustain rather than damage the environment.

These strategies will increase physical activity, improve nutrition and reduce our level of fossil fuel use.2

Governments, corporations and the professions must lead societal action to avert the looming catastrophes of diabetes and climate change. Individual clinical and household responses will complement and follow effective leadership. We as health professionals must work strategically and collaboratively to both prevent diabetes and reduce the potential impact of climate change.

Removing the GST exemption for fresh fruits and vegetables could cost lives

To the Editor: There have been rumours that the current exemption from the goods and services tax (GST) for fresh foods, such as fruits and vegetables, might be removed.1 Changes in government are often accompanied by a review of policies, and broadening the tax base is appealing because it would increase efficiency and raise revenue. But what implications would a rise in the price of fruits and vegetables have for the Australian diet and health?

From estimates of the price elasticity of demand for fruits and vegetables in the United States, we estimate that fruit consumption would decline by 4.9% (95% CI, 2.6%–8.1%) and vegetable consumption by 4.8% (95% CI, 2.6%–7.2%) with removal of the current 10% GST exemption.2 To model lifetime health effects, we used methods we developed for the Assessing Cost-Effectiveness in Prevention (ACE Prevention) project.3 The model mimics the 2003 Australian population in terms of the health-adjusted life-years lived and compares current practice with a scenario in which fruit and vegetable consumption is reduced. Based on available evidence, the model assumes a reduction in fruit and vegetable consumption is associated with an increase in the incidence of ischaemic heart disease (IHD), ischaemic stroke, and cancer of the lung, oesophagus, stomach and colon, leading to increased prevalence and mortality in later years. In the model, health care costs are associated with prevalence for IHD and stroke and with incidence for cancer. Future costs and health loss are discounted at 3% per year.

Using the model, we calculate that adding GST to fruits and vegetables could cost about 100 000 healthy life-years over the lifetime of the 2003 Australian adult population, due to an additional 90 000 cases of IHD, stroke and cancer (Box). This extra disease burden could add a billion dollars in health care costs over the same period.

This suggests that abolishing the GST exemption for fruits and vegetables could have a large detrimental impact on health and health care budgets. Of course, reality is more complex than we have modelled here. For example, other food categories would also be affected by a removal of the GST exemption for fresh foods, leading to complex shifts in diet. But it is very clear that governments should explicitly consider the potential health consequences before making changes to Australia’s tax system.

Results of model estimating the lifetime health effects of adding the goods and services tax to fruits and vegetables

Mean (95% CI)


Healthy life-years*

101 379 ( 60 294 to 145 690)

Health care costs (2003 A$ billion)

1.04 (0.55 to 1.77)

Ischaemic heart disease incident cases

64 495 (23 814 to 108 385)

Stroke incident cases

13 572 (4485 to 24 695)

Cancer incident cases

12 077 (5368 to 20 333)


* Over the lifetime of the 2003 Australian adult population.

A meta-analysis of “hospital in the home”

To the Editor: Caplan et al1 include in their meta-analysis a trial by Mather et al that compared home care with intensive care management of patients with acute myocardial infarction (AMI) between 1966 and 1968.2 A joint working party of the Royal College of Physicians and British Cardiac Society dismissed the results of this study because of design defects.3,4

Kalra et al5 performed a randomised trial with three arms for patients with acute stroke: stroke unit care, general ward care with stroke team support, and domiciliary care. Stroke units achieved a significantly lower mortality than general ward or domiciliary care. Caplan et al ignore the heterogeneity of the hospital arms, and sum their mortalities, creating a non-existent advantage for domiciliary care over hospital care. This meta-analytic technique is simplistic and invalid.

Hill et al describe home versus hospital management for patients with suspected AMI,2 as do Mather
et al.2 Studies of obsolete treatments, such as home management of patients with AMI, should have been excluded from the meta-analysis.

Rudd et al studied the effect of early discharge after stroke using a 1976 clinical definition of stroke.6 No details of imaging or comorbidities were given. The assumption of equipoise in the trial arms regarding morbidity is not met, and the study is not suitable for inclusion in the meta-analysis.

Indredavik et al7 studied the effect of early supported discharge versus ordinary care in patients with stroke, with 13 deaths at 26 weeks in the experimental group against 15 deaths in the control group. However, Caplan et al incorrectly report this as 21 and 26 deaths, respectively.

If these five most heavily weighted studies are excluded, no significant difference in mortality is seen
(243 hospital-in-the-home deaths [n = 2747] v 245 hospital deaths
[n = 2435], two-sided P = 0.14). Moreover, meta-analysis of the effect of location on mortality where the circumstances of the location are
not defined and not expected to be homogenous is invalid and makes
the mathematical exercise futile.

A meta-analysis of “hospital in the home”

In reply: Dickson argues for exclusion of randomised controlled trials (RCTs) if treatments have changed, but treatments are constantly changing so, following
this rule, meta-analysis would be impossible. Similarly, diagnosis
has changed — stroke was
a clinical diagnosis, then computed tomography was required, and
now magnetic resonance imaging
is needed. Equipoise is not a requirement for inclusion in a
meta-analysis.

Complaints about research being simplistic because it aggregates patients and groups demonstrates a misconception of research, which is designed to aggregate one factor while other factors differ — for example, study arms may have different mixtures of ages but similar average ages. The meta-analysis studied effects of two systems of care — hospital and hospital in the home (HITH) — not a particular diagnosis or treatment.1,2 Therefore it is legitimate to aggregate hospital patients and compare them with HITH patients.

Location and heterogeneity were mathematically defined, there was no heterogeneity for mortality data, and other outcomes were adjusted appropriately.

Results from the study by Indredavik et al were published in several reports, but (due to space limitations) only the primary report was cited. The data that Dickson refers to are in a report by Fjaertoft et al.3

Although the prevailing opinions
of the Royal College of Physicians
of London and the British Cardiac Society criticised the study by Mather et al in the 1970s, no contradictory facts or trials were cited at the time.4 Considering that other prevailing practices that were initially not examined by adequate RCTs led
to many iatrogenic deaths (eg, prophylactic use of antiarrhythmic drugs5), such practices should be examined and evidence of patient harm taken seriously, rather than simply dismissing evidence as obsolete.