×

Optimising acute care and secondary prevention for patients with acute coronary syndrome

Patients who experience an acute coronary syndrome (ACS) present with heterogeneous clinical manifestations. In the emergency department, risk assessment should immediately identify patients with ST-segment elevation myocardial infarction (STEMI) who are in need of emergency reperfusion. In patients with non-ST-segment elevation acute coronary syndrome (NSTEACS), the focus is on identifying those at higher risk of recurrent infarction or death. This then guides the application of evidence-based therapies such as angiography and appropriate revascularisation, powerful antithrombotic therapy and comprehensive secondary prevention.

Evaluations of clinical practice have consistently shown underuse of risk stratification and consequent inappropriate application of evidence-based practice. This is particularly true for patients at higher risk of adverse events, who are often undertreated yet have the most to gain from evidence-based therapy.

Optimising systems of care for STEMI

The acute occlusion of a major epicardial coronary vessel usually occurs in the context of poor collateral supply, and results in the rapid onset of myocardial necrosis accompanied by an increased likelihood of lethal arrhythmia. These patients have the highest inhospital mortality rates, but these can be improved by prompt institution of reperfusion therapy. There is a clear relationship between longer time from symptom onset to reperfusion and increasing mortality rates. SNAPSHOT ACS, the comprehensive binational audit run in Australia and New Zealand during 2 weeks of May 2012,1 reported median times from hospital presentation to reperfusion (measured as door-to-needle time) of 42 minutes (interquartile range, 25–70 minutes) for those receiving fibrinolysis, and 82 minutes (interquartile range, 53–138 minutes) for those receiving primary percutaneous coronary intervention (PCI; measured as door-to-balloon time). While these median intervals fall within recommended benchmark goals, an appreciable proportion of patients fell outside these goals of 60 minutes and 90 minutes for fibrinolysis and primary PCI, respectively. More disturbingly, 32% of patients with confirmed STEMI presenting within 12 hours of the onset of symptoms did not receive any form of reperfusion therapy.

Upskilling the health care professionals who make first contact with patients, to allow early performance and interpretation of electrocardiograms (ECGs), can dramatically reduce the time from symptom development to reperfusion in patients with STEMI. This approach is being implemented in a variety of settings involving paramedics, general practitioners and nursing practitioners, with specialist support. Where the travel time to hospital is prolonged, fibrinolysis can be administered in the field.2 A recent Australian epidemiological modelling study found that this was the most effective way to optimise timely reperfusion for STEMI in remote locations.3 Elsewhere, the nearest PCI-capable hospital can be notified once the diagnosis is made, the cardiac catheterisation laboratory (“cath lab”) activated, and the patient transported directly to the lab to meet the assembled team.4

Hospitals without PCI facilities should have the capacity to efficiently transfer high-risk STEMI patients to a PCI-capable hospital, with or without first providing fibrinolysis.5 This transfer is most efficient if done direct from the emergency department, and requires an undertaking from the ambulance service that these patients are a priority, and a similar commitment from the receiving PCI-capable hospital to provide emergency access to the cath lab. Hospitals with PCI services can shorten times to reperfusion through the application of simple local practices, including emergency department activation of the cath lab, emergency department bypass when the diagnosis has been made in the field, and routine feedback of outcomes to all those involved in provision of this service.6,7

Patients with non-ST-segment elevation ACS

Patients presenting with NSTEACS are usually older than those with STEMI, with more extensive coronary disease. Their inhospital mortality varies appreciably, driven partly by the acute myocardial risk and partly by the presence of comorbidities.8 Outcomes can be improved by application of intensive evidence-based care, including antithrombotic medications, revascularisation where appropriate, and application of secondary prevention strategies.9 There is strong, consistent evidence that patients at the highest risk, with the most to gain from evidence-based therapies, are the least likely to receive it.10 It appears that while clinicians recognise the contribution of factors — such as advanced age or presenting in cardiac failure or after cardiac arrest — to an adverse prognosis, there may be a reluctance to subject higher-risk patients to the risks of procedures or side effects of therapies, and uncertainty around the applicability of evidence to populations poorly represented in randomised trials.11,12

When clinicians do assign evidence-based treatments, they use clinical assessments that focus on the presence of ECG changes or biomarker elevation.13 Objective risk-stratification tools, which include other prognostic features including the presence of renal failure or advanced age, perform better than clinical assessment.1416 These are available as mobile apps or on the internet,17,18 but are rarely used in practice.15

Challenges to improving ACS care

There is an association between application of evidence-based care and outcomes in patients with ACS;19 however, strategies to systematically improve such care in Australia have proven disappointing. In the large Discharge Management of Acute Coronary Syndromes (DMACS) project, a strategy focused on academic detailing of hospital staff together with reminders and discharge tools improved prescription of evidence-based discharge therapies from 57% to 69%. Important barriers to further improving uptake included high turnover of resident medical staff and senior clinician behaviour. The latter was characterised by a reluctance to accept some guideline recommendations and an unwillingness to change established practice. Despite the inclusion of strategies to improve communication of discharge plans to GPs, when patients were surveyed at 3 months, rates had fallen to 48% and 52%, respectively.20 This suggests that additional factors conspire to erode continuation of evidence-based therapy after hospital discharge, and these are not affected by intensive inhospital interventions.

Embedding routine risk stratification into clinical practice

The earlier appropriate care is applied, the greater the likelihood of continued application of evidence-based care, and the better the outcomes.21,22 Because risk stratification should be one of the first objectives when assessing an ACS patient, it provides the earliest opportunity to define care. Application of a risk-stratification tool provides unambiguous definition of the patient at high risk, who has the most to gain from evidence-based care, and this strategy is recommended in local and international ACS guidelines.23,24 It is imperative that any risk tool be linked to treatment recommendations; the United Kingdom National Institute for Health and Care Excellence guidelines provide graded recommendations for evidence-based care based on the Global Registry of Acute Coronary Events (GRACE) risk score.24 Despite the consistency of guideline recommendations, it is important to recognise that there is no interventional evidence to demonstrate that implementation of risk scores influences improvements in care and outcomes, although one study addressing this question is underway in Australia (Australian Clinical Trial Registration no. 12614000550606).

Changing care in complex clinical environments is challenging. There are several overarching principles that govern successful practice change. These include securing administrative support, identifying clinical champions and ensuring the new practice has minimal impact on workload.

Opportunities for improving secondary prevention

Secondary prevention, including application of evidence-based therapies, cardiac rehabilitation, and long-term risk factor control contributes to prevention of half of the deaths after acute myocardial infarction, yet is consistently underused.25,26 Patients undergoing revascularisation are more likely to receive appropriate secondary prevention than those who do not, despite the fact that the latter are at higher risk of subsequent events.27 Failure to revascularise appears to initiate a cycle of missed opportunity that can be corrected by early application of risk-assessment algorithms. These tools should contain treatment recommendations that define the therapies to be considered in hospital and those to be continued after discharge. Ensuring continuation of therapies after discharge remains challenging, and will require greater engagement of providers in the community committed to partnering with their patients to increase adherence to lifestyle improvement, risk factor control, and pharmacological therapies.28

Eight challenges faced by general practitioners caring for patients after an acute coronary syndrome

General practitioners have an essential role in the management of patients who have recently been discharged from hospital after an acute coronary syndrome (ACS). As the duration of hospital stay has shortened over recent decades, this role has become even more important. There are many challenges facing the GP in fulfilling this demanding role. This article deals with eight common challenges faced by the GP caring for patients after an ACS.

Not enough information from the hospital

Insufficient documentation ranks as one of the major gripes of GPs dealing with hospitals. It is a worldwide problem, and not limited to ACS, although arguably of greater consequence in this potentially unpredictable and life-threatening condition. The discharge summary is the most important and often the only form of communication from hospitals to primary care. An Australian study in 2001 showed that only 37% of hospital discharge summaries reached the GP.1 Audits of discharge summaries in Victorian hospitals found high completion rates within hospital records (88%–100%) but significant delays in sending them to GPs (only 4%–32% within 14 days), with fewer than a third available to GPs at the first post-discharge visit.2 Quality improvement initiatives can improve these rates — a recent national audit as part of quality improvement showed that 77% of GPs reported receiving a discharge summary for patients with ACS at a median time of 3 days (range, 0–41 days) after discharge.3 The addition of electronic discharge summaries from hospitals in Australia has improved timeliness, with 83% of GPs receiving them within 2 weeks from hospitals with such a service.4

It is essential that the discharge summary from the hospital conveys the information necessary for the GP to manage the patient’s condition after hospital. The list of medications with proof of benefit is quite large, and the ACS patient may be taking an additional four or five new medications at discharge from hospital. The antithrombotic regimen varies according to whether the patient received conservative management, insertion of a bare-metal stent, or insertion of a drug-eluting stent in hospital.

The patient may be confused about the purpose of their medications or be unconvinced of their benefit, a setting ripe for non-adherence. There is clear evidence that non-adherence to evidence-based medications can have highly adverse effects on outcome after an ACS.5 A clear-cut management plan has been shown to improve adherence and to improve outcomes.6 This is recommended by the National Heart Foundation of Australia7 and should be considered as part of an overall effort to improve risk factor reduction, adherence to medications and improvement of outcomes.8 A timely hospital summary that includes this basic information avoids the patient and the GP wasting valuable time obtaining the information.

The patient is taking dual antiplatelet therapy and needs surgery

The patient who needs surgery during the 12 months after an ACS or insertion of a drug-eluting stent presents a particular challenge. In the stented patient, there is concern about the risk of stent thrombosis, and this is reduced with dual antiplatelet therapy (DAPT; ie, aspirin with a P2Y12 inhibitor such as clopidogrel, ticagrelor or prasugrel).9 Drug-eluting stents significantly reduce the risk of restenosis at the site of the stent, but require a longer period of DAPT than bare-metal stents to allow for re-endothelialisation of the coronary artery lesion.10 As a result, international guidelines recommend 1–3 months of DAPT for patients who have received a bare-metal stent and 12 months of DAPT for patients who have received a drug-eluting stent, with strict adherence to these guidelines recommended.11 Some cardiologists prefer a longer course of DAPT if there has been a complex percutaneous coronary intervention or if there is evidence of previous stent thrombosis. There are recent challenges to the recommendations, which have now been in place for more than 5 years and were based on data from older stents.12 A recent meta-analysis of more modern drug-eluting stent technology shows that 6 months of treatment compared with 12 months reduces the risk of bleeding without any adverse effect on stent thrombosis.13

For the patient requiring surgery while taking DAPT, close communication between the surgeon, cardiologist and GP is essential. The risk of thrombosis versus the risk of bleeding needs to be carefully assessed for each case.14 Some types of minor surgery (eg, removal of superficial skin lesions) can be undertaken while maintaining DAPT. Most surgical procedures can be conducted safely with the patient maintained on aspirin alone. For higher risk procedures, such as neurosurgical or neurovascular procedures, bridging with an alternative rapidly acting antiplatelet regimen using a glycoprotein IIb/IIIa inhibitor may be recommended.15

For those who have been managed conservatively, the relatively high risk of recurrence and the proven efficacy of DAPT16 has led to the current recommendation that DAPT remain for 12 months.17As these patients have not received a coronary stent, their risk of coronary thrombosis may be lower, particularly after the first few months. The patient needs to be apprised of the risks and engaged in the decision-making process.

The post-ACS patient with atrial fibrillation

Atrial fibrillation (AF) commonly coexists with coronary heart disease, or may occur after ACS.18 The antithrombotic regimen for the post-ACS patient targets atherothrombosis, and DAPT is mandated for 12 months after ACS for most patients (see above). The risk of stroke is a concern in patients with AF, with an annual risk of 5%, two to seven times that of people without AF.19 Aspirin, clopidogrel or DAPT have not been shown to be protective against the risk of stroke in AF,20 and anticoagulation with warfarin or a novel oral anticoagulant is recommended in all AF guidelines for patients at risk of stroke, as determined by their CHA2DS2-VASc (congestive heart failure, hypertension, age ≥ 75 years, diabetes mellitus, stroke, vascular disease, age 65 to 74 years, sex) score.21,22Therefore, most post-ACS patients with AF require triple antithrombotic therapy with a combination of an oral anticoagulant and DAPT. This nearly doubles the risk of bleeding compared with warfarin monotherapy, so the patient requires careful monitoring.23

Recent studies have looked at shortening the duration of DAPT with newer stents,13 or withdrawing one of the antiplatelet agents. A trial in post-stented patients with AF that compared the effect of triple antithrombotic therapy (aspirin, clopidogrel and warfarin) with that of double antithrombotic therapy (clopidogrel and warfarin) showed no adverse effects with stroke or coronary thrombosis and a substantial reduction in bleeding.24 Similar results were seen in the “real world” of a large Danish registry study.25 While this is not definitive evidence, it suggests that it may be possible to withdraw aspirin after a few weeks of triple antithrombotic therapy and continue with warfarin and clopidogrel. There are no clinical trials or observational studies to guide therapy in patients taking the new oral anticoagulants or with newer antiplatelet agents such as ticagrelor, and such studies are urgently needed.

The patient wants to consider smoking cessation medication

Smoking cessation is essential after an ACS. Although it is true that there have not been controlled clinical trials to confirm the benefits of cessation of smoking after an ACS, there are ample observational studies to show that continuation of smoking leads to greatly increased risk of death and recurrence of myocardial infarction,26 and cessation can reduce the risk by about a third.27 While unassisted cessation is the most effective method,28 the reality of clinical practice is that many patients feel they need assistance. A Cochrane review of nicotine replacement therapies (NRTs) in trials involving more than 50 000 patients has shown that all the methods of delivery (chewing gum, transdermal patches, oral and nasal sprays, inhalers and tablets/lozenges) are effective, at least in the short term, in assisting quitting, with 50%–70% of patients achieving abstinence.29

The Cochrane review confirmed that NRTs did not increase the risk of coronary events. Despite this, there are widespread apprehensions among patients30 and stop-smoking practitioners31 about the safety of NRTs, and this limits their use, effectiveness and adherence. GPs have an important role in reassuring post-ACS patients that these safety concerns are misplaced.32

Bupropion is an antidepressant with partial nicotine antagonist properties, and has been extensively evaluated as adjunctive therapy for smoking cessation. It is effective in the short term, and a Cochrane review showed no adverse cardiovascular effects.33 Varenicline has similarly been extensively evaluated in clinical trials, and formal analysis shows no adverse cardiovascular or serious psychiatric adverse effects.34 A summary of the evidence for NRTs, bupropion and varenicline concluded that combination NRTs and varenicline had the highest rate of cessation and the lowest risk of long-term relapse.35 Both varenicline and bupropion have United States Food and Drug Administration (FDA) warnings about the risk of unusual changes in behaviour, with thoughts of suicide or dying in some patients,36 but the warning does not refer specifically to cardiovascular risks for either drug. The GP can discuss the use of these smoking cessation drugs with their patients, and can reassure in general terms about the cardiovascular risks, but may conclude that counselling and support may be more appropriate.

The patient complains of persistent lethargy after ACS

With modern management, the patient who has recovered from an ACS without suffering extensive myocardial damage can usually be expected to return to normal activities a week or two after the event. Unusual lethargy continuing after a coronary event can be a major clinical challenge. Depression is a common comorbidity and an important factor indicating a poor prognosis,37 and should be actively considered in the patient with post-ACS lethargy. The American Heart Association has recently recommended that depression should be elevated to the status of a risk factor for adverse medical outcomes in patients with ACS. However, there is currently no evidence to link causality of depression to ACS, nor that treating depression improves survival from ACS.37

Tricyclic antidepressants have well recognised adverse cardiac effects38 and should be avoided except in low doses. A multicentre study showed that the selective serotonin reuptake inhibitor (SSRI) sertraline was safe and effective among post-ACS patients39 and, subsequently, meta-analysis of the SSRI trials have shown no adverse effect on cardiovascular outcomes.40

Drug-induced causes of lethargy should also be considered. With increasing use of potent antiplatelet regimens after ACS, the risk of gastrointestinal bleeding has increased, and this may lead to lethargy from iron-deficiency anaemia. The negative chronotropic effect of β-blockers may also contribute. There is ongoing debate about the ideal duration of β-blockers after ACS, but in the patient who has recovered well with no left ventricular dysfunction or angina, it may be possible to taper off the β-blocker without adverse effect.41

Hypotension and hypovolaemia are also common in the early post-hospital phase of ACS management. This may be due to unnecessary continuation of diuretics or over-enthusiastic dosing with angiotensin-converting enzyme (ACE) inhibitors. This is easily recognised and its early management can lead to a dramatic improvement in wellbeing. If the patient is free of symptoms of cardiac failure and there is no left ventricular dysfunction on echocardiography, there is no benefit in continuing diuretic therapy. Reduction of the dose of ACE inhibitor may be very helpful for the patient with lethargy from persistent hypotension. Of course, the patient may be lethargic because of cardiac failure, and it is important to check left ventricular function with an echocardiogram or by measuring B-type natriuretic peptide to rule out this possibility.

The patient wants to stop statin therapy

Statins have been extensively studied, and a detailed meta-analysis of 170 000 participants in 26 statin trials has shown them to be very effective and safe in most patients, with a 21%–22% relative risk reduction in cardiovascular disease events per 1 mmol/L reduction in low-density lipoprotein cholesterol (LDL-C) levels over 5 years.42 The evidence is so persuasive that most authoritative bodies now recommend that statins of moderate to high intensity be prescribed after ACS irrespective of the cholesterol level.43

However, there has been a lot of publicity in Australia about the side effects of statins. Some of the reporting has been alarmist and irresponsible,44 and many patients are confused about this issue. The highlighting in 2012 by the US FDA of possible cognitive dysfunction was a major concern for many patients.45 The FDA’s advice was widely promulgated despite meta-analysis of all studies from 1986 to 2012 showing no evidence of increase in dementia or Alzheimer disease.46,47The meta-analysis cited above showed no sign of an increase in cancer.46

An increase in the risk of rhabdomyolysis is the main serious side effect that has been shown with statins in controlled trials. This is exceedingly rare, occurring in about one patient per million prescriptions.48 It is dependent on the type of statin, with a higher rate from high-dose simvastatin than atorvastatin among post-ACS patients.49,50On the other hand, myalgia, with or without marginal elevation of creatine kinase, is common and may occur in about 10% of patients.51 Recent reports of an increase in diabetes52 are further cause for concern with some patients, but it is important to point out that a statin is one of the most effective treatments for lipid management in established diabetes.53

For the patient who is unconvinced by the overwhelming scientific data, a trial of a lower dose or a change in statin may be helpful. If the patient insists on a trial of alternative “natural” cholesterol-lowering drugs, this should be monitored with cholesterol levels if possible. A dramatic increase in total cholesterol or LDL-C level with alternative therapies may be sufficient to persuade the patient to continue with statin therapy. An agreement with the patient that a period of several weeks off the statin to assess the effect on muscle soreness or mental agility may demonstrate that the “side effects” are related to either normal sensations or other causes, rather than a drug side effect.

Among patients who have proven side effects, the use of an alternative LDL-C-lowering agent, such as ezetimibe, cholestyramine or newer experimental agents, may need to be considered. Ezetimibe can effectively lower LDL-C levels, but the benefit of this on outcomes is yet to be established.54 Nicotinic acid has not been shown to be effective.55

Dietary management has shown reductions in LDL-C levels. About 2 g/day of plant stanols and sterols has been shown to reduce LDL-C levels by about 10%,56 and the addition of fish oils in those who cannot take statins may show statistically significant reductions in adverse outcomes, despite conflicting recent meta-analyses.57 This dietary management for reduction in LDL-C levels can be additive to a low-fat diet and cholesterol-lowering medication.

The patient has not reached the target level with statin therapy

The target LDL-C level for post-ACS patients was set at < 1.8 mmol/L after the Pravastatin or Atorvastatin Evaluation and Infection Therapy-Thrombolysis in Myocardial Infarction 22 (PROVE IT – TIMI 22) study.49 This demonstrated that a high-intensity statin was more effective than a moderate-intensity statin. The median LDL-C level achieved during treatment in the high-intensity (atorvastatin 80 mg) group was 62 mg/dL (1.60 mmol/L) and in the moderate-intensity (pravastatin 40 mg) group was 95 mg/dL (2.46 mmol/L). The outcome was to set the US target level for post-ACS patients to below 70 mg/dL (1.8 mmol/L),58 and Australia followed suit on this.59

A recent revision of the US guidelines has recognised that the target levels were never tested in clinical trials and are based on an extrapolation of the clinical trial evidence.45 These new revised guidelines recommend high-intensity statin therapy (defined as a daily dose that lowers LDL-C by ≥ 50%) rather than moderate-intensity statin therapy (lowering LDL-C by 30% to < 50%). High-intensity statins available on the Australian Pharmaceutical Benefits Scheme are atorvastatin 40–80 mg and rosuvastatin 20–40 mg.

The GP’s role is to check that the patient is taking one of these drugs at the correct dose. If there is persistent elevation of the LDL-C level, a careful check on adherence may be needed. Statin adherence rates overall in Australia are low, with a community-wide study in 2011 showing 43% of patients discontinued statin within 6 months, 23% failed to collect their first repeat prescription at 1 month, and a median persistence of 11 months.60 If adherence has been confirmed, a higher dose of statin could be considered (eg, an increase of atorvastatin from 40 to 80 mg/day, or rosuvastatin from 20 to 40 mg/day). The addition of ezetimibe or another lipid-lowering agent to a statin has been shown to further lower LDL-C levels, but there is no current evidence of a benefit on cardiovascular outcomes.61

The patient seeks advice on erectile dysfunction and the safety of PDE5 inhibitors

People with coronary heart disease have a risk of erectile dysfunction because of the associated endothelial dysfunction,62 and possibly the effect of some cardiovascular drugs.63 While men are notoriously reluctant to seek advice on erectile dysfunction, it may be an indicator of worsened cardiovascular risk and the GP needs to be alert to subtle clues to indicate evidence of erectile dysfunction and encourage discussion.64 Adjustment of medications (such as reduction of β-blockers and diuretics)65 and reduction of cardiovascular risk factors may be helpful.66

Usually, however, use of phosphodiesterase type 5 (PDE5) inhibitors may need to be considered.67 There are multiple studies to confirm the overall safety of PDE5 inhibitors in patients with cardiovascular disease,68 although the longstanding caution that they must not be used in conjunction with nitrates remains valid.69 The GP must check the post-hospital medications to ensure that nitrates in any form (isosorbide mononitrate, nitrate patches, nicorandil) are not being taken by the patient, and that glyceryl trinitrate spray is not used within 24 hours of sildenafil or vardenafil administration or within 48 hours of tadalafil administration.64 Choice of PDE5 inhibitor is a matter of preference. A recent meta-analysis concluded the safety profile of each of the agents was similar.70 The use of low-dose daily tadalafil has been explored as an alternative to intermittent use, with some success and a good safety profile.71 The patient’s partner may express concern about “strain on the heart” of enhanced sexual activity with successful use of a PDE5 inhibitor, but the information that the absolute risk increase for myocardial infarction associated with 1 hour of sexual activity per week is estimated to be only 2 to 3 per 10 000 person-years may be of some reassurance.72

Conclusion

Of these eight challenges, most can be managed with improved communication between the hospital, the treating cardiologist and the GP. A team approach is essential to deliver effective evidence-based care. When balancing risks (for instance, bleeding versus thrombotic risk), the patient needs to be fully engaged in the decision making.

Adherence to secondary prevention therapies in acute coronary syndrome

“Drugs don’t work in patients who don’t take them.” — C Everett Koop

Despite the overwhelming evidence of the effectiveness of secondary prevention therapies,1,2 surveys locally and overseas indicate poor uptake of medical treatments and lifestyle recommendations after an acute coronary syndrome (ACS),3,4 and a concerning lack of recognition of this problem by clinicians.35 In one cross-sectional survey of Australian general practices, only about a half of patients with known coronary heart disease were taking recommended treatments.5 This is similar to findings from other high-income countries, and the situation is much worse in low- and middle-income countries.6 Adherence to lifestyle recommendations is also poor, with only about a third of patients adherent to lifestyle recommendations on diet, exercise and smoking 6 months after their ACS.7

The World Health Organization defines adherence as “the extent to which a person’s behaviour — taking medication, following a diet, and/or executing lifestyle changes, corresponds with agreed recommendations from a health care provider”.8 The terms compliance and adherence are conceptually similar. However, an important difference is that adherence better reflects active involvement of the patient and a therapeutic alliance with the physician, whereas compliance implies passive patient obedience.9,10 Poor adherence may be conscious or unconscious, and includes patients missing doses, missing days, taking drug “holidays”, and forgetting to renew their prescriptions. Adherence also encompasses persistence — the continued taking of medications for the intended course of therapy.

Poor adherence results from complex interplay of multiple factors (Box 1). At the individual level, this ranges from physical disability and mental health to patients’ perceptions of their illness, health literacy and social context.11 Physicians contribute to the problem by prescribing complex therapies, failing to identify non-adherence and failing to identify side effects. There is growing evidence that many trials underestimate the severity of side effects.12,13 Also, clinicians may fail to recognise non-adherence in as many as half of their patients identified as non-adherent based on pharmacy claims data.14

While an ACS event would be expected to motivate a person to change behaviour, patients stop taking their medications as early as a few weeks after discharge, and non-adherence rates increase with time.15,16 According to one study of 1521 patients with acute myocardial infarction (AMI), at 1 month after AMI, 18% reported discontinuing at least one of the three major drug classes (aspirin, β-blocker or statin).15

Not surprisingly, poor adherence is associated with worse outcomes. In one population-based longitudinal observational study of more than 30 000 AMI survivors, poor adherence to statins in the first year after AMI was associated with a 25% higher risk of mortality.17 Premature discontinuation of thienopyridines (eg, clopidogrel) within a month after an AMI treated with drug-eluting stents was associated with increased mortality during the next 11 months (7.5% v 0.7%; P < 0.001) and increased hospitalisation (23% v 14%; hazard ratio, 1.5).18 Similarly, among patients with stable coronary disease, non-adherence to angiotensin-converting enzyme (ACE) inhibitors, β-blockers and/or statins, identified in 25% of patients, were each associated with an increased relative risk of cardiovascular re-admissions (range, 10%–40%), coronary interventions (range, 10%–30%) and cardiovascular mortality (range, 50%–80%).19 Good adherence is associated with improved outcomes. In analyses of the CRUSADE ACS registry, every 10% increase in the overall composite guideline adherence was associated with a 10% decrease in the likelihood of inhospital mortality.20 Better outcomes with adherence may be due to a “healthy adherer” effect. In clinical trials, even patients more adherent to placebo have better outcomes.7,21

Detection of non-adherence

Measuring non-adherence is challenging. Even in the research setting, there is no gold standard tool. For some types of drugs, a direct technique can be applied; for example, measuring levels of the drug or its metabolite in blood or urine, or the effect of the drug on a known biochemical measure (eg, cholesterol levels). Other methods used in trials include pharmacy refill records and pill counts, but these do not account for “pill dumping” and pattern of intake (erratic timing). Several clinical trials use the MEMS (Medication Event Monitoring System), which is a microprocessor attached to a bottle to record the occurrence and timing of bottle opening. However, even this cannot assess whether the patient actually takes the drug once the bottle is opened. While there is potential bias associated with misreporting and self-report, standardised questionnaires remain important tools to quantify non-adherence (Box 2).25,26

Interventions to improve medical adherence

Several interventions that target the modifiable factors that influence adherence have been explored (Box 3). Systematic reviews have examined improving medical adherence among chronic disease patients and identified a diverse range of interventions, including many that are complex. However, they have struggled with classifying interventions and thus pooling them to enable a comparison of their efficacy.27

There is very little research that directly trials interventions that improve medical adherence to secondary prevention drugs among patients with coronary heart disease. Secondary prevention programs, including cardiac rehabilitation programs, often include modules that focus on supporting lifestyle modification, risk factor management and medical adherence.28,29 The intensity of these programs ranges from face-to-face involvement in inhospital programs and telephone counselling30 to — more recently — text message reminder systems.31 With regards to specific drugs, there has been examination of interventions to improve adherence to lipid-lowering drugs and hypertension medications in broader populations.32 The more recent of these, with respect to lipid-lowering drugs, identified 11 studies and concluded that patient re-enforcement and reminding was the most promising category of interventions — it was investigated in six trials, of which four showed improved adherence, with an absolute increase in adherence ranging from 6% to 24%.32

Another type of intervention that has been explored more recently involves simplifying the regimen by using fixed-dose combination medication. The UMPIRE study examined the impact of a fixed-dose combination (a four-drug combination of aspirin, ACE inhibitor, statin, and either a β-blocker or a thiazide) in 2000 patients. The self-reported adherence in the intervention arm (polypill) at median 15-month follow-up was significantly higher (86% v 65%; relative risk of being adherent, 1.33; 95% CI, 1.26–1.41; P < 0.001). The effect size was most marked among patients with poor baseline adherence.33

What can a physician do?

While there is increasing research interest in drug adherence, comprehensive data are not yet available. There is little literature on the comparative efficacy of interventions and, as such, there is no clear best way of achieving improved medical adherence. Also, it is unlikely that there will be a “one-size-fits-all” solution for all patients.34

From a practical viewpoint, some suggested approaches are described here. Screening for medical adherence can be done simply and should be done at every patient consultation. The most practical approach is to have a high index of suspicion, and to interview patients in a non-judgemental manner. The discussion can be initiated with a neutral question, for example:

  • “What do you think about taking these medications daily?”
  • “How often do you miss taking them?”

Patients should also be asked about the cost of therapy and its affordability. It may also be important to ask about missed doses over longer periods (eg, the past month), to avoid the potential for “white-coat adherence” — a transient improvement in adherence for a few days before and after health personnel contact. A potential approach to questioning patients on adherence from the National Heart Foundation is summarised in Box 4. The American College of Preventive Medicine has also identified an approach that can be categorised under the mnemonic SIMPLE (Box 5).36

Conclusion

Non-adherence is a serious problem and a particularly important issue for patients with chronic disease requiring multiple medications. Low adherence is associated with increasing morbidity, mortality and increased costs of health care. Already, several innovative and effective strategies exist to improve adherence. Our standard of care needs to include identifying whether non-adherence exists, what individual factors are influencing it and what interventions may minimise non-adherence.

1 Examples of factors that may reduce adherence to therapy

Patient

  • Physical impairment (impaired dexterity, poor vision)
  • Cognitive impairment
  • Psychological (depression)
  • Language barriers (non-English speaking)
  • Health literacy
  • Comorbidities

Health system

  • Poor patient–provider relationship
  • Health professionals’ lack of time and lack of incentives
  • Poor continuity of care (hospital–community care transition)
  • Geographic location and access to services, pharmacies and transport

Therapy

  • Complex regimen (multiple dosing during the day)
  • Complex dose (frequent titrations or substitution)
  • Polypharmacy
  • Side effects

Socioeconomic

  • Income
  • Low levels of patient education and/or literacy
  • Poor social support (single status)
  • Unstable living conditions (homeless, frequent travel, shift workers)

2 Self-report questionnaires to assess medication non-adherence

Questionnaire

Components

Features


BMQ22

Three sets of questions:

  • Five-item “regimen screen”
  • Two-item “recall screen”
  • Two-item “belief screen”

Validated against MEMS

MARS-523

Modified from MARS-10

Five-point Likert scale

First question: unintentional non-adherence

Other four statements: intentional non-adherence

Variable sensitivity reported in studies (when matched with pharmacy refill data)

MMAS24

Two versions:

  • MMAS-4 (original)
  • MMAS-8 (2008 modification)

Brief; ease of dichotomous response


BMQ = Brief Medication Questionnaire. MARS = Medication Adherence Rating Scale. MMAS = Morisky Medication Adherence Scale. MEMS = Medication Event Monitoring System.

3 Modifiable factors influencing adherence and persistence and examples of interventions

Modifiable factor

Intervention


Regimen complexity

Simpler, less frequent dosing regimen

Cost of therapy

Prescription of generic medications

Pill burden

Combination polypill

Improved tolerability

Selection of medication with low side-effect profile

Patient acceptance of disease

Health literacy and counselling

Patient trust in therapy

Patient–prescriber–pharmacist relationship

Forgetfulness

Reminders

4 Questions to ask patients to assess their adherence to medicines35

To assess medicine-taking behaviour

  • How are you going with those tablets?
  • How have you been taking these medicines?

To assess beliefs and attitudes

  • How do you feel about taking these medicines?
  • Have you ever thought about changing your medicines?
  • How well does this medicine work for you?

To assess both

  • It must be hard trying to remember to take the tablets every time. Do you ever forget? How do you feel about that?
  • People often have difficulty taking their pills, and I am interested in finding out any problems that occur so that I can understand them better. Do you ever miss taking your medicines? How often?
  • When you feel better, do you sometimes stop taking your medicine?

5 SIMPLE approach to enhance adherence36

S

Simplify the regimen

  • Adjust timing, frequency and number of tablets to suit patient
  • Attempt to change the situation, not the patient
  • Encourage use of adherence aids (eg, mobile app reminders)

I

Impart knowledge

  • Focus on patient–provider shared decision making
  • Provide written and verbal instructions
  • Simple language and 3–4 major points
  • Encourage involvement of nurse and pharmacist

M

Modify patient beliefs and human behaviour

  • Empower patient to self-manage the condition
  • Ensure patient understands the risk of not taking the medication
  • Address fears and concerns of patient

P

Provide communication and trust

  • Clear communication from provider
  • Build safe environment where patient feels comfortable
  • Informed and shared decision making

L

Leave bias

  • Self-learning exercise in area and incorporating into practice
  • Use of culturally and linguistically appropriate interventions
  • Tailor education to patient’s level of understanding

E

Evaluate adherence

  • Periodic review
  • Self-report and medication adherence scales
  • Biochemical tests — definitive confirmation

Are high coronary risk patients missing out on lipid-lowering drugs in Australia?

Lipid-lowering drugs (LLD), especially statins, are of proven benefit in preventing future coronary heart disease (CHD), both recurrent events and first events in those at high coronary risk.13 The Organisation for Economic Co-operation and Development (OECD) noted that consumption of LLD in Australia in 2011 was the highest of 23 countries reported.4 The rate was 50% higher than the OECD average and had risen more than 300% since 2000.4

Given this high level of use, it is important to know whether LLD are being prescribed for the correct mix of patients. The Australian ACACIA registry reported that statins were prescribed for 75%–89% of patients with acute coronary syndrome in 2005–2007, with the rate varying depending on the clinical presentation.5 Similarly, a large European survey of patients with CHD reported that 89% had been prescribed statins in 2006–2007,6 while a companion survey in the general practice setting found that 47% of “high-risk” patients with hypercholesterolaemia had been prescribed statins.7

The AusHEART study, an Australian general practice survey of risk factor perception and management in 2008, found that 50% of patients with established cardiovascular disease were prescribed a combination of statin, antihypertensive and antiplatelet therapy.8 Only a third of patients without established cardiovascular disease but at high risk of a first event were prescribed statin and antihypertensive medication.8 The AusDiab Study in 2011–2012 reported that 60% of people with diabetes were using statins.9 None of these outcomes take into account the poor long-term persistence in patients prescribed these and other cardiovascular drugs.1012

In previous studies, we have used the Pharmaceutical Benefits Scheme (PBS) database to explore patient behaviour in those prescribed various medications.1012 The database also contains information on co-prescriptions, which can be used as a surrogate for accompanying medical conditions. Here, we used the PBS database to explore whether patients arbitrarily defined as being at high coronary risk (those with prior CHD, diabetes or hypertension) are receiving LLD as they should, according to contemporary prevention guidelines.2,3

Methods

Data source

Dispensing is only recorded in the PBS database for patients classified as concession card holders, who are nevertheless estimated to represent 65% of all patients receiving statins.13 We analysed PBS pharmacy payment claim records for a 10% random sample of the included population. The data were drawn from de-identified records held by Medicare Australia, via the Department of Human Services, for the period January 2006 through May 2013, inclusive. Various statin drugs were priced below the general patient copayment threshold for some or all of this period, and no record of their prescription would have been sent to the PBS. Hence, our study was limited to patients who had received > 90% of their PBS prescriptions on a concessional basis during the study period, indicating that they were long-term concession card holders. Prescriptions for LLD included statins, fibrates and ezetimibe, although statin drugs were predominant.

Definition of surrogates

Groups of patients at high risk of future CHD were arbitrarily defined by the following co-prescriptions:

  • CHD: antiplatelet drugs (clopidogrel, prasugrel, not solo aspirin) and anti-anginal drugs (nitrates, nicorandil, perhexiline)
  • Diabetes: all standard drugs
  • Hypertension: all standard drugs (not solo diuretics).

To be classified in a high-risk group, patients needed to have three prescriptions for the specified drugs within 6 months at any time during the study period. Patients could belong to multiple groups.

Ethics approval

Patient identities remained anonymous during this investigation. Ethics and publication approval was obtained from the External Request Evaluation Committee of Medicare Australia.

Results

We extracted information from the PBS claims database on 853 836 concessional patients who had received PBS drugs during the study period (representative of 8 538 360 patients nationally). Of these, we classified 276 212 (32%) as being at high coronary risk. A comparison of the Australian population distribution with the concessional and high coronary risk populations is shown in Box 1. Compared with the Australian population, the distribution of concessional patients was shifted towards older age groups. High coronary risk patients were older than the overall concessional group (mean age, 66.1 [SD, 14.8] years, 44% male v 47.9 [SD, 28.0] years, 45% male).

Of the total concessional group, 657 454 patients (77%) were not prescribed any LLD during the study period. Of the total high coronary risk group, 115 477 (42%) were not prescribed any LLD.

Among the clinical groups of high-risk patients not receiving LLD, there were minor variations by age and sex (Box 2). For patients in a single risk-factor group, the proportion not receiving LLD was lowest in the CHD group (40%). For patients in multiple risk-factor groups, the proportions not receiving LLD were lower, down to 8% in the CHD + diabetes + hypertension group. Among all CHD groups combined, 19% of patients were not receiving LLD.

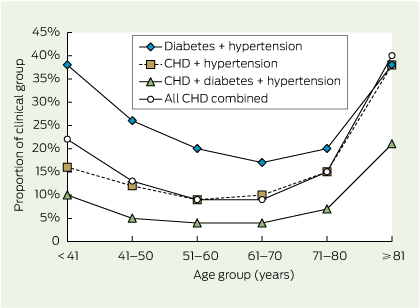
The proportions of patients in high-risk groups not receiving LLD are shown by age groups in Box 3. Across all risk groups, the proportions not receiving LLD were generally higher in the youngest and oldest age groups and lowest in those aged 51–70 years. This U-shaped relationship in the proportions not receiving LLD by age is clearly apparent for the largest multiple risk-factor groups in Box 4.

Discussion

Australia’s national guidelines for the primary or secondary prevention of CHD provide a general framework for appropriate management of all risk factors.2,3 However, such therapy needs to be individualised according to background risk, prognosis, comorbidities, drug tolerance, lifestyle and living circumstances, and personal choices.2,3 Hence, there can be no simple threshold for the proportion of people not treated that would signify undertreatment. Using conservative definitions for high coronary risk, we identified that the proportions of patients with multiple risk factors who were not receiving LLD are generally low, particularly in the CHD + diabetes + hypertension risk group.

Our findings are broadly consistent with Australian data for patients with CHD5 or diabetes,9 as well as data from Europe.6,7 The AusHEART study reported much higher proportions of patients with cardiovascular disease or at high risk of disease who were not receiving statins, antihypertensive therapy or antiplatelet drugs,8 but the findings were derived from general practice surveys and are not strictly comparable with administrative data from the PBS database.

We found that the concessional patient population was older than the Australian population and, not surprisingly, that the high coronary risk population was older still. The proportions of patients aged 71–80 and ≥ 81 years in the high-risk population were about fivefold those in the Australian population, reflecting a greater presence or risk of disease. The finding that greater proportions of those aged ≥ 81 years, and to a lesser extent those under 41 years, were not receiving LLD across all clinical groups is intriguing. This may represent a form of age discrimination and may not be consistent with national guidelines.2,3 The PBS database contains no further clinical information that might explain the behaviour of prescribers, but if there is a genuine bias against lipid-lowering therapy in these age groups, further research and education will be required.

There are limitations in our analysis. It was restricted to concessional patients; however, we have previously noted that concession card holders account for two-thirds of statin use.13 As the PBS database is administrative, with no relevant clinical information, we had no information on how well risk factors are controlled in these patients. The clinical definitions of high coronary risk we employed were conservative and would have good ability to identify high-risk patients, but would be less reliable in identifying those not at high risk. Very few patients using the nominated drugs would be misclassified as having CHD. There is minimal use of metformin in patients without diabetes (much less so in older patients), while some antihypertensive drugs are used for other indications, notably CHD. The major strength of our analysis is the use of a large, nationwide database.

Despite our study’s limitations, we also examined the reciprocal question of whether too many “low-risk” patients are receiving LLD. After subtracting data for the high-risk group from the total dataset of 853 836 concessional patients, we calculated that only 7% of those not identified as being at high coronary risk were receiving LLD. At limited face value, this is an encouraging statistic, given the high use of statin drugs in Australia.4

Our study suggests a large proportion of patients at high coronary risk, especially those with CHD and multiple risk factors, are being appropriately prescribed LLD in Australia. However, long-term persistence of therapy remains problematic10 and we have no information on how well risk factors are controlled. While use of LLD in Australia may be very high, it appears that middle-aged concession card holders at high coronary risk are being well managed.

1 Comparison of Australian population distribution with concessional and high coronary risk populations, by age*


Age group (years)


Population

< 41

41–50

51–60

61–70

71–80

≥ 81


Australian population (n = 22 710 352)

12 546 208 (55%)

3 143 550 (14%)

2 827 714 (12%)

2 165 462 (10%)

1 255 465 (6%)

771 953 (3%)

Concessional patients (n = 853 836)

367 141 (43%)

73 628 (9%)

63 695 (7%)

90 591 (11%)

135 129 (16%)

123 618 (14%)

High coronary risk patients (n = 276 212)

11 429 (4%)

17 122 (6%)

35 793 (13%)

88 210 (32%)

82 816 (30%)

40 842 (15%)


* Estimated Australian population at 30 June 2012.14 The other two groups are based on a 10% random sample of the Pharmaceutical Benefits Scheme database. Percentages refer to proportion of the population group (eg, 55% of the Australian population were aged < 41 years).

2 Mean age, sex and proportions of high coronary risk patients not receiving lipid-lowering drugs (LLD), by clinical group

Clinical group

No. of patients

Mean age (SD), years

Male

Not receiving LLD


CHD alone

6 696

74 (13)

3 375 (50%)

2 676 (40%)

Diabetes alone

12 713

68 (13)

6 191 (49%)

7 007 (55%)

Hypertension alone

166 094

53 (20)

66 105 (40%)

88 942 (54%)

Diabetes + hypertension

39 772

65 (12)

18 971 (48%)

8 543 (21%)

CHD + diabetes

853

74 (11)

465 (55%)

215 (25%)

CHD + hypertension

35 827

71 (13)

17 161 (48%)

6 983 (19%)

CHD + diabetes + hypertension

14 257

70 (10)

7 884 (55%)

1 111 (8%)

All CHD groups

57 633

66 (15)

28 817 (50%)

10 985 (19%)


CHD = coronary heart disease.

3 Numbers and proportions of high coronary risk patients not receiving lipid-lowering drugs, by clinical and age groups*


Age group (years)


Clinical group

< 41

41–50

51–60

61–70

71–80

≥ 81


CHD alone


No. (%)

56/104 (54%)

88/239 (37%)

141/512 (28%)

312/1480 (21%)

627/2023 (31%)

1452/2338 (62%)

P

0.000

0.000

0.003

reference

0.000

0.000

Diabetes alone


No. (%)

2680/3272 (82%)

981/1894 (52%)

871/2118 (41%)

1131/2822 (40%)

795/1800 (44%)

549/807 (68%)

P

0.000

0.000

ns

reference

0.006

0.000

Hypertension alone


No. (%)

4981/6173 (81%)

7537/10 579 (71%)

12 297/21 806 (56%)

27 210/56 274 (48%)

22 310/48 471 (46%)

14 607/22 791 (64%)

P

0.000

0.000

0.000

ns

reference

0.000

Diabetes + hypertension


No. (%)

546/1451 (38%)

794/3049 (26%)

1429/7147 (20%)

2394/14 120 (17%)

2207/10 901 (20%)

1173/3104 (38%)

P

0.000

0.000

0.000

reference

0.000

0.000

CHD + diabetes


No. (%)

4/17 (24%)

7/41 (17%)

13/109 (12%)

27/201 (13%)

65/275 (24%)

99/210 (47%)

P

ns

ns

reference

ns

0.010

0.000

CHD + hypertension


No. (%)

45/279 (16%)

97/823 (12%)

221/2418 (9%)

864/8789 (10%)

2098/13 918 (15%)

3658/9600 (38%)

P

0.000

0.028

reference

ns

0.000

0.000

CHD + diabetes + hypertension


No. (%)

13/133 (10%)

23/497 (5%)

64/1683 (4%)

180/4524 (4%)

402/5428 (7%)

428/1992 (21%)

P

0.001

ns

reference

ns

0.000

0.000

All CHD combined


No. (%)

118/533 (22%)

215/1600 (13%)

439/4722 (9%)

1384/14 994 (9%)

3192/21 644 (15%)

5637/14 140 (40%)

P

0.000

0.000

reference

ns

0.000

0.000


CHD = coronary heart disease. ns = not significant (> 0.05). * Percentages refer to the proportion of the clinical group. There was a pairwise comparison in each clinical group with the reference age category. The age category with the smallest percentage was used as the reference, employing a two-tailed Z test.

4 Proportions of high coronary risk patients in selected multiple risk-factor groups not receiving lipid-lowering drugs, by age group


CHD = coronary heart disease.

Close to the heart

An editor’s working life is a rather sedentary one and, unfortunately, an after-work burst of activity at the gym is unlikely to negate the full health risks of all that sitting. In this issue, Straker and colleagues (doi: 10.5694/mja13.00037) remind us of the health risks associated with excessive sedentary behaviour, particularly in the office, where many of us (not just editors) spend around half our sedentary time. They present data showing that risks of increased mortality, obesity and type 2 diabetes associated with sitting persist even when workers meet the recommended guidelines for physical activity outside the office. Although these cultural norms are unlikely to change in the near future, the authors propose that doctors advocate for increased movement in the workplace. However, the evidence for the value of intervening in the workplace is lacking, and the descriptive data are a good reason for a formal intervention study.

On the subject of cardiovascular health, Yip and colleagues (doi: 10.5694/mja13.00117) share with us their retrospective review of all patients presenting to an emergency department with suspected acute coronary syndrome (ACS). They compared the management of these patients 2 years before and 1 year after the introduction of a high-sensitivity cardiac troponin I (hscTn-I) assay in their centre. Somewhat reassuringly, they found no significant increases in rates of ACS diagnosis, hospital admission, invasive treatment or inhospital mortality from ACS. However, a higher proportion of patients underwent coronary angiography in the post-changeover period, as higher test sensitivity resulted in increased investigation. On a positive note, the hscTn-I assay was associated with lower median time spent in the emergency department: 3.85 h versus 4.35 h.

How useful might troponin testing be in general practice? Marshall and colleagues (doi: 10.5694/mja13.00173) describe the risks and benefits, and conclude that general practitioners should have a “high threshold” for ordering these tests. When suspicion of ACS is high, the preferred option is referral to hospital.

In an accompanying editorial, Chew and Cullen (doi: 10.5694/mja14.00858) write “Both of these articles [on troponin testing] highlight the challenges in translating this diagnostic innovation into effective health care and improved outcomes”. The real value of higher precision assays will be realised when clinical decision making evolves.

The safety of children is another matter close to our hearts (at least figuratively). Guthridge and colleagues (doi: 10.5694/mja14.00015) have used hospital admissions data for the period 1999–2010 to measure trends in rates of maltreatment of Aboriginal and non-Aboriginal children in the Northern Territory. For Aboriginal children, the average annual rate of admission with a definitive diagnosis of maltreatment was almost 10 times the rate for non-Aboriginal children. Rates for both groups did not change significantly over the 12-year period, which contrasts with increases reported from child protection services data. Reliable surveillance data are difficult to obtain, writes Vimpani in an accompanying editorial (doi: 10.5694/mja14.00650). Hospital data depend on clear and complete documentation, and he suggests the use of agreed protocols to improve the validity of documenting maltreatment.

The promise of high-sensitivity troponin testing

The benefits of diagnostic innovation rely on appropriate clinical practice reforms

The development of troponin T and I assays for assessing and managing patients with chest pain has revolutionised care for those with suspected or confirmed acute coronary syndromes.1 The availability of these assays has led to more patients who are at increased risk of recurrent cardiac events being identified, plus improvements in selecting patients who might benefit from early invasive management and revascularisation and more potent antithrombotic therapy. Development of point-of-care testing has extended the reach of these assays to inform the care of patients presenting in rural and remote areas of Australia.2

However, incremental improvements in analytical precision, with the emergence of assays that enable detection of serum troponin in up to half the apparently normal population, threaten to undo some of the initial gains offered by troponin testing.3 While increased sensitivity ensures that the problem of missed myocardial infarction (MI) is far less likely, it also creates the problem of reduced specificity. The consequence is a test with a lower positive predictive value for MI.

In this issue of the Journal, two articles highlight the practical implications of using assays with improved precision. One describes a large single-centre observational study comparing emergency department flow and cardiac investigations before and after the implementation of a troponin I assay with improved analytical precision. It shows moderate reductions in time spent in the emergency department with no significant changes in rates of admission to hospital or discharge with a diagnosis of acute coronary syndrome.4,5 Hence, it appears that the availability of a troponin assay with improved analytical precision offered the opportunity to arrive at a clinical decision to admit or discharge earlier, but did not change the proportions of patients for whom each of those decisions were made.6 Of note, there was a significant eight percentage point increase in coronary angiography rate without a commensurate increase in the rate of coronary revascularisation, suggesting a greater rate of invasive investigation that did not lead to coronary lesion-specific therapy. No difference in inhospital mortality due to acute coronary syndrome was observed, and differences in late outcomes would be of great interest but are not currently available.

The other article contemplates the utility of extending troponin testing to primary care to assess patients who present with chest pain. It underscores the challenges of interpreting troponin test results when faced with a single elevated value in a clinical setting where serial testing within hours is impractical because of long turnaround times for results.7 Thus, troponin testing may be useful for reassuring general practitioners in the context of intermediate or low clinical suspicion of MI, but only when sufficient time has passed since the resolution of symptoms to allow for evidence of myonecrosis (elevated troponin levels) to emerge if it was destined to do so. The pragmatic issue of receiving results in a timely manner to enable an appropriate clinical response remains problematic.

Both of these articles highlight the challenges in translating this diagnostic innovation into effective health care and improved outcomes. Merely improving test precision without an adaptive response in clinical decision making and test interpretation may be a possible driver for increased costs and inefficiencies.8 While troponin assays with higher analytical precision might offer improved patient outcomes through lower rates of missed MI, they could also increase the investigative burden borne by patients with abnormal test results because of the many non-coronary causes of detectable troponin. Complicating this further is the knowledge that troponin elevation deemed not to be due to unstable coronary plaque is still a marker of increased risk for late mortality, although the current evidence base cannot provide advice on appropriate investigation and management in this common situation.9

To reap the returns of improved patient outcomes by providing more efficient clinical care through widespread adoption of innovation in diagnostic testing, such as high-sensitivity troponin assays and point-of-care testing, clinical decision making will need to evolve. Diagnostic innovation will need be used in conjunction with more effective clinical practice, and be used by clinicians who have a clear understanding of the utility of the innovation and are able to appropriately harness the diagnostic information.10 This will require more robust protocols for risk quantification before troponin tests are requested, coupled with pathways for very early discharge and possibly investigations in ambulatory care settings.1113 Similarly, we urgently need a more sophisticated evidence base for assessing and managing patients who have elevated troponin levels that are deemed not due to an acute coronary syndrome. Only through further clinical and health service research, combined with clinical practice reforms focused on maximising the rule-out decision of a negative result and the risk information provided by a positive result, will we realise the promise of high-sensitivity troponin testing.

A systematic approach to chronic heart failure care: a consensus statement

Chronic heart failure (CHF) remains a major public health problem. CHF is not a static syndrome; individuals with CHF are at high risk of progressive cardiac dysfunction resulting in either sudden cardiac death or acute hospitalisation. Despite significant advances in CHF management, clinical outcomes are poor and associated with escalating health care costs.1 Worldwide, there are an estimated 23 million people living with CHF and 5.7 million new cases each year.2 With limited Australian data available, the Australian Institute of Health and Welfare has used overseas rates to suggest that 30 000 patients are diagnosed with incident heart failure annually and 300 000 people are living with CHF in Australia.3 The prevalence of CHF continues to rise as the population ages and survival from cardiovascular disease continues to improve.

Between 2006 and 2011, deaths from CHF in Australia rose by 20%.4 CHF prognosis remains poorer than that for common forms of cancer (in terms of individual survival and population life-years lost) for men and women.5,6 Hospital separations for CHF increased by 24% between 2002–03 and 2011–12.7 In the 2007–08 financial year, CHF was a primary diagnosis in 45 212 hospitalisations and a contributory diagnosis in 94 599 hospitalisations.8

The annual cost of CHF in Australia has been estimated at over $1 billion per year, with hospital care being the largest expenditure.9 A significant proportion of this cost is associated with preventable CHF readmissions. Readmissions within 30 days of discharge can be as high as 20%–27%.10,11 Overall, reported rates for readmission with CHF within 3–12 months of initial discharge are between 29% and 49%.12,13

Given the high rate of readmissions, there is profound potential to improve CHF-related outcomes, at both individual and societal levels, through improved quality of care and system change.14

Practice gaps

Recent studies have highlighted significant variations in access to evidence-based care for patients with CHF.1517 Many individuals are not diagnosed in a timely manner and subsequent management is suboptimal. Initial diagnostic delay is often due to under-recognition of early heart failure symptoms. This is compounded by limited availability of public sector services, particularly in rural and remote areas. Additionally, patient data are not shared across health services, largely due to lack of integrated information systems and care coordination.

These problems are amplified among marginalised populations. CHF is 1.7 times more common, and occurs at a younger age, among Aboriginal and Torres Strait Islander peoples than among other Australians.18 Aboriginal and Torres Strait Islander peoples are also more likely to die from CHF, and their rate of preventable CHF-related hospitalisations is three times higher than for non-Indigenous Australians.18 Such health disparities frequently occur due to poor access to evidence-based care. Availability of culturally appropriate services that provide earlier prevention, detection and management of CHF needs to be improved.

Among people hospitalised with CHF, those who receive evidence-based, multidisciplinary care have better health outcomes than those who do not.19,20 Current Australian guidelines articulate the evidence-based practices necessary to improve care delivery.21 However, the management of CHF remains a pressing concern, with many apparent indicators of poor case detection, non-guideline-based management, poor coordination and communication, and recurrent hospital admission.1517,22

In this consensus statement, our aim is to guide the policy and associated system changes required to support delivery of evidence-based care. This is not intended as a prescriptive guideline, rather a set of principles to assist health departments, health network administrators, clinicians and consumers in improving care systems for people living with CHF. Our intended audience is policymakers, health system managers, consumers and health professionals in acute and primary care, including cardiologists, general practitioners, nurses, dietitians and other members of the multidisciplinary team. The consensus development process is outlined in Box 1.

The expert panel identified four themes and five principles to inform the consensus statement (Box 2). The recommendations (Box 3) based on these themes have the potential to reduce the likelihood of emergency presentations, hospitalisations and premature death among patients with CHF.

Chronic heart failure care model

Best-practice management of CHF involves evidence-based, multidisciplinary, patient-centred care, which leads to better health outcomes.20,23 Patient-centred care is respectful of and responsive to preferences, needs and values of patients and consumers and should include dimensions of respect, emotional support, physical comfort, information and communication, continuity and transition, care coordination, involvement of family and carers, and access to care.23 Greater care coordination is needed because fragmentation across health care, long-term care and other social support systems effectively impedes a patient-centred focus.24 Research suggests that providing incentive payments through primary care payment schemes may improve care continuity and transition, as would streamlining funding for delivery of different levels of care.24

Multidisciplinary CHF care is distinguishable from generic chronic disease management programs by the special needs of these patients, which necessitate specialised evidence-based treatment strategies associated with optimal outcomes.25,26 Considerations include management of severely ill CHF patients, symptom monitoring, implementation of a range of self-management strategies and titration of medications.

Against a background of recent national health reform linking improved person-centred care with performance and funding arrangements, there is increasing interest in how to realign care systems accordingly. Research suggests that individuals value easy access to services, coordinated care, and information and honesty about their prognosis.27,28 Patient or consumer charters and informed consent policies have been introduced, but there is limited evidence that consumer engagement influences change in care delivery.29 Consumer engagement has been strengthened by the recent introduction of the National Safety and Quality Health Service Standards, which include a component on consumer partnership.30 The Standards deliver a framework that health organisations can use to actively engage and partner with consumers to strengthen health service delivery.30

Research suggests care coordination problems are greatest at the interfaces between health care sectors and between providers.24 Multidisciplinary care can overcome some of these barriers, as can pooling resources between sectors for care coordinators.24 Multidisciplinary program delivery needs to be appropriate to local needs, resources, patient preferences and disease trajectory phase, as well as across a range of delivery models, including home-based, clinic-based and telephone-based approaches, or a hybrid of these.17,31,32

CHF management plans that include a multidisciplinary approach are vital to educate and empower individuals and their carers to manage this challenging condition.11,33 Given limited resources, a risk assessment tool that stratifies patients at higher risk of readmission could be used to ensure those most likely to benefit from a management program are targeted.34 These plans should be clear about responsibilities among health care providers.

There are cardiac clinical networks in most Australian states and territories (Queensland, New South Wales, Victoria, South Australia, Western Australia, Northern Territory) that have championed access to evidence-based care for CHF patients. These networks have significant influence in improving care systems and outcomes, and can evaluate variance in care quality within and across jurisdictions, with the authority to develop funding models, including care packages. They can facilitate improvements in CHF care by fostering awareness, communication, partnerships and links; by engaging leaders across sectors; and by providing advice and advocacy for policy, planning and funding. The expert panel identified the clinical networks’ essential role in ensuring systematic delivery of a multidisciplinary care model, and concluded this role should be strengthened and further developed. Although multidisciplinary CHF management programs exist across Australia, ensuring access for all patients who would benefit remains a challenge. This is particularly so for Aboriginal and Torres Strait Islander peoples, those from non-metropolitan areas and lower socioeconomic backgrounds, and culturally and linguistically diverse populations.16,35

Implementation of patient-centred care approaches can also have clinical and operational benefits, through less frequent readmissions and improved clinician and patient satisfaction.3638 Other benefits include reduced emergency department re-presentations, fewer medication errors, higher functional status and improved evidence-based clinical care.38,39 There continues to be a large degree of heterogeneity between CHF programs,40 with some delivering high-quality complex care and others a simplistic program with minimal interventions. Research has shown that this has an impact on patient outcomes,41 and national guidelines have been developed to reduce this heterogeneity in Australia.21 Minimum accreditation standards are important for assessing multidisciplinary care services and reporting on best practice.16,42

Access to meaningful data for management and benchmarking

There is a paucity of Australian data on CHF, resulting in reliance on extrapolation of overseas research. Lack of identification of people with symptomatic CHF prevents efficient patient monitoring. Expansion of cardiac registries to include patients with CHF could improve identification. Recall between health care providers to ensure appropriate assessments and treatments are completed at pre-agreed intervals is also often uncoordinated. An electronic health record potentially offers the ideal tool to track, document and supply CHF patients or their carers and health care providers with the appropriate health care information, on demand, to optimise care.

Further, we do not have standardised outcomes to measure and evaluate care effectiveness and enable international and national benchmarking activity. The definition of a quality indicator must be specific, complete, clearly worded and verified across different user groups.43 Another barrier to measuring standardised outcomes is poor data system compatibility across and within health services, which prevents efficient transfer of data and results in duplication of patient data collection. These problems could be reduced through the use of better process measures.

Increasingly, hospital readmission is becoming an important indicator of health care outcomes, as it can be used to identify potentially preventable admissions. However, as a sole indicator, it can be problematic due to difficulties with interpretation, utility in the clinical environment, and problems such as poor attendance at outpatient clinics, which does not necessarily reflect poor hospital care. An operational definition for readmission needs to clearly identify the diagnosis-related group or major disease classification associated with the index admission.

Over a longer period, as readmissions occur due to the chronic nature of the disease, event-free survival provides a measure of quality.44 An event is defined as an emergency presentation, hospitalisation or premature death within any 12-month period.45

Workforce planning

Workforce needs are likely to be driven by the ageing population and associated disability rates, as well as changing technology, increased burden of disease and community expectations.46

One of the main challenges to workforce planning is providing access to services outside large cities. In 2006, Australian capital cities hosted 93% of CHF management programs, despite 40% of the known population with CHF living outside these cities.47 Policies that guide specialisation or multiskilling in the health workforce will become increasingly important.48

GPs should be empowered to lead care for patients with CHF. This may be through the introduction of funding incentives or provision of nurse practitioners and practice nurses in primary care. Any incentive arrangements should favour provision of care for Aboriginal and Torres Strait Islander peoples, those from lower socioeconomic backgrounds and rural areas, and culturally and linguistically diverse populations.49

Research

Future research activity needs to build in processes to ensure the dissemination and translation into practice of valuable knowledge; the creation of ethical and evidence-based research policies; and the promotion, monitoring and implementation of high-quality health research evidence.

Research and quality improvement activity priorities arising from this consensus statement are those relating to CHF care models (including development of readmission risk assessment models), access to meaningful data for management and benchmarking, and workforce planning. Focused investigative teams, such as clinical CHF research networks, could lead this work. In addition, more work needs to be undertaken among populations for whom frequent access to mainstream services is limited; namely Aboriginal and Torres Strait Islander peoples, those from non-metropolitan areas and lower socioeconomic backgrounds, and culturally and linguistically diverse populations.

Individuals with CHF have specific management needs. Future research should consider roles of specialty care teams (eg, cardiology, general medical) and the role of telehealth.

Conclusion

The current and future burden of CHF compels us to strive for equitable outcomes for all Australians. A national policy framework, with agreement between states, territories and the federal government, needs to be developed and implemented to tackle the increasing burden of CHF. Governments at national and state levels, together with cardiac clinical networks, need to ensure that evidence-based care models for people with CHF are standardised, with equitable access.

The core principles and recommendations described in this consensus statement should be incorporated into the various CHF systems of care operating across states and territories. Implementing these recommendations has the potential to improve the quality of care provided to individuals with CHF, reducing associated costs for both the individual and the community. Improvements could be seen not only in the care experienced by patients and their families, but also in clinical and operational benefits. Implementing multidisciplinary, patient-centred care approaches can shorten lengths of stay in hospital, reducing health care costs and improving clinician and patient satisfaction.22,44,45,50 In the longer term, other benefits of patient-centred care include reduced emergency department re-presentations, fewer medication errors, higher functional status and improved clinical care.4042

These recommendations can empower health care providers and organisations, peak and government organisations, care regulators, education providers and consumers to improve health outcomes for patients with CHF and to reduce harm. This work needs to be underpinned by nationally recognised standards for outcome measurement that are universally recognised and easily applied in practice. Data systems need to support evidence-based decision making, while providing feedback relating to standardised performance measures. Our health care workforce needs to be equipped to deal with the increasing burden of disease associated with CHF, with training, education and research around the delivery of multidisciplinary care in an increasingly complex environment.

These recommendations, if adopted, have the potential to facilitate and promote optimal and equitable health outcomes for all Australians diagnosed with CHF.

1 Consensus development process

The National Heart Foundation of Australia convened an expert panel to provide guidance on policy and system changes to improve the quality of care for people with chronic heart failure. A relevant literature search was performed, limited to evidence from human studies published in English between 2003 and 2013. This was complemented with hand searching of reference lists from reviews and personal collections of the expert panel, and additional peer-review. As there is limited evidence around the system changes required, these consensus recommendations are based on expert opinion. They are not exhaustive, and many other changes and actions can be implemented by both individuals and organisations to improve care outcomes. The recommendations are generally broad, rather than prescriptive, and many can be implemented with minimal resourcing.

2 Themes and principles to reduce emergency presentations, hospitalisations and premature death among patients with chronic heart failure (CHF)

Theme

Principle


CHF care model

Current evidence clearly identifies that accessible, multidisciplinary, guideline-based CHF care improves outcomes.

Access to meaningful data for management and benchmarking

Collecting outcome data is the only accurate way of determining the effectiveness and cost of individual treatments; practice standards can then be based on up-to-date comparative effectiveness research.

Adequate patient information is a prerequisite for reducing unnecessary hospital admissions and medical errors.

Workforce planning

An appropriately trained workforce with access to specialist cardiology support can deliver evidence-based care.

Research

Research is essential to ensure an evidence base.

3 Recommendations to achieve a systematic approach to chronic heart failure (CHF) care*

CHF care model

1. Through state and territory cardiac clinical networks, support health departments to continue leading the development of integrated local care systems and future national quality improvement strategies within and across health services.

2. Identify and implement mechanisms to champion the uptake of clinical practice guidelines and delivery of integrated CHF services, according to local population need, within and across health services.

3. Develop minimum standards for CHF multidisciplinary care, which can be used to accredit health services and recognise best-practice health services or networks.

4. Develop robust funding models and examine the role of funded care packages in CHF care.

5. Establish system protocols and pathways to ensure effective clinical handover and service coordination across care transitions, and to activate appropriate services according to clinical need for an exacerbation, emergency presentation, hospitalisation or palliation.

6. Streamline care processes to facilitate early diagnosis, self-management and multidisciplinary care planning, including primary care involvement and appropriate access to palliative services.

7. Embed mechanisms to promote the rights of individuals and their carers to facilitate their active engagement with health professionals and care systems.

Access to meaningful data for management and benchmarking

8. Develop national data definitions for CHF.

9. Expand current cardiac registries to include patients with CHF.

10. Develop mechanisms to promote data linkage across care transitions.

11. Trial an electronic health record for people diagnosed with CHF, so all current and future health care providers could, with the individual’s consent, have access to the same information where and when they need it.

12. Use 12-month event-free survival as an outcome measure nationally to evaluate effectiveness of care systems. Events would include emergency presentations, hospitalisations and premature death.

13. Establish a national mechanism for monitoring and reporting CHF care outcomes against a nationally recognised set of goals and standards.

14. Develop a national set of indicators and standards to evaluate, inform and improve systems of care.

Workforce planning

15. Develop the workforce capacity across hospital and community services to deliver evidence-based care, appropriate to the local population, as identified in Guidelines for the prevention, detection and management of chronic heart failure in Australia31 and Multidisciplinary care for people with chronic heart failure: principles and recommendations for best practice.21

16. Develop robust funding models for the delivery of these services.

17. Examine mechanisms to empower general practitioners and other health care professionals in primary care to deliver evidence-based care for people with CHF.

Research

18. Create investigative teams, such as clinical CHF research networks, with active consumer collaboration.

19. Investigate approaches to optimise care delivery for Aboriginal and Torres Strait Islander peoples, those from non-metropolitan areas and lower socioeconomic backgrounds, and culturally and linguistically diverse populations.


* Level of evidence: expert panel consensus judgement. † Health services include area health services, local hospital networks, primary care, Aboriginal community controlled health organisations, aged care services and other appropriate agencies.

Should general practitioners order troponin tests?

Cardiac troponin I and T are the preferred biomarkers for assessing myocardial injury. Understanding the pathobiology of troponin and the timing of troponin testing is fundamental to the clinical utility of these biomarkers, as troponin and its kinetics are central to the universal definition of acute myocardial infarction (AMI).1 Troponin levels become elevated in serum within a few hours of an AMI, and they remain elevated for up to 7–10 days.2 However, numerous other conditions may elevate troponin levels, so it remains essential that the results of troponin tests be interpreted with clinical findings and electrocardiography results.3 The dynamics of troponin levels (rise and/or fall over time) help distinguish AMI from non-AMI conditions, thus serial troponin testing is the standard approach recommended for assessing patients with suspected acute coronary syndrome (ACS).4 In this article, we explore troponin testing in general practice, including problems faced by laboratories that offer testing in this context.

The absolutist stance

One stance on this topic is that general practitioners should never order a troponin test. The basis of this argument is that the only widely accepted clinical indication for measurement of troponin levels is suspected ACS, which should prompt referral to hospital based on clinical and electrocardiography findings without recourse to troponin testing. Supporting this argument is that serial troponin testing is unrealistic in most general practice settings, and opens the question of how a patient should be monitored while the results are awaited.

One argument against this absolutist stance is that it is an oversimplification. Further investigation and management depends on the degree of suspicion for ACS, and timing of the presentation may obviate the need for serial testing. Chest pain is a challenging symptom and the prevalence of unstable angina or AMI in general practice is low, in the order of fewer than 5% of patients with chest pain.5 Atypical presentations of AMI, such as in young people,6 people with diabetes and older people, are a perennial concern. GPs have been shown to be fairly accurate in assessing chest pain clinically as due to coronary artery disease, but not accurate enough to safely exclude it.7 A system of estimating pretest probability of ACS, or risk of short-term complications, is an attractive approach. Clinical decision-making rules and pretest probability tables have been developed to assist with this process in general practice8,9 and, while some risk stratification tools may be more relevant to doctors in emergency departments, they are potentially useful to GPs.10,11 How troponin testing might fit into risk stratification in general practice is not entirely clear.

How well do GPs understand troponin tests?

Audits from New Zealand suggest that GPs have a generally sufficient understanding of the use of troponin tests in primary care.12,13 Knowledge of false-negative results (eg, due to sampling too soon after symptoms) appears to be better than knowledge of false-positive results (eg, due to non-AMI causes of raised troponin levels). Most GPs would refer high-risk patients without troponin testing, but a small proportion of GPs would defer hospitalisation while waiting for the troponin result (mostly for patients with an intermediate probability of AMI).

Why do GPs request troponin tests?

Our experience suggests that GPs mainly request troponin tests to rule out AMI in one of two situations. The first situation is patients who had symptoms in the preceding days but for whom symptoms have resolved (also the experience of others13,14). One expert has suggested that this may be a justifiable use of troponin testing in primary care15 and troponin testing is suggested in National Institute for Health and Care Excellence (NICE) primary care guidelines in pain-free patients who had chest pain more than 72 hours earlier.9 The second situation is patients who have atypical symptoms and/or a low likelihood of ACS, in whom troponin testing appears to cover the residual clinical uncertainty. Unexpectedly positive troponin results occasionally occur in such situations, which may otherwise not be detected.

How do GPs currently request troponin tests?

Most requests for troponin testing from general practice are requests for a single test, not serial testing.16 This begs the question of whether ordering a single troponin test is an appropriate strategy. Given our understanding of troponin kinetics, a single negative troponin test result a certain time after symptom onset could be clinically useful in ruling out AMI (ie, in “late presenters”). The suggested time frame varies between publications, but is usually in the order of 6–9 hours4,17 with the caveat that the time of symptom onset can be unreliable. Local experts have suggested that a single troponin test 12 hours after resolution of suggestive symptoms (with a normal electrocardiogram and no high-risk features) is useful for this purpose.11 With the so-called high-sensitivity troponin assays, this window may decrease: in an emergency department setting, an undetectable (ie, not merely negative) troponin value obtained from a high-sensitivity troponin assay at presentation has been shown to have a very high negative predictive value for a subsequent diagnosis of AMI,18 but this strategy is experimental. The safest rule of thumb is that a single negative test result for troponin does not exclude AMI in a patient with current or very recent symptoms, nor does it exclude clinically significant coronary artery disease.

Conditions associated with chronic troponin elevation

As most GP requests for troponin testing are for a single test, conditions associated with chronic, non-AMI elevation of troponin levels present a problem. Examples include chronic cardiac failure and chronic kidney disease (CKD). A positive result from a single troponin test could be misleading because it might reflect the underlying chronic disease and not AMI. The prevalence of positive troponin test results (defined as above the 99th percentile of the general population) in CKD depends on the stage of the CKD (positive results are more likely during more advanced stages) and on the troponin assay used. This is exemplified by a recent study of asymptomatic patients who had CKD but were not on dialysis. The prevalence of a positive troponin result (for the whole cohort) was 68% when a high-sensitivity troponin T assay was used, 38% when a high-sensitivity troponin I assay was used, and 16% and 8% for troponin T and I, respectively, when contemporary (“less sensitive”) assays were used.19 Despite the high rates of positive troponin results in this study, a negative troponin result from a sample taken at an appropriate time is useful for ruling out AMI in patients who have CKD, but at the considerable disadvantage of reduced positive predictive value, with the attendant risk of unnecessary hospitalisation. Clinical assessment of the acute event in such patients becomes all the more important if this is to be avoided.

Logistics of troponin testing for outpatients

Offering troponin testing in the community is logistically complex and there is a lack of formal guidance for laboratories in this area. Guidelines on management of ACS recommend that a troponin test result should be available within 60 minutes of blood being drawn and, if not, that point-of-care testing should be available.4 This is aimed at hospital-based laboratories and is not a realistic target for large private pathology networks that may test hundreds of community samples per day at variable geographical distances from large networks of collection centres and general practices. So what is the solution? Accept the longer turnaround times and promote judicious use of troponin tests by GPs? Longer turnaround times may be acceptable if testing is largely confined to patients who have a low pretest probability, or low risk, of AMI. If so, what is a reasonable turnaround time for community samples — three hours? Six? At the other extreme is rigorous pursuit of fast turnaround times to meet the apparent clinical need in the community, probably with the help of point-of-care testing, although there are questions about the performance of point-of-care troponin assays.20 The solution is probably a compromise between the two. The only guidelines that provide advice on this are the NICE guidelines, which state that troponin testing can be undertaken in general practice “providing timely results can be obtained” but do not elaborate on what “timely” means.9

After-hours elevated troponin levels can be problematic for all concerned. For example, when samples are taken late in the afternoon, results might not be available until after clinic hours. A common policy is to treat positive troponin test results as “critical results” and to notify the requesting doctor or a representative (such as a locum GP service, if nominated). In the event that a doctor cannot be found to take the result, which is not uncommon in our experience, laboratory staff (usually pathologists) phone patients directly and advise that hospitalisation is the safest course of action. But when a patient cannot be contacted, laboratory staff face a dilemma: can the result wait until office hours, or should emergency services be arranged? We are aware of anecdotal cases in which after-hours notifications of high troponin levels to patients at home have probably contributed to their early survival — but this raises the question of whether such patients are better served by referral to hospital in the first instance. A published coroner’s case touches on these important issues for both GPs and pathologists.21

Conclusion

We suggest that GPs should have a high threshold for requesting troponin testing and carefully assess risk before ordering troponin tests. Positive troponin test results usually change the course of management, but the time frame in which the result becomes available must be balanced against the risk of delay in diagnosis and therapy. A troponin test should not be requested unless a GP is certain that a robust process is in place by which they can be contacted, day or night, if the result is positive. There is an obvious need for further education, research and inclusion of this topic in future clinical guidelines. Our suggestions for using, or not using, troponin tests in general practice are summarised in the Box.

Suggestions for using, or not using, troponin tests in general practice

The default position

  • The default position for patients who have symptoms suggestive of acute coronary syndrome is hospitalisation without prior troponin testing.

Using a single troponin test

  • It is reasonable to use a single troponin test in general practice to exclude the possibility of acute myocardial infarction (AMI) in asymptomatic patients whose symptoms (typical or otherwise) resolved at least 12 hours prior, so long as they have no high-risk features and a normal electrocardiogram.11
  • A single troponin test may also be useful to investigate an otherwise unexplained creatine kinase elevation.

Using serial troponin tests

  • In patients presenting to general practice within 12 hours of symptom onset who are at low risk of AMI and/or have atypical symptoms, and for whom troponin testing is being considered, serial testing is advised.
  • In patients with conditions that are associated with a high prevalence of positive troponin test results, such as chronic kidney disease, a single test can be misleading. Serial testing may be required to resolve clinical uncertainty.
  • Serial testing is most appropriately performed in hospital. The safety of serial testing in outpatient settings has not been established.

Impact of high-sensitivity cardiac troponin I assays on patients presenting to an emergency department with suspected acute coronary syndrome

Cardiac troponins have long been used as the biomarker of choice to aid the diagnosis of acute myocardial infarction (AMI).1 In the consensus document on the universal definition of myocardial infarction, a key component in making the diagnosis of AMI is a rise and/or fall in levels of cardiac biomarkers, with at least one value above the 99th percentile value for a reference population.2 Recently, high-sensitivity cardiac troponin (hscTn) assays were introduced into clinical practice in Australia. These assays have improved detection at the lower limits of troponin levels, enabling troponin levels to be measured even in healthy individuals.3,4 They have been shown to detect myocardial infarction earlier than previously used assays.58 In addition, hscTn assays identify more patients with myocardial damage and those who are at an increased risk of future cardiac events.9,10 However, with this increase in sensitivity comes a reduced specificity.6,11 Consequently, more patients may be labelled with a diagnosis of acute coronary syndrome (ACS).10 The importance of interpreting troponin results in the context of the clinical presentation and in association with complementary criteria has therefore been highlighted.2,12,13

The aim of our study was to determine whether the introduction of hscTn-I assays had an impact on patients presenting with suspected ACS to the emergency department (ED) of a tertiary referral hospital, in terms of hospital admission rates, time spent in the ED and subsequent management and outcomes. We hypothesised that more patients would undergo coronary angiography and invasive treatment (percutaneous coronary intervention [PCI] and/or coronary artery bypass graft surgery [CABGS]) after the changeover, owing to small increases in troponin levels that would previously have been below the diagnostic threshold.

Methods

Geelong Hospital is a major public teaching hospital in Victoria, Australia. It is part of Barwon Health and provides services to the Barwon region, which has a population of about 300 000. Geelong Hospital’s ED is the only tertiary ED in Victoria that is located outside metropolitan Melbourne.

On 23 April 2012, hscTn-I assays were introduced to Geelong Hospital, with complete cessation of the previously used assay. The previously used assay is a troponin I assay that is carried out using the Dimension RxL Max analyser (Siemens Healthcare). It has a lower limit of detection (LoD) of 0.04 µg/L, a 99th percentile of 0.07 µg/L with an imprecision of 15%–22% coefficient of variation (CV), and a CV of 10% at 0.14 µg/L; the diagnostic threshold is set at 0.10 µg/L. The new assay is a hscTn-I assay that is carried out using the Dimension Vista system (Siemens Healthcare), which uses luminescent oxygen channelling immunoassay technology. It has an LoD of 0.015 µg/L, a 99th percentile of 0.045 µg/L, and a CV of 10% at < 0.04 µg/L; the diagnostic threshold is set at 0.045 µg/L. The hscTn-I assay is used, and its results interpreted, according to the 2011 addendum to the 2006 guidelines for management of ACS.14 In particular, the results were considered positive when the hscTn-I level was ≥ 99th percentile and there was a change of ≥ 50% above a baseline level.

The design of our study was a pre–post changeover comparison. All patients who presented to the ED with suspected ACS from 23 April 2010 to 22 April 2013 were included. Suspected ACS was based on the diagnosis made by ED medical staff. The discharge diagnosis of ACS (defined by myocardial infarction or angina) was made by hospital in-house medical staff. Patients were categorised as presenting during the 2 years before the changeover or during the 1 year after the changeover. The 2-year and 1-year periods of data collection allowed for possible seasonality.

Data for consecutive patients were obtained from medical records provided by Health Information Services at Barwon Health. We had full access to both ED and hospital datasets of the studied population.

The numbers of patients presenting to the ED with suspected ACS, and the rates of admission to hospitals (both public and private), were determined. For those admitted to Geelong Hospital, we determined the percentage who underwent coronary angiography, the percentage who had invasive treatment, the percentage who were discharged with a diagnosis of ACS, and the rate of inhospital mortality due to ACS.

The study was approved by Barwon Health Human Research Ethics Committee.

Statistical analysis

The numbers of patients who presented to the ED with suspected ACS and the rates of hospital admission were assessed monthly to determine the presence of autocorrelation in the time series. There was no autocorrelation present, so standard linear models were used in a segmented regression analysis to investigate any shifts in level or changes in trend over time of the respective measures.

The rates of admission, coronary angiography, invasive treatment, discharge with ACS diagnosis and inhospital mortality due to ACS for the two patient groups were compared using 95% confidence intervals, calculated by inverting the score test (all intervals are shown as post-changeover value minus pre- changeover value). Comparisons (and 95% confidence intervals) for ordinal variables were calculated as the median of differences between patient groups. Comparisons for numerical variables (age and time spent in the ED) were calculated as difference in medians (and 95% confidence intervals) using bootstrapping.

Results

During the study period, 12 360 consecutive patients presented to the Geelong Hospital ED with suspected ACS; 1897 were admitted to Geelong Hospital before the changeover and 944 were admitted to Geelong Hospital after the changeover.

Characteristics of the two patient groups are shown in Box 1. No statistically significant differences were found between the groups in terms of sex, age, hypertension and previous ischaemic heart disease. A lower prevalence of smoking history was noted in the post-changeover group, but no statistically significant difference in smoking history was noted among those admitted to Geelong Hospital (50.4% [956/1897] before the changeover v 53.5% [505/944] after the changeover; 95% CI for the difference, − 7.0 to 0.8; P = 0.12). Data on diabetes were available but not analysed because of undercoding of this condition in medical records and changes in diabetes coding definitions during the study period.

Presentation and admission rates

There was no statistically significant difference over time in numbers of patients who presented to the ED with suspected ACS (mean difference, 18.8 patients/month; 95% CI for the difference, − 3.2 to 40.7; P = 0.09). The all-hospital admission rates were not statistically different for the two patient groups: 31.1% (2518/8090) and 29.7% (1268/4270) for the pre-changeover and post-changeover groups, respectively (95% CI for the difference, − 3.1% to 0.3%; P = 0.10). The Geelong Hospital admission rates were also not statistically different: 23.4% (1897/8090) and 22.1% (944/4270), respectively (95% CI for the difference, − 2.9% to 0.2%; P = 0.09).

Time in the emergency department

For patients presenting to the ED with suspected ACS, median time spent in the ED was 11.5% shorter in the post-changeover period compared with pre-changeover period (3.85 h v 4.35 h; 95% CI for the difference, − 0.59 to − 0.43; P < 0.001).

Discharge and management

The proportion of ED patients with suspected ACS admitted to Geelong Hospital who were subsequently discharged with an ACS diagnosis was 56.5% (1072/1897) in the pre-changeover period and 58.1% (548/944) in the post-changeover period. This difference was not statistically different (95% CI for the difference, − 2.3% to 5.4%; P = 0.43).

Among the patients admitted to Geelong Hospital, 45.2% (858/1897) underwent coronary angiography in the pre-changeover period. This rose to 53.4% (504/944) following the introduction of hscTn-I assays, representing a statistically significant increase of 8.2 percentage points in absolute terms (95% CI for the difference, 4.3 to 12.0 percentage points; P < 0.001). For invasive treatment (PCI and/or CABGS), proportions in the pre-changeover and post-changeover periods were 21.8% (413/1897) and 24.7% (233/944), respectively. Despite the slight increase, this difference was not statistically significant (95% CI for the difference, − 0.4% to 6.3%; P = 0.08).

Inhospital mortality

The numbers of deaths from ACS that occurred in patients admitted to Geelong Hospital from the ED with suspected ACS are shown in Box 2. There was no statistically significant difference between the two periods (95% CI for the difference, − 1.5% to 0.8%; P = 0.43).

Discussion

In our study, introduction of hscTn-I assays did not change hospital admission rates for suspected ACS or the proportion of patients discharged with a diagnosis of ACS. The changeover appeared to be associated with more rapid diagnosis, resulting in patients spending less time in the ED. Although there was an increase in the proportion of patients for whom coronary angiography was performed, there was no significant increase in invasive treatment or change in inhospital mortality.

Some authors have reported that the number of patients labelled with ACS has increased after introduction of hscTn assays, owing to lowering of the diagnostic threshold.10,15 In particular, it has been suggested that adopting the 99th percentile value for plasma troponin (as recommended in the consensus document on the universal definition of myocardial infarction2) would increase the number of people receiving a diagnosis of AMI by 47%.10 Our results indicate that such an increase in the diagnosis of ACS did not occur.

Our experience suggests that “ultra-precision” in the measurement of cardiac troponin may not cause further changes in the rate of clinical diagnosis of ACS. This is similar to findings from the Brigham and Women’s Hospital clinical laboratories in 2007 — a doubling in the number of positive troponin results in the ED after introducing a hscTn-I assay, but no change in the frequency of a final diagnosis of ACS.15 This suggests that proper interpretation of troponin results (including rise and fall in troponin levels determined by hscTn assays [“delta troponin”]) with appropriate attention to clinical signs and symptoms, electrocardiography results, and other complementary data may prevent increases in rates of diagnosis of ACS that might otherwise be associated with use of hscTn assays.

Nonetheless, patients in our study spent less time in the ED after the changeover to hscTn-I assays. With earlier generation cardiac troponin assays, troponin rise can only be detected after a post-AMI period of at least 3–4 hours; also, repeat sampling 6–12 hours later is often needed to exclude the possibility of myocardial damage.16,17 With hscTn assays, a rise can be identified earlier and it can reduce the time to rule in or rule out a diagnosis of AMI.58,11,1820 The cumulative sensitivity of a sensitive cardiac troponin I assay using a diagnostic threshold of 99th percentile (0.07 μg/L) has been reported as 93% at 30 minutes after presentation, 98% at 2 hours, and 100% at 3 hours, with a specificity of 57% at 2 hours and 54% at 3 hours.21 Delays in ruling out AMI contribute to overcrowding in EDs, which is associated with substantial costs. In 2011, it was suggested that initially undetectable levels of troponin based on hscTn-T assays would have ruled out AMI in 27.7% of patients with a sensitivity of 100%.19 In 2012, an algorithm for using hscTn-T assays to rule in and rule out AMI was published; it incorporated baseline troponin thresholds and thresholds for rises in troponin during the first hour.20 Applied to 436 patients, within the first hour of presentation, AMI could be ruled out for 60% of patients and ruled in for 17%, leaving 23% in an “observation zone”. No AMI was missed in the rule-out group. However, no such algorithm was used in our study population.

The impact that hscTn assays have had on early diagnosis of AMI58,11,19,20 and survival prognostication9,22 has been reported extensively. Although it has been reported that early generation “sensitive” troponin assays capable of lowering the diagnostic threshold (but not to the level of the 99th percentile) were associated with a change in clinical practice (more referrals to cardiac specialists, more coronary angiographies and wider use of evidenced-based treatments),23 no previous studies have directly examined the effect of the introduction of hscTn assays (now with a diagnostic threshold down to the 99th percentile) on coronary angiography and invasive treatment rates. As hypothesised, we observed a significant increase in coronary angiography rates. This could not be explained by any change in cardiac catheterisation laboratory availability as there had been no significant structural change during the study period.

However, we did not observe a proportional increase in invasive treatment rates, which remained stable. During the study period, there was no change in funding practice that might have affected the way PCI and CABGS services were delivered. Understandably, patients not receiving invasive treatment may have been started on medical therapy or may have had existing medications up-titrated (factors that we did not examine). Some of these patients may have had troponin rises due to type 2 myocardial infarction (eg, sepsis, hypertensive crisis or tachycardic atrial fibrillation2), or other pathophysiological situations leading to myocardial cell death.8,24 With even more sensitive cardiac troponin assays (“ultra-sensitive” or “novel highly sensitive” assays) in the pipeline,12,13,25 these new generations of biomarker assays will continue to present myriad challenges for clinicians evaluating patients with suspected ACS. The adoption of this quickly evolving technology should be accompanied by algorithms — which, ideally, should be validated — to enhance assay performance in terms of specificity, positive predictive values and ability to guide referrals, additional investigations and treatment.

Our study had six main limitations. First, it was retrospective and we relied on diagnoses given by ED staff to determine which patients presented with suspected ACS. Second, our findings represent one tertiary centre. However, given the diverse population and large area that the Geelong Hospital ED serves, our study population is likely to be representative of the general Australian population presenting with suspected ACS. Third, we noted a non-significant trend towards more invasive treatment following the introduction of hscTn-I assays, so further studies might show a significant increase. Fourth, we assumed that any changes in the studied parameters were only related to the introduction of hscTn-I assays, and not any concomitant external factors. The overall baseline characteristics of the patients in the pre-changeover and post-changeover periods do, however, match quite well; the only significant difference was in smoking history, which probably had a minimal effect on admission rates and time spent in the ED and no effect on the other studied parameters, which involved inpatient management and outcomes. During the study period, there were no other new cardiac tests introduced, and no major changes in hospital management or the size and number of operating units in the ED. The National Emergency Access Target (NEAT) initiative, which encourages shorter ED stay, was in place before the start of the study period. This initiative involved incremental targets for improving efficiency over the study period, so it is hard to know whether shorter ED stay in our study population was a result of hscTn-I assays or the NEAT initiative; or better still, whether use of hscTn-I assays helped in the NEAT initiative. Fifth, we evaluated one hscTn assay. We hypothesise that our findings can be generalised to other cardiac troponin assays that have similar sensitivity and precision. Finally, the impact of introducing hscTn-I assays encompasses the performance of the biomarker itself and the preparedness of clinicians in interpreting the results.

In conclusion, the introduction of hscTn-I assays was associated with shorter ED stays and an increase in coronary angiography rates but no increase in hospital admission rates, invasive treatment rates or inhospital mortality. These findings are reassuring and indicate that concerns about a flood of coronary admissions and interventions as a result of the higher-sensitivity assays are ill founded. Analysis of ongoing clinical experience with these assays is likely to lead to improvement in patient management through refinement of management algorithms.

1 Characteristics of patients who presented to the ED of Geelong Hospital with suspected ACS before and after changeover to hscTn-I assays (N = 12 360)


Before changeover (n = 8090)

After changeover (n = 4270)

95% CI for the difference

P


Males

4251 (52.5%)

2231 (52.2%)

− 2.2% to 1.5%

0.75

Age in years, median (IQR)

59 (27)

59 (26)

− 1.0 to 1.0

0.68

Hypertension

1088 (13.4%)

548 (12.8%)

− 1.8% to 0.6%

0.34

History of smoking

2223 (27.5%)

1002 (23.5%)

− 5.6% to − 2.4%

< 0.001

Previous IHD

1066 (13.2%)

525 (12.3%)

− 2.1% to 0.4%

0.16


ED = emergency department. ACS = acute coronary syndrome. hscTn-I = high-sensitivity cardiac troponin I. IQR = interquartile range. IHD = ischaemic heart disease.

2 Inhospital mortality due to ACS in patients admitted to Geelong Hospital after presenting to the ED with suspected ACS before and after changeover to hscTn-I assays*


Did not die from ACS in hospital

Died from ACS in hospital


Before changeover (n = 1897)

1852 (97.6%)

45 (2.4%)

After changeover (n = 944)

926 (98.1%)

18 (1.9%)


ACS = acute coronary syndrome. ED = emergency department. hscTn-I = high-sensitivity cardiac troponin I. * There was no statistically significant difference in inhospital mortality due to ACS between the pre- changeover and post-changeover periods (P = 0.43).

All that is irregular is not AF!

Clinical record

A 64-year-old man with no significant past medical history presented to a district hospital in June 2012 with a 3-week history of palpitations and breathlessness. The electrocardiogram (ECG) showed an irregularly irregular wide complex tachycardia at a rate of 150 beats/min with right bundle branch block-like morphology (Box 1). A transthoracic echocardiogram showed moderate segmental left ventricular dysfunction. Coronary angiography showed no evidence of significant coronary artery disease to account for his left ventricular impairment. A diagnosis of atrial fibrillation (AF) with a rapid ventricular response and tachycardia-mediated cardiomyopathy was made.

Therapy with diuretics and antiarrhythmic medications was commenced. Despite substantial doses of amiodarone (600 mg daily), metoprolol (200 mg daily), verapamil (240 mg daily) and digoxin (250 µg daily) over 2 weeks, his heart rate remained uncontrolled at between 100 and 200 beats/min. A transoesophageal echocardiogram-guided cardioversion was performed, but failed to restore normal rhythm. He was subsequently referred to our tertiary cardiac centre for further management.

The patient was haemodynamically stable on arrival. He had mild renal impairment (creatinine level, 114 µmol/L [reference interval (RI), 60–110 µmol/L]; estimated glomerular filtration rate, 56 mL/min/1.73 m2 [RI, > 90 mL/min/1.73 m2]), normal levels of troponin I (0.02 µg/L [RI, 0–0.08 µg/L]), creatine kinase (100 U/L [RI, 52–336 U/L]) and electrolytes (sodium, 139 mmol/L [RI, 135–145 mmol/L]; potassium, 4.2 mmol/L [RI, 3.5–5.0 mmol/L]), and normal findings on thyroid function tests. Although his ECG showed an irregularly irregular broad complex tachycardia suggestive of AF, closer inspection of the ECG showed P waves of probable sinus bradycardia with atrioventricular dissociation (Box 1, red arrows) indicative of ventricular tachycardia (VT). A repeat echocardiogram showed moderately impaired left ventricular function (ejection fraction, 35%–40% [RI, 55%–75%]) due to global hypokinesis. The patient had incessant VT throughout an electrophysiology study that was performed. Three-dimensional electro-anatomical mapping (Ensite NavX, St Jude Medical) identified a VT focus emanating from the base of the posteromedial papillary muscle of the left ventricle. Ablation at this focus terminated the VT with no further ectopic activity. His ECG after the ablation showed sinus rhythm (Box 2). He has remained well since discharge, taking only a low daily dose of bisoprolol (1.25 mg). Six months after the ablation, a 24-hour Holter monitor has not detected any recurrence of VT, and a repeat echocardiogram showed normalisation of left ventricular function.

The differential diagnoses of broad complex tachycardia include ventricular tachycardia (VT), supraventricular tachycardia with aberrancy and a ventricular paced rhythm. The diagnosis of broad complex tachycardia remains challenging despite various criteria having been established to differentiate VT from supraventricular tachycardia with aberrancy.1,2 The patient’s initial presenting electrocardiogram (ECG) was misdiagnosed as atrial fibrillation (AF) because of the irregularly irregular rhythm. In VT, the rhythm is usually regular or almost regular but beat-to-beat variations can occur in the presence of captured beats (when an atrial impulse causes depolarisation via the normal conduction system, resulting in a narrow QRS complex occurring earlier than expected) or fusion beats (when an appropriately timed sinus impulse fuses with the wide QRS complex from VT to produce a relatively narrowed QRS complex). In addition to an irregularly irregular rhythm, however, the diagnosis of AF requires the absence of P waves, and fibrillation of the baseline (f waves); neither feature was evident on the patient’s initial ECG.

The 12-lead ECG provides important clues in differentiating VT from supraventricular tachycardia. Atrioventricular (AV) dissociation with more ventricular impulses than atrial is one of the most useful criteria for distinguishing VT from supraventricular tachycardia.3 It occurs in 20%–50% of cases of VT and almost never in supraventricular tachycardia, with the rare exception of junctional ectopic tachycardia.4 Absence of AV dissociation does not exclude the diagnosis of VT. Importantly, beat-to-beat differences (especially of the ST segment and T waves) may raise the possibility of obscured independent P wave activity (red arrows in Box 1).

The absence of an RS complex in any precordial lead during a tachycardia with a wide QRS complex makes the diagnosis of a VT highly specific.5 If an RS complex is present in one or more precordial leads, the next step is to measure the longest RS interval. This is the intrinsic deflection, measured from the onset of the R wave to the deepest part of the S wave, and should be longer in VT (> 100 ms) than in supraventricular tachycardia, irrespective of the QRS morphology.5

In our patient, there was extreme axis deviation (“north-west” axis) during tachycardia with predominantly negative QRS complexes in leads I, II and III (Box 1). A frontal axis between − 90° to ±180° cannot be achieved by any combination of bundle branch block and therefore suggests VT.3 Also QRS duration greater than 160 ms (not applicable in this case) is strongly suggestive of VT.

VT and supraventricular tachycardia with bundle branch block may produce similar ECGs. If a previous ECG shows a bundle branch block pattern during sinus rhythm that is similar or identical to that during the tachycardia, the origin of the tachycardia is likely to be supraventricular.3 However, if the QRS morphology changes during tachycardia, VT is more likely.

In general, all broad complex tachycardias should be treated as if the rhythm was VT until proven otherwise. Delay or misdiagnosing VT with an inappropriate treatment can lead to fatal or almost fatal outcomes.6 Twelve-lead electrocardiography remains an important tool in the diagnosis of VT; if there is any doubt, an expert opinion should be obtained to prevent any delay in management.

Traditional understanding held that ventricular arrhythmias are a consequence of an underlying cardiomyopathy. However, more recent evidence shows that frequent premature ventricular beats or sustained VT can precipitate left ventricular impairment in otherwise normal hearts.7 Numerous ventricular foci for these arrhythmias have been reported.7 Although it is uncommon, papillary muscles can give rise to ventricular arrhythmias in normal hearts without previous infarcts.8,9 The mechanism of this VT is postulated to be either due to triggered activity (delayed after depolarisations) or abnormal automaticity (non-re-entrant), which might account for the irregularity of the VT.7,9 Importantly, ventricular dysfunction is reversible with appropriate treatment, and excellent clinical outcomes from radiofrequency catheter ablation for papillary muscle VT have been reported, as was the case in our patient.10

Lessons from practice

  • Broad complex tachycardias should be treated as ventricular tachycardia unless good evidence suggests a supraventricular origin.
  • A thorough evaluation of a 12-lead electrocardiogram is important for differentiating ventricular tachycardia from supraventricular tachycardia with aberrancy.
  • Not all patients with ventricular tachycardia will be in a state of collapse; some patients look well, but present with dizziness, palpitations, chest pain and/or heart failure.
  • In some cases, ventricular arrhythmias may represent a reversible cause (rather than a consequence) of left ventricular dysfunction.

1 Electrocardiogram taken on presentation at the district hospital showing the patient’s broad complex tachycardia with right bundle branch block morphology; red arrows indicate independent P wave activities

2 Electrocardiogram showing the patient’s sinus rhythm after ventricular ablation