Low plasma troponin concentrations identify two-thirds of patients at very low risk of cardiac events who could be discharged from hospital. Implementation of this approach could substantially reduce hospital admissions and have major benefits for both patients and health-care providers.
Preference: Cardiology and Cardiac Surgery
99
[Comment] Myocardial infarction: rapid ruling out in the emergency room
Patients with symptoms of possible acute coronary syndrome make up a large proportion of people who present to emergency departments, where they undergo lengthy, intensive, and costly assessments.1,2 Yet few are finally diagnosed with an acute coronary syndrome. Improvements in methods to exclude acute coronary syndrome are needed to reliably reassure and safely discharge low-risk patients who can then proceed to further investigations as outpatients. High-sensitivity cardiac troponin assays are reliable and have low thresholds of detection.
‘Everything presents at extremes…’ – a Solomon Islands experience
Pictgure: Dr Elizabeth Gallagher (second from left) with other staff and volunteers at the National Referral Hospital, Honiara
By Dr Elizabeth Gallagher, specialist obstetrician and gynaecologist, AMA ACT President
The mother lost consciousness just as her baby was born.
The woman was having her child by elective Caesarean when she suffered a massive amniotic fluid embolism and very quickly went into cardiac arrest.
We rapidly swung into resuscitation and, through CPR, defibrillation and large doses of adrenaline, we were able to restore her to unsupported sinus rhythm and spontaneous breathing.
But, with no equipment to support ventilation, treat disseminated intravascular coagulation, renal failure or any of the problems that arise from this catastrophic event, it was always going to be difficult, and she died two-and-a-half hours later.
Sadly, at the National Referral Hospital in Honiara, the capital of the Solomon Islands, this was not an uncommon outcome. Maternal deaths (both direct and indirect) average about one a month, and this was the second amniotic fluid embolism seen at the hospital since the start of the year.
I was in Solomon Islands as part of a team of four Australian practitioners – fellow obstetrician and gynaecologist Dr Tween Low, anaesthetist Dr Nicola Meares, and perioperative nurse and midwife Lesley Stewart – volunteering to help out at the hospital for a couple of weeks in October.
It was the first time I had worked in a developing country, and it was one of the most challenging, and yet satisfying, things I have ever done
Everything from the acuteness of the health problems to the basic facilities and shortages of equipment and medicines that we take for granted made working there a revelation.
The hospital delivers 5000 babies a year and can get very busy. As many as 48 babies can be born in a single 24-hour period.
The hospital has a first stage lounge and a single postnatal ward, but just one shower and toilet to serve more than 20 patients. The gynaecology ward is open plan and, because the hospital doesn’t provide a full meal service or much linen, relatives stay there round-the-clock to do the washing and provide meals.
From the beginning of our stay, it was very clear that providing training and education had to be a priority. I was conscious of the importance of being able to teach skills that were sustainable once we left.
The nature of the emergency gynaecological work, which includes referrals from the outer provinces, is that everything presents at the extremes…and late. Massive fibroids, huge ovarian cysts and, most tragically because there is no screening program, advanced cervical cancers in very young women.
When I first got in touch with doctors at the hospital to arrange my visit, I had visions of helping them run the labour ward and give permanent staff a much-needed break. But what they wanted, and needed, us to do was surgery and teaching.
To say they saved the difficult cases up for us is an understatement. I was challenged at every turn, and even when the surgery was not difficult, the co-morbidities and anaesthetic risks kept Dr Meares on her toes.
In my first two days, the hospital had booked two women – one aged 50 years, the other, 30 – to have radical hysterectomies for late stage one or early stage two cervical cancer. I was told that if I did not operate they would just be sent to palliation, so I did my best, having not seen one since I finished my training more than 12 years ago.
I also reviewed two other woman, a 29-year-old and a 35-year-old, both of whom had at least a clinical stage three cervical cancer and would be for palliation only. This consisted of sending them home and telling them to come back when the pain got too bad.
It really brought home how effective our screening program is in Australia, and how dangerous it would be if we got complacent about it.
We found the post-operative pain relief and care challenged. This was because staffing could be limited overnight and the nurses on duty did not ask the patients whether they felt pain – and the patients would definitely not say anything without being asked.
Doing our rounds in our first two days, we found that none of the post-operative patients had been given any pain relief, even a paracetamol, after leaving theatre.
We conducted some educational sessions with the nursing staff, mindful that the local team would need to continue to implement and use the skills and knowledge we had brought once we left. By the third day, we were pleased to see that our patients were being regularly observed and being offered pain relief – a legacy I hope will continue.
The supply of equipment and medicines was haphazard, and depended on what and when things were delivered. There was apparently a whole container of supplies waiting for weeks for clearance at the dock.
Many items we in Australia would discard after a single use, like surgical drains and suction, were being reused, and many of the disposables that were available were out-of-date – though they were still used without hesitation.
Some things seemed to be in oversupply, while others had simply run out.
The hospital itself needs replacing. Parts date back to World War Two. There were rats in the tea room, a cat in the theatre roof, and mosquitos in the theatre.
The hospital grounds are festooned with drying clothes, alongside discarded and broken equipment – including a load of plastic portacots, in perfect condition, but just not needed on the postnatal ward as the babies shared the bed with their mother.
It brought home how important it is to be careful in considering what equipment to donate.
The ultrasound machine and trolley we were able to donate, thanks to the John James Memorial Foundation Board, proved invaluable, as did the instruction by Dr Low in its use.
The most important question is, were we of help, and was our visit worthwhile?
I think the surgical skills we brought (such as vaginal hysterectomy), and those we were able to pass on, were extremely useful. Teaching local staff how to do a bedside ultrasound will hopefully be a long-lasting legacy. Simple things like being able to check for undiagnosed twins, dating, diagnosing intrauterine deaths, growth-restricted babies and preoperative assessments will be invaluable.
The experience was certainly outside our comfort zone, and it made me really appreciate what a great health system we have in Australia, and what high expectations we have. I want to send a big thank you to the John James Memorial Foundation for making it all possible.
Is ketamine ready to be used clinically for the treatment of depression?
A single dose of ketamine produces rapid antidepressant effects, but attaining lasting remission remains a challenge
Some clinics in Australia and overseas have begun offering a course of ketamine treatments to patients with depression. However, this practice is premature, given that the efficacy and safety of this treatment approach has yet to be tested in controlled trials. Further, whether such a treatment approach leads to lasting response — that is, clinically meaningful effects — is as yet unknown. Ketamine differs from current antidepressant medications in that it acts primarily on the glutamate signalling system, rather than on the monoaminergic (eg, serotonin, noradrenalin) system. To date, eight randomised, placebo-controlled trials involving almost 200 participants with depression have shown robust antidepressant effects after a single, subanaesthetic dose of ketamine.1,2 These impressive clinical results have generated intense interest among researchers, clinicians and patients.
First, the onset of effects is much more rapid for ketamine than for other antidepressant treatments, with peak effects seen 24 hours after receiving a single treatment, in contrast with the several weeks required for most other treatments. Second, ketamine has a very high efficacy, as demonstrated by high overall remission rates,1 efficacy even in patients who are highly treatment resistant,3 and one preliminary report of superior efficacy to electroconvulsive therapy, typically considered the most effective proven biological treatment for depression.4 These observations have driven public demand for ketamine to be immediately made available as a clinical treatment for depression.5
However, a major drawback of this otherwise impressive treatment is that antidepressant effects typically last for only several days after a single treatment.6 The occasional patient may attain a lasting remission after a single dose;7 but, as yet, there is no way of identifying which patients will gain lasting benefit from a single treatment. Several strategies have been trialled in attempts to prolong the antidepressant effects of ketamine, but none have resulted in lasting improvement. The main strategy has been to give repeated doses of ketamine. Preliminary trials suggest this may prolong the antidepressant effects from a few days to a few weeks.8 So far, the efficacy and safety of repeated dosing has not been tested in placebo-controlled trials.
Risks of acute treatment with ketamine include induction of psychotomimetic effects and elevation of blood pressure. These are transient, occurring mainly in the first hour after treatment. Ketamine has been given safely to patients in clinical trials, in which patients were first carefully assessed in terms of hypertension, cardiac function, hepatic function and psychiatric illness, and with careful monitoring and constant supervision in the immediate hours after treatment. Longer-term use is associated with different risks, and the safety of ketamine with repeated treatments is unclear. Data on chronic use come largely from recreational users; that is, the data are unsystematic and uncontrolled. What evidence there is suggests a risk of hepatic impairment, bladder dysfunction and, possibly, cognitive impairment. 9 Until there are clear data on these risks, repeated treatment doses should be given within a framework of systematic evaluation of these adverse effects. Another important consideration is the risk of inducing craving for further ketamine in patients treated with the drug. Although research participants evaluated 6 months after participation in strictly controlled treatment trials for depression have not shown increased craving for ketamine, there is a cautionary report of ketamine tolerance and addiction developing after its use to treat depression.10 In this report, increasing doses of ketamine were used in an attempt to obtain lasting antidepressant effects, resulting in considerable adverse effects and eventual requirement for detoxification from ketamine, with resultant lapse into severe depression.
Other considerations in the use of ketamine as a treatment for depression include the optimal route of administration and dosage. Most clinical trials to date have administered 0.5 mg/kg ketamine over a 40-minute intravenous infusion. Ketamine has also been given by simpler methods: orally or sublingually, by intramuscular or subcutaneous injection, and by intranasal spray, with some studies reporting similar results to studies using an intravenous route.7,11–13 It is also unclear whether 0.5 mg/kg, the dose selected for initial trials and used in most subsequent trials, is the optimal dose level. To date, there have been minimal investigations of the important pharmacodynamic considerations of treatment route and dosage, and how these may determine the magnitude and persistence of the antidepressant response.
Given the current evidence and risk of potential harm, it is not surprising that recent actions have been taken by health authorities in Australia to curtail medical practitioners offering a course of ketamine treatments to patients with depression.14 If ketamine is prematurely applied clinically to treat depression, before research has determined how (and if) it can be effectively and safely used to achieve lasting remission of depression, the end result may be disillusionment and even abandonment of this otherwise promising therapy.
[Comment] Cardiac catheterisation: radiation for radialists
Since the introduction of radial artery access for cardiac catheterisation in the early 1990s by Campeau and Kiemeneij,1,2 more than 20 years have passed before it has been acknowledged as the preferred technique for coronary angiograms and percutaneous coronary intervention (PCI). A published trial and subsequent meta-analysis of all randomised trials published since the RadIal Versus femorAL (RIVAL) study3 comparing radial artery with femoral artery access site in patients with acute coronary syndromes showed that the radial artery route resulted in a reduction in major bleeding and all-cause mortality.
[World Report] American cardiologist wins 2015 Prince Mahidol prize
Morton Mower, who developed two cardiac devices that have helped millions of people worldwide, has been honoured by the Prince Mahidol Award Foundation. Brian Owens reports.
[Articles] Fractional flow reserve versus angiography for guidance of PCI in patients with multivessel coronary artery disease (FAME): 5-year follow-up of a randomised controlled trial
The results confirm the long-term safety of FFR-guided PCI in patients with multivessel disease. A strategy of FFR-guided PCI resulted in a significant decrease of major adverse cardiac events for up to 2 years after the index procedure. From 2 years to 5 years, the risks for both groups developed similarly. This clinical outcome in the FFR-guided group was achieved with a lower number of stented arteries and less resource use. These results indicate that FFR guidance of multivessel PCI should be the standard of care in most patients.
General practitioners’ prescribing of lipid-lowering medications for Indigenous and non-Indigenous Australians, 2001–2013
Aboriginal and Torres Strait Islander Australians (Indigenous Australians) bear a disproportionate burden of disease in Australia and have a life expectancy 13 years shorter than that of other Australians.1,2 Heart disease is the leading cause of death among both Indigenous and non-Indigenous Australians, and it is also the single largest contributor to the gap in life expectancy between the two populations.3,4 The mortality rate associated with cardiovascular disease is 60% higher in Indigenous than in non-Indigenous populations; the prevalence of cardiovascular disease is 30% higher and that of its risk equivalent, diabetes, is three times greater among Indigenous Australians.3–6
Promoting access to prescription drugs and improving the management of chronic disease are key components of the national strategy for reducing health disparities in Australia. In 1999, the Australian Government eliminated out-of-pocket drug costs for Indigenous patients attending remote Aboriginal community-controlled health clinics.7 Two subsequent initiatives, in 2008 and 2010, reduced medication co-payments for Indigenous patients who attended non-remote Aboriginal community-controlled clinics or mainstream general practices.8,9 Further, the Pharmaceutical Benefits Scheme modified its criteria for subsidised lipid-lowering medications to include all Indigenous Australians with diabetes or a blood total cholesterol level above 6.5 mmol/L.10 The Indigenous Practice Incentives Program of the federal Department of Health provides bonus payments to general practitioners who enrol chronically ill Indigenous patients and prepare chronic disease management plans for them.11
Whether these efforts have translated into increased prescribing of cardiovascular medications to Indigenous Australians or better control of cardiovascular risk factors is unknown. We therefore evaluated trends in the prescribing of lipid-lowering medications for Indigenous and non-Indigenous Australians seen in general practice. We focused on therapies that reduce blood lipid levels because treating this modifiable risk factor can reduce coronary events and mortality in selected patients.12,13
Methods
Study design, source of data and population
We conducted an observational time trend study, from April 2001 to March 2013, that determined the proportion of patient encounters in which GPs prescribed lipid-lowering medications. We analysed data from the Bettering the Evaluation and Care of Health (BEACH) survey, which randomly samples 1000 GPs each year.14 The source population included all registered GPs and GP registrars who had claimed at least 375 Medicare service items in the past 3 months.
Each participating GP provided information about 100 consecutive patient encounters. The BEACH survey collects reasons for the encounter, problems addressed during the encounter, and clinical actions undertaken to manage each problem. GPs record up to four medications for each problem managed, and link each medication with a single managed problem. The final study sample encompassed 759 673 GP encounters with patients aged 30 years or over: 9594 with Indigenous and 750 079 with non-Indigenous patients.
Outcome measures
The primary outcome was the report that at least one lipid-lowering medication had been prescribed during an encounter. Lipid-lowering medications included five classes: statins, bile acid sequestrants, fibrates, niacin, and cholesterol absorption inhibitors. The primary independent variable was Indigenous status (dichotomous: yes v no), based on the GP’s record of the patient’s self-report during the encounter.
Statistical analyses
We calculated the unadjusted rate of prescribing lipid-lowering medications (ie, the proportion of encounters at which at least one such medication was prescribed) for Indigenous and for non-Indigenous patients. These data were further stratified by time period (1 April 2001 – 31 March 2005, 1 April 2005 – 31 March 2009, 1 April 2009 – 31 March 2013) and by the clinical condition that was addressed during an encounter (non-gestational diabetes mellitus, hypertension, ischaemic heart disease, lipid disorder). We also calculated the age–sex standardised rate of prescription of lipid-lowering medications for Indigenous patients, using 14 discrete age–sex subgroups (men and women in seven age groups spanning 10 years each). Age–sex standardisation yields an estimate of the lipid-lowering prescribing rate for encounters with Indigenous patients, assuming an age–sex structure identical to that of the non-Indigenous population.
A further subgroup analysis calculated the proportions of all lipid-lowering medications prescribed for each specified clinical condition. To assess whether there were statistically significant increases over time in the age–sex standardised rate of prescribing of lipid-lowering medications, we constructed logistic regression models, with the time period (the three 4-year time periods) as the independent variable.
All analyses were adjusted for clustering by GP using SAS 9.3 survey procedures (SAS Institute). Differences were considered statistically significant at P < 0.05. For routine analyses of BEACH data, we report a significant difference only if there was no overlap of the 95% confidence intervals of the two comparison groups. This is a stricter threshold than the usual P < 0.05 criterion, equivalent to P < 0.006, and reduces the risk of Type 1 errors when making multiple comparisons.
The University of Sydney Human Research Ethics Committee approved the study (reference 2012/130).
Results
Rate of prescription of lipid-lowering medications for Indigenous and non-Indigenous patient encounters
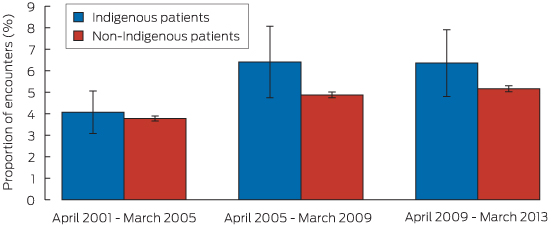
During the study period, lipid-lowering medications were prescribed during 4.9% (95% CI, 4.2%–5.6%) of encounters with Indigenous patients, and at 4.6% (95% CI, 4.5%–4.7%) of encounters with non-Indigenous patients. After age–sex standardisation (which adjusts the Indigenous but not the non-Indigenous rate), the rate of prescription during Indigenous patient encounters was 5.5% (95% CI, 4.7%–6.3%), significantly greater than that for non-Indigenous patient encounters.
For Indigenous patient encounters, the age–sex standardised rate of prescription of lipid-lowering medications increased from 4.1% during 2001–2005 to 6.4% during 2009–2013 (P = 0.013 for trend). For non-Indigenous encounters, the rate of prescription increased from 3.8% to 5.2% over the same period (P < 0.01) (Box 1). The point estimates for these proportions were higher for Indigenous patient encounters for each of the three time periods, but these individual differences were not statistically significant.
Specified clinical conditions addressed during Indigenous and non-Indigenous patient encounters
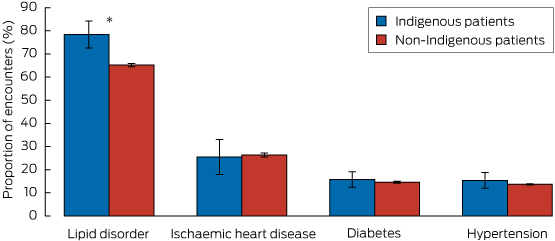
Diabetes and ischaemic heart disease were significantly more commonly managed at encounters with Indigenous patients than at those with non-Indigenous patients: in age-standardised analyses, diabetes was managed at 13.8% (95% CI, 12.6%–15.1%) of encounters with Indigenous patients and at 4.7% (95% CI, 4.6%–4.7%) of encounters with non-Indigenous patients. Ischaemic heart disease was managed at 3.2% (95% CI, 2.6%–3.8%) of encounters with Indigenous patients and at 1.7% (95% CI, 1.7%–1.8%) of those with non-Indigenous patients. Lipid disorders were managed significantly less frequently during Indigenous encounters (3.8%; 95% CI, 3.1%–4.5%) than during non-Indigenous encounters (4.6%; 95% CI, 4.5%–4.7%). There was no significant difference between the proportions of encounters at which hypertension was managed (12.6% for each group).
Rate of prescription of lipid-lowering medications, according to clinical condition
The proportion of Indigenous patient encounters involving diabetes, hypertension or ischaemic heart disease at which lipid-lowering medication was prescribed was similar to that for non-Indigenous patient encounters. However, for encounters at which GPs managed a lipid disorder, the age–sex standardised proportion at which lipid-lowering medication was prescribed was 78.4% (95% CI, 72.6%–84.2%) for Indigenous patient encounters, significantly greater than that for non-Indigenous patient encounters (65.2%; 95% CI, 64.5%–65.8%) (Box 2).
Proportion of lipid-lowering prescriptions linked with specific clinical conditions
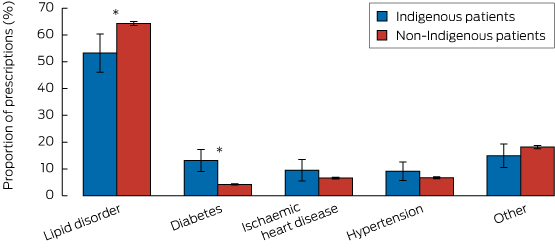
Box 3 depicts the proportions of all 35 798 prescriptions for lipid-lowering medication according to the specified clinical conditions managed, and stratified by Indigenous status. Only the proportions linked with diabetes (Indigenous: 13.1% [95% CI, 9.1%–17.3%] v non-Indigenous: 4.2% [CI, 4.0–4.5]) and lipid disorders (Indigenous: 53.3% [95% CI, 46.1%–60.4%], v non-Indigenous 64.3% [95% CI, 63.5%–65.1%]) were significantly different between the two groups.
Discussion
There were three major findings from this nationally representative study of the prescribing of lipid-lowering medications for Indigenous and non-Indigenous adults managed in Australian general practice. First, the rates of prescription of lipid-lowering medication by GPs for both Indigenous and non-Indigenous Australians increased substantially from 2001–2005 to 2009–2013, with relative increases of 37% for non-Indigenous and 56% for Indigenous patients. Second, lipid-lowering medication was more likely to be prescribed at encounters with Indigenous patients than at those with non-Indigenous patients, including encounters at which lipid disorders were managed. Third, diabetes was about three times as likely to be managed at encounters with Indigenous patients.
We found that the rates of prescription of lipid-lowering medication were higher for all Indigenous patient encounters, and for encounters at which a lipid disorder was managed; the prescription rates at encounters during which diabetes, heart disease or hypertension were managed were similar for Indigenous and non-Indigenous patients. These findings may reflect extensive efforts by the Australian Government, clinicians and other stakeholders to identify and reduce cardiovascular risk among Indigenous people, to increase their access to medications, and to revise clinical and benefit guidelines for lipid-lowering prescriptions so that they include all Indigenous patients with diabetes or blood total lipid levels greater than 6.5 mmol/L.7–11 Our study cannot establish a causal link between these policies and increased prescribing of lipid-lowering agents. However, it is reassuring that, as lipid-lowering therapies have continued to diffuse into clinical practice over the past 15 years, we found no evidence that GPs were less likely to prescribe these agents to Indigenous patients.
As noted by other authors, screening for and managing cardiovascular risk in Australian general practice is suboptimal.15,16 It is therefore also possible that the equivalent prescribing rates may reflect underuse of these medications in both Indigenous and non-Indigenous patients who might benefit from these therapies. Future studies should characterise disparities in the proportion of clinically appropriate treatment candidates who are prescribed effective cardiovascular medications.
Our study has some limitations. First, the BEACH data do not include information on whether patients filled or adhered to lipid-lowering prescriptions. Second, data concerning managed conditions, medications prescribed, and the patient’s self-identified ethnicity may include errors, although we have no reason to believe that rates of misclassification changed over time. Third, the sample in our study included only patients seen in primary care. Fourth, the sample sizes for some subgroup analyses were small. Fifth, the data were collected at the encounter level, precluding calculation of the overall prevalence of lipid-lowering therapy in Indigenous and non-Indigenous populations. Finally, we lacked laboratory values and comprehensive data on comorbid conditions to determine the clinical appropriateness of prescribing decisions or to adjust for casemix.
In conclusion, we detected substantial increases in the rate of prescribing of lipid-lowering medication at encounters with both Indigenous and non-Indigenous patients in Australian general practice between 2001 and 2013, and found no evidence that Indigenous patients were less likely to be prescribed these agents. Indigenous patients were more likely than non-Indigenous patients to be prescribed lipid-lowering therapy during encounters at which a lipid disorder was managed. Our findings suggest some measure of success in expanding access to medications and reducing cardiovascular risk in Indigenous populations. Further efforts are needed to promote long-term adherence to effective medications and to improve cardiovascular health for Indigenous people in Australia.
Box 1 –
Age–sex standardised proportions of patient encounters (with 95% CI) at which lipid-lowering medication was prescribed, by time period and Indigenous status
Can patients presenting with acute coronary syndrome be screened for diabetes using glycosylated haemoglobin?
The prevalence of diabetes in Australia is 7.4%.1 However, it is three times higher in patients admitted to hospital with acute coronary syndrome (ACS).2 It often remains undetected, and the prevalence of unrecognised diabetes in ACS populations is estimated to be 4%–22%.3 Diabetes is an independent predictor of increased mortality risk after myocardial infarction,4 so that early detection is of particular importance. In Australia, the incorporation of elevated glycosylated haemoglobin (HbA1c) levels (≥ 48 mmol/mol) into the diagnostic criteria for diabetes in 2012 has facilitated its diagnosis in hospital admissions for ACS.5 HbA1c levels are not affected by the acute stress of the ACS event, and their assessment does not require a fasting sample. We assessed the feasibility of routinely collecting HbA1c data as part of a prospective cohort study of consecutive ACS admissions to Monash Health, Victoria. We enrolled patients from 1 January 2013 to 30 June 2014 who were over 21 years of age and fluent in English. HbA1c was routinely assayed by high-performance liquid chromatography (Arkray Adams Glycohaemoglobin Analyzer HA-8160). The study participants were relatively young, and most were men (Box). Assessment of the prevalence of diabetes was based on self-reports or an HbA1c value of at least 48 mmol/mol. The overall prevalence of diabetes in the sample was 31% (128/414 patients), with a trend towards lower prevalence in those presenting with ST elevation myocardial infarction (STEMI). Of the 373 patients for whom HbA1c measurements were available, 102 (27%) had values of at least 48 mmol/mol at the time of presentation. Of the 128 patients classified as having diabetes, 12 cases (9%) had previously been unrecognised. Of the patients with diabetes for whom the relevant data were available, HbA1c was > 53 mmol/mol in 73 of 117 cases (62%), low-density-lipoprotein cholesterol ≥ 1.8 mmol/L (calculated using the Friedewald formula) in 48 of 75 cases (64%), high-density cholesterol ≤ 1.0 mmol/L in 64 of 84 cases (76%), and triglyceride levels ≥ 2 mmol/L in 41 of 109 cases (38%). Our data confirm a very high prevalence of diabetes in patients with ACS, most of whom had suboptimal diabetes and lipid management on admission. We confirm that it is practicable to measure HbA1c in consecutive ACS hospital admissions. HbA1c assessment will have supplementary value in the optimal management of ACS hospital admissions. Hyperglycaemia associated with the acute stress of the ACS event would, however, require measurement of fasting plasma glucose levels.
Box –
Selected baseline characteristics of the 414 participants with acute coronary syndrome
|
Characteristic |
Patients with diabetes |
Patients without diabetes |
|||||||||||||
|
|
|||||||||||||||
|
Number |
128 |
286 |
|||||||||||||
|
Age, years (median, IQR) |
60 (53–66) |
58 (49–66) |
|||||||||||||
|
Sex (male) |
101 (78.9%) |
226 (79.0%) |
|||||||||||||
|
Diagnosis* |
|
|
|||||||||||||
|
ST elevation myocardial infarction |
35 (27.3%) |
117 (40.9%) |
|||||||||||||
|
Non-ST elevation myocardial infarction |
44 (34.4%) |
93 (32.5%) |
|||||||||||||
|
Unstable angina |
48 (37.5%) |
72 (25.2%) |
|||||||||||||
|
HbA1c, mmol/mol (median, IQR) |
60.7 (50.8–76.0)n = 117 |
38.8 (36.6–41.0)†n = 256 |
|||||||||||||
|
Lipid levels, mmol/L (median, IQR) |
|
|
|||||||||||||
|
Total cholesterol (TL < 3.5 mmol/L) |
3.9 (3.3–5.2)n = 110 |
4.8 (3.8–5.6)†n = 256 |
|||||||||||||
|
Triglycerides (TL < 2.0 mmol/L) |
1.7 (1.2–2.6)n = 109 |
1.5 (1.0–2.2)‡n = 256 |
|||||||||||||
|
High-density-lipoprotein cholesterol (TL > 1.0 mmol/L) |
0.9 (0.8–1.0)n = 84 |
1.0 (0.9–1.2)†n = 213 |
|||||||||||||
|
Low-density-lipoprotein cholesterol (TL < 1.8 mmol/L) |
2.0 (1.6–3.0)n = 75 |
2.9 (2.1–3.8)†n = 205 |
|||||||||||||
|
|
|||||||||||||||
|
IQR = interquartile range. TL = target level. * Missing diagnosis data: one for the diabetes group, four for the non-diabetes group. Diabetes group v no diabetes group: † P < 0.001; ‡ P < 0.002. |
|||||||||||||||
Survival after an acute coronary syndrome: 18-month outcomes from the Australian and New Zealand SNAPSHOT ACS study
The prevalence, morbidity and early and late mortality associated with an acute coronary event all remain substantial in Australia and New Zealand.1 In Australia, ensuring equitable provision of acute cardiac care is a difficult task because of geographic challenges, shared federal and state jurisdictional responsibility for health care, and increasingly complex patient populations.2
Randomised trial data suggest that percutaneous reperfusion for ST elevation myocardial infarction (STEMI) and routine invasive strategies for revascularisation improve outcomes in patients with acute coronary syndromes (ACS), and this has led to public health initiatives that promote access to catheterisation laboratories.3 Patients presenting to hospitals with catheterisation laboratories are more likely to undergo these procedures than those who do not.4–6 The availability of angiography facilities may be associated with an improvement in mortality,7–9 although some studies have found no difference.5,10–12 It is not clear whether the lower mortality reported by some hospitals is related to access to angiography, better application of evidence-based care, or combinations of these factors.4,5,8
In October 2014, health ministers in Australia endorsed a National Clinical Care Standard for Acute Coronary Syndromes,13 and the Ministry of Health in New Zealand has developed a quality improvement plan that includes recommendations for ACS management.14 The lack of a comprehensive national surveillance system that is focused on collecting clinical data limits both the capacity to audit compliance with these initiatives and to determine whether adoption of their recommendations achieves improved outcomes for ACS patients. In this context, SNAPSHOT ACS has emerged as an important performance measure of acute cardiac care in the two countries, informed by two earlier audits undertaken in New Zealand in 2002 and 2007.15,16 Conducted over a 2-week period in May 2012,17 the comprehensive SNAPSHOT registry collected descriptive clinical data, audited processes of care, and outcomes for 4387 patients who presented with suspected ACS to the participating hospitals; more than 90% of the hospitals across Australia and New Zealand that treat ACS patients were audited.
In this article, we describe the delivery of evidence-based care13 to patients who initially presented to either a catheterisation-capable (CC) or a non-CC hospital setting. Using binational data linkage, we also report the 18-month mortality data for all patients and explore the relationship between variations in the delivery of evidence-based care and long-term mortality.
Methods
The SNAPSHOT ACS study was a prospective audit of the care provided to consecutive patients with suspected ACS who were admitted to hospital during a 2-week period in May 2012. Details of the study have been published elsewhere.17 In brief: 478 of 525 Australian and New Zealand hospitals that treat ACS patients either obtained ethics approval (in most cases allowing an opt-out consent process) or, in the case of New Zealand, a waiver for consent for the collection of ACS patient data. Some 286 hospitals (including all 39 New Zealand hospitals that treat ACS patients) received and enrolled consecutive patients during the audit period. Eligible hospitals that did not enrol patients were smaller centres that did not treat patients with suspected ACS during the audit window.
In addition, 438 hospitals completed a survey describing local resources, including cardiac investigation and management capabilities. For the 40 hospitals that did not participate in this site survey, publicly available information, such as the presence of a catheterisation laboratory at the time of the audit, was obtained from the hospital website or by contacting the hospital directly.
An electronic case report form was used to collect comprehensive historical and clinical data on patients, including provision of invasive management, medications, and in-hospital outcomes. Linkages with the National Death Index (NDI) in Australia and the National Mortality Register (NMR) in New Zealand were performed to obtain the vital status of all enrolled patients 18 months after admission. In Australia, probabilistic matching techniques used the name, date of birth, sex and address of the patient to link clinical data and date of death. In New Zealand, the unique patient identifier was used to link to the NMR.
Patients were stratified into two groups according to whether the hospital to which they presented had a catheterisation laboratory on site.
Statistical analyses
Standard descriptive statistics for demographic and clinical characteristic of the patients, pathology investigations, invasive procedures, guideline-recommended therapies provided to patients who survived to hospital discharge, and in-hospital events are presented. Dichotomous variables are reported as numbers and percentages, and were compared using χ2 tests. Continuous variables are reported as medians and interquartile ranges, and compared using Kruskal–Wallis tests.
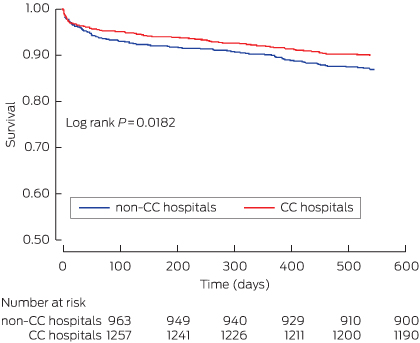
Kaplan–Meier survival curves are used to contrast ACS patients who presented to CC and non-CC hospitals, and were compared using log-rank tests.
A propensity score was calculated for all patients to model the likelihood of presenting to a CC hospital, and a Cox proportional hazards model, clustered by hospital, evaluated the impact on mortality of presenting to a CC hospital, after adjusting for Global Registry of Acute Coronary Events (GRACE) risk score,18 diagnosis, and propensity score. The comparison of presentation to CC and non-CC sites was then confined to the cohort of patients with overlapping propensity scores. Clinical factors included in the propensity score were: age, sex, GRACE score, elevated troponin levels, history of hypertension, diabetes, previous myocardial infarct, previous revascularisation, private health insurance, English as the primary home language, requiring assistance with activities of daily living, and being a nursing home resident.
In addition, a separate mortality model was developed for patients with an ACS (STEMI, non-ST elevation myocardial infarction [NSTEMI], unstable angina with probable ischaemic chest pain); this included the factors listed above, as well as two process measures derived from the indicators described in the Australian ACS Clinical Care Standard:13 timely delivery of reperfusion for STEMI, and coronary angiography for intermediate- or high-risk ACS.
A final propensity score-adjusted mortality model was constructed to predict postdischarge mortality, and included the previously discussed variables, together with delivery of dual antiplatelet and lipid-lowering treatment and referral to rehabilitation, measures also derived from the ACS Clinical Care Standard (Box 1).
To quantify the impact of health service improvement strategies, the attributable number of deaths hypothetically averted by application of each of the aspects of care included in the model described above was estimated using the formula:
attributable number = numberwithout Rx × (death incidencewithout Rx − death incidencewith Rx),
where Rx is the treatment factor of interest. The hazard rate (of death at 12 months) for those “with treatment” was estimated for patients who had arrived at the hospital in a timely manner and received all components of recommended care. The hazard rates for patients deficient in a specific care component were then calculated by applying the estimated hazard ratio associated with the omission of that care, derived from a Cox proportional hazards model confined to ACS patients that incorporated the primary diagnosis, the GRACE risk score, the on-site availability of catheterisation laboratory services, the propensity score for presentation to a CC facility, and the four processes of care (timely delivery of reperfusion for STEMI, coronary angiography for intermediate- and high-risk ACS, prescription of lipid-lowering and dual antiplatelet therapy, and referral to rehabilitation). Estimates of the proportions of patients for whom each component of care had been omitted were derived directly from the audit data. These estimates were then applied to a hypothetical population of 10 000 ACS patients with differing degrees of service improvement.
All analyses were conducted using Stata 13.1 (StataCorp); statistical significance was defined as P < 0.05.
Results
A total of 4387 patients with suspected ACS were enrolled, of whom 2459 (56%) presented to CC hospitals. The mean age, sex distribution and GRACE risk scores for the two patient groups were comparable. CC hospitals received a higher proportion of patients with private health insurance, a marker of socioeconomic status known to affect mortality (Box 2). This variable is included in the propensity score, so that our models are adjusted for this potentially confounding factor. In 2365 patients (53.9%), the ACS diagnosis was confirmed (Box 2).
Differences in care associated with availability of a catheterisation laboratory
The proportions of patients with STEMI who received reperfusion was less than optimal in both CC and non-CC hospitals (65.6% and 60.3%, respectively; P = 0.273). Timely reperfusion (door-to-balloon time under 90 minutes, or door-to-needle time under 30 minutes) was more likely for patients presenting to CC facilities (45.2% v 19.4%; P < 0.001) (Box 3).
ACS patients who presented to a CC hospital were more likely to undergo coronary angiography, which was offered earlier during their hospital stay. They were more likely to undergo revascularisation in hospital, and hospital survivors more likely to be referred to a rehabilitation service. There was no difference between the rates of prescribing evidence-based medications for hospital survivors discharged from CC or non-CC hospitals (Box 3).
Mortality in the 18 months after presenting with an ACS
The mortality in the overall SNAPSHOT cohort, from hospital presentation to 18-month follow-up, was 10.5% (460 deaths), and 12.6% (296 deaths) in patients with a confirmed ACS. Mortality was highest for patients with a myocardial infarction (STEMI: 68 deaths, 16.2%; NSTEMI: 165 deaths, 16.3%), followed by that for patients with a non-ACS diagnosis (107 deaths, 12.8%). Mortality was lowest for patients with unstable angina and non-ischaemic chest pain (63 deaths, 6.8%; and 57 deaths, 4.8%, respectively; P < 0.0001 for trend). Presentation to a CC hospital was associated with non-significantly reduced overall mortality for ACS patients (Box 4). Survival analysis indicated, however, that presentation to a CC hospital was associated with a significant reduction in mortality (P = 0.018), driven by separation in the mortality curves during the early postdischarge period (Box 5).
In a multivariable model that included adjustments for the propensity score for presenting to a CC hospital, GRACE risk score and patient diagnosis, presentation to a CC hospital was associated with significantly lower mortality (21%; 95% CI, 2%–37%) (Box 6).
Adding delivery of timely reperfusion for STEMI and coronary angiography for intermediate- and high-risk ACS patients to the model eliminated the independent association between presentation to a CC site and mortality. In this model, failure to provide appropriate coronary angiography was associated with a doubling of mortality (relative risk, 1.99; 95% CI, 1.42–2.79) (Box 7).
To quantify the effect on long-term outcomes of care initiated at discharge, an additional multivariable mortality model was developed for ACS patients who survived to hospital discharge. This model was confined to those in the CC and non-CC sites with overlapping propensity scores; this included 1870 patients, of whom 197 (10.5%) had died by the 18-month follow-up. Independent predictors of mortality in this population included GRACE risk score, presentation to a non-CC hospital, not receiving appropriate coronary angiography, and not being enrolled in a rehabilitation program (Box 7).
Modelling the impact of improving evidence-based care on annualised mortality
During the follow-up period, 296 of 2356 definite ACS patients had died, equivalent to an annualised mortality of 853 deaths (95% CI, 760–956) per 10 000 presentations. The estimated mortality rate at 12 months for patients in our dataset who had received all components of care was 185 deaths per 10 000 presentations. Box 8 includes estimates of the numbers of deaths within 12 months that could be averted by closing current treatment gaps for definite ACS patients, with various degrees of success, stratified by CC and non-CC facilities. If evidence-based care was improved to 50%, 70% or even 90% of optimal levels in ACS patients, we estimate that the numbers of lives saved annually in Australia and New Zealand per 10 000 ACS presentations would be 95, 133 and 171 patients, respectively. This corresponds to respective reductions in annualised mortality attributable to ACS of about 11%, 16% and 20%.
Discussion
In this comprehensive analysis of all patients with suspected ACS treated in most hospitals in Australia and New Zealand during a 2-week period in May 2012, overall mortality during the 18 months after presentation was 10.5%. The death rate was highest among patients with STEMI (16.2%) and NSTEMI (16.3%), reflecting both the substantial residual risk associated with these conditions and their comparable natural histories.20,21 The lower mortality observed in the unstable angina population contrasts with older data,22 but probably reflects the lower risk status of this population in the era of sensitive troponin assays.23
As most studies have found,4,5,10,24 ACS patients were more likely to have an angiogram if they presented to a CC hospital than to a non-CC hospital (61.5% v 50.8%). When compared with previous Australian and New Zealand reports, we have found that there has been a substantial improvement in the capacity to transfer patients from non-CC to CC hospitals in both countries over the past 10 years. The Heart Protection Project, which collected data from 27 Australian hospitals from 2003 to 2005,4 reported angiography rates of 66.4% and 20.1% for CC and non-CC hospitals respectively. Similarly, the first comprehensive New Zealand chest pain audit (2002) reported angiography rates of 30% in CC and 17% in non-CC hospitals.15 Despite the systematic improvement in access to coronary angiography we have reported, the long-term mortality for patients presenting to CC hospitals, after adjusting for their characteristics, was about 20% lower than for those who initially presented to non-CC hospitals. This finding conflicts with reports in the international literature that health systems that deliver high overall rates of coronary procedures (such as ours) are not associated with significant differences in long-term mortality,10,11 in contrast to health care systems in which invasive coronary procedure rates in non-CC sites are low (under 40%).7,9
Recent studies have highlighted the fact that attributing better outcomes in CC hospitals to invasive investigation alone may be simplistic, and suggest that a range of further structural and procedural features of hospital performance contribute to outcomes.5,8 Our study recognised this, and is the first to specifically examine the predictive value of performance indicators that have since become nationally endorsed as supplementing the ACS Clinical Care Standard in Australia.13 Interestingly, we found that one indicator described in the standard, the prescription of antiplatelet and lipid-lowering therapy, was not predictive of improved outcomes. This illustrates the obligatorily iterative nature of quality improvement initiatives, and underscores the value of clinical registries in informing these endeavours.25
SNAPSHOT ACS suffers from the potential limitations of all cross-sectional cohort studies in that, despite comprehensive risk adjustment, some of the benefits we attribute to evidence-based care may have been influenced by unmeasured confounding factors. In addition, data collection relied primarily on clinical staff in individual hospitals, in most cases after a single training session; monitoring of data quality was limited, and there was no independent adjudication of reported in-hospital clinical events. Finally, we had no information on the contribution of posthospital management to long-term mortality.
Our analysis nevertheless permits informed recommendations for guiding the setting of priorities for strategies for achieving lower long-term mortality in patients with ACS. Rates of angiography at CC hospitals, transfer rates from non-CC hospitals and access to rehabilitation in all hospitals should be further improved, and this will be facilitated by binational initiatives in health redesign, quality improvement and increased diffusion of evidence.2 One such initiative is ambulance diversion to percutaneous coronary intervention-capable hospitals after electrocardiography has been performed; this reduces reperfusion times and improves outcomes.26 We did not collect information on ambulance diversion rates in SNAPSHOT ACS, so can only speculate about the effect of diversion on non-CC performance. However, while providing timely reperfusion for STEMI patients is important, the relatively small proportion of STEMI presentations (18% of the ACS cohort) means that the greatest impact on mortality is achieved by improving care for the broader ACS population. If providing appropriate coronary angiography and rehabilitation to patients presenting with a definite ACS can each be improved to 50%, 70%, or, optimistically, 90% of ideal levels, we can anticipate reductions in the annualised mortality attributable to ACS across Australia and New Zealand of about 11%, 16% and 20%.
Box 1 –
Performance measures and the Australian Acute Coronary Syndromes (ACS) Clinical Care Standard13
|
Performance measure |
Relevant ACS clinical care standard |
||||||||||||||
|
|
|||||||||||||||
|
|
3. A patient with an acute ST-segment-elevation myocardial infarction (STEMI), for whom emergency reperfusion is clinically appropriate, is offered timely percutaneous coronary intervention (PCI) or fibrinolysis in accordance with the time frames recommended in the current National Heart Foundation of Australia/Cardiac Society of Australia and New Zealand Guidelines for the management of acute coronary syndromes.19 |
||||||||||||||
|
|
5. The role of coronary angiography, with a view to timely and appropriate coronary revascularisation, is discussed with a patient with a non-ST-segment-elevation acute coronary syndrome (NSTEACS) who is assessed to be at intermediate or high risk of an adverse cardiac event. |
||||||||||||||
|
|
6. Before a patient with an acute coronary syndrome leaves the hospital, they are involved in the development of an individualised care plan. This plan identifies the lifestyle modifications and medicines needed to manage their risk factors, addresses their psychosocial needs and includes a referral to an appropriate cardiac rehabilitation or another secondary prevention program. |
||||||||||||||
|
|
|||||||||||||||
Box 2 –
Patient demographics and clinical characteristics
|
|
Catheterisation-capable hospitals |
Not catheterisation-capable hospitals |
P |
||||||||||||
|
|
|||||||||||||||
|
Number of patients |
2459 |
1928 |
|
||||||||||||
|
Sex (male) |
1473 (59.9%) |
1147 (59.5%) |
0.78 |
||||||||||||
|
Age, years (mean ± SD) |
66.7 ± 14.5 |
66.4 ± 14.7 |
0.54 |
||||||||||||
|
Diagnosis |
|
|
|
||||||||||||
|
STEMI |
235 (9.6%) |
184 (9.5%) |
0.96 |
||||||||||||
|
STEMI, presenting to hospital within 12 hours of initial symptoms∗ |
193 (83.9% of STEMI patients) |
148 (84.1% of STEMI patients) |
0.96 |
||||||||||||
|
NSTEMI |
567 (23.1%) |
445 (23.1%) |
|
||||||||||||
|
Unstable angina/chest pain |
521 (21.2%) |
404 (21.0%) |
|||||||||||||
|
Non-cardiac chest pain |
676 (27.5%) |
518 (26.9%) |
|||||||||||||
|
Other |
460 (18.7%) |
377 (19.6%) |
|||||||||||||
|
Killip class |
|
|
|
||||||||||||
|
I |
2114 (86.0%) |
1674 (86.8%) |
|
||||||||||||
|
II |
278 (11.3%) |
203 (10.5%) |
|
||||||||||||
|
III |
46 (1.9%) |
36 (1.9%) |
|
||||||||||||
|
IV |
21 (0.85%) |
15 (0.78%) |
0.86 |
||||||||||||
|
Creatinine, μM (mean ± SD) |
98.6 ± 73.4 |
99.5 ± 89.0 |
0.36 |
||||||||||||
|
Glomerular filtration rate, mL/min/1.73 m2 (mean ± SD) |
76.9 ± 43.8 |
77.6 ± 33.3 |
0.39 |
||||||||||||
|
Chronic kidney disease |
292 (11.9%) |
210 (10.9%) |
0.31 |
||||||||||||
|
Diabetes |
627 (25.5%) |
486 (25.2%) |
0.83 |
||||||||||||
|
Hypertension |
1555 (63.2%) |
1222 (63.4%) |
0.92 |
||||||||||||
|
Hyperlipidaemia |
1377 (56.0%) |
1006 (52.2%) |
0.01 |
||||||||||||
|
Smoking |
|
|
|
||||||||||||
|
Current |
417 (16.9%) |
382 (19.8%) |
|
||||||||||||
|
Past |
915 (37.2%) |
714 (37.0%) |
|
||||||||||||
|
Never |
1127 (45.8%) |
832 (43.2%) |
0.04 |
||||||||||||
|
Previous myocardial infarction |
683 (27.8%) |
508 (26.4%) |
0.29 |
||||||||||||
|
Previous percutaneous coronary intervention |
499 (20.3%) |
390 (20.2%) |
0.96 |
||||||||||||
|
Previous coronary artery bypass grafting |
280 (11.4%) |
186 (9.7%) |
0.06 |
||||||||||||
|
Atrial fibrillation |
333 (13.5%) |
331 (17.2%) |
0.001 |
||||||||||||
|
Peripheral arterial disease |
144 (5.9%) |
123 (6.4%) |
0.47 |
||||||||||||
|
Previous transient ischaemic attack or stroke |
248 (10.1%) |
205 (10.6%) |
0.55 |
||||||||||||
|
Major bleeding |
65 (2.6%) |
42 (2.2%) |
0.32 |
||||||||||||
|
Cancer |
57 (2.3%) |
49 (2.5%) |
0.63 |
||||||||||||
|
Lung disease |
302 (12.3%) |
271 (14.1%) |
0.08 |
||||||||||||
|
Dementia |
84 (3.4%) |
64 (3.3%) |
0.86 |
||||||||||||
|
Impaired mobility |
131 (5.3%) |
114 (5.9%) |
0.40 |
||||||||||||
|
Nursing home |
60 (2.4%) |
56 (2.9%) |
0.34 |
||||||||||||
|
Private insurance |
657 (26.7%) |
437 (22.7%) |
0.002 |
||||||||||||
|
GRACE risk score (median, IQR) |
1473 (59.9%) |
1147 (59.5%) |
0.78 |
||||||||||||
|
|
|||||||||||||||
|
STEMI = ST elevation myocardial infarction; NSTEMI = non-ST elevation myocardial infarction; GRACE = Global Registry of Acute Coronary Events; IQR = interquartile range. ∗Time to presentation was not known for 13 STEMI patients (five presenting to catheterisation-capable hospitals, eight to not catheterisation-capable hospitals). |
|||||||||||||||
Box 3 –
Hospital performance: treatments received by patients admitted with acute coronary syndromes (ACS)
|
|
Catheterisation-capable hospitals |
Not catheterisation-capable hospitals |
P |
||||||||||||
|
|
|||||||||||||||
|
Performance measures for STEMI |
|||||||||||||||
|
Total number of patients |
235 |
184 |
|
||||||||||||
|
Offered reperfusion |
134 (65.6%) |
111 (60.3%) |
0.273 |
||||||||||||
|
Door-to-balloon time for primary percutaneous coronary intervention, min (median, IQR) |
70 (48–92)[n = 125] |
143 (115–194)[n = 33] |
0.0001 |
||||||||||||
|
Door-to-needle time for thrombolysis, min (median, IQR) |
35 (7–61)[n = 24] |
39 (20–68)[n = 73] |
0.640 |
||||||||||||
|
Timely reperfusion∗ |
106 (45.2%) |
35 (19.2%) |
< 0.001 |
||||||||||||
|
Performance measures for all ACS |
|||||||||||||||
|
Total number of patients |
1326 |
1031 |
|
||||||||||||
|
Coronary angiography (ACS patients) |
816 (61.5%) |
523 (50.8%) |
0.0001 |
||||||||||||
|
Angiography < 48 h |
539 (40.7%) |
253 (24.5%) |
< 0.001 |
||||||||||||
|
Percutaneous coronary intervention (ACS patients) |
442 (33.3%) |
301 (29.3%) |
0.04 |
||||||||||||
|
Coronary artery bypass grafting (ACS patients) |
93 (7.0%) |
64 (6.2%) |
0.42 |
||||||||||||
|
ACS patients prescribed four or more evidence-based therapies† |
702 (52.8%) |
514 (50.0%) |
0.165 |
||||||||||||
|
Dual antiplatelet and lipid-lowering therapy |
725 (54.7%) |
532 (51.6%) |
0.131 |
||||||||||||
|
Referred for cardiac rehabilitation |
756 (57.0%) |
546 (53.0%) |
0.05 |
||||||||||||
|
|
|||||||||||||||
|
STEMI = ST elevation myocardial infarction; IQR: interquartile range. ∗Defined as door-to-balloon time of less than 90 minutes for primary percutaneous coronary intervention or door-to-needle time of less than 30 minutes for fibrinolysis. †Includes dual antiplatelet and lipid-lowering therapies, angiotensin-converting enzyme inhibitor or angiotensin receptor antagonist, and beta blockers. |
|||||||||||||||
Box 4 –
Unadjusted mortality, from admission to 18 months after admission, for all patients and for acute coronary syndrome (ACS) patients, according to whether admitting hospital was catheterisation-capable
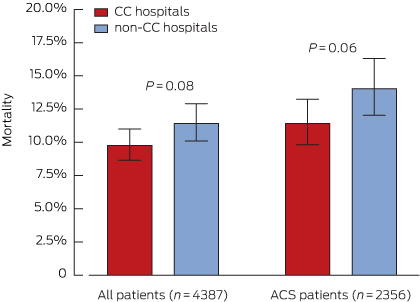
CC = catheterisation-capable.
Box 5 –
Unadjusted Kaplan–Meier survival curves for acute coronary syndrome patients presenting to catheterisation-capable or non-capable hospitals
CC = catheterisation-capable.
Box 6 –
Predictors of mortality, for all acute coronary syndrome patients
|
Variable |
Risk ratio (95% CI) |
P |
|||||||||||||
|
|
|||||||||||||||
|
Catheterisation hospital (reference: non-catheterisation-capable hospital) |
0.79 (0.63–0.98) |
0.030 |
|||||||||||||
|
GRACE risk score, per point |
1.04 (1.03–1.04) |
< 0.0001 |
|||||||||||||
|
Diagnosis (reference: STEMI) |
|
|
|||||||||||||
|
NSTEMI |
0.97 (0.70–1.36) |
0.89 |
|||||||||||||
|
Unstable angina |
0.93 (0.63–1.37) |
0.73 |
|||||||||||||
|
Chest pain, unlikely ischaemic |
0.84 (0.55–1.30) |
0.45 |
|||||||||||||
|
Other |
1.02 (0.71–1.46) |
0.91 |
|||||||||||||
|
Propensity score |
0.13 (0.01–2.15) |
0.08 |
|||||||||||||
|
|
|||||||||||||||
|
GRACE = Global Registry of Acute Coronary Events; STEMI = ST elevation myocardial infarction; NSTEMI = non-ST elevation myocardial infarction. |
|||||||||||||||
Box 7 –
Predictors of mortality for acute coronary syndrome (ACS) patients, after adjustment for receiving evidence-based care
|
Variable |
All ACS patients (n = 1923) |
ACS survivors to discharge (n = 1870) |
|||||||||||||
|
Relative risk (95% CI) |
P |
Relative risk (95% CI) |
P |
||||||||||||
|
|
|||||||||||||||
|
Catheterisation hospital (reference: non-catheterisation-capable hospital) |
0.78 (0.59–1.02) |
0.068 |
0.73 (0.54–0.99) |
0.043 |
|||||||||||
|
GRACE risk score, per point |
1.03 (1.03–04) |
< 0.0001 |
1.03 (1.03–1.04) |
< 0.0001 |
|||||||||||
|
Diagnosis (reference: STEMI) |
|
|
|
|
|||||||||||
|
NSTEMI |
1.64 (0.68–3.96) |
0.27 |
2.46 (0.75–8.14) |
0.14 |
|||||||||||
|
Unstable angina |
1.21 (0.47–3.14) |
0.70 |
2.0 (0.56–7.11) |
0.29 |
|||||||||||
|
Measures of appropriate care |
|
|
|
|
|||||||||||
|
Failure to receive timely reperfusion (STEMI) |
2.32 (0.94–5.69) |
0.066 |
2.56 (0.75–8.74) |
0.133 |
|||||||||||
|
Failure to undergo coronary angiography (GRACE risk score > 118) |
1.99 (1.42–2.79) |
< 0.001 |
1.67 (1.14–2.43) |
0.008 |
|||||||||||
|
Failure to discharge on statin and dual antiplatelet therapy |
|
|
1.21 (0.86–1.72) |
0.28 |
|||||||||||
|
Failure to refer to rehabilitation |
|
|
1.51 (1.07–2.11) |
0.018 |
|||||||||||
|
Propensity score |
0.57 (0.04–8.44) |
0.68 |
0.73 (0.04–12.08) |
0.824 |
|||||||||||
|
|
|||||||||||||||
|
GRACE = Global Registry of Acute Coronary Events; STEMI = ST elevation myocardial infarction; NSTEMI = non-ST elevation myocardial infarction. |
|||||||||||||||
Box 8 –
Estimated number deaths per 10 000 acute coronary syndrome (ACS) presentations (with 95% CI) that could be averted in 12 months by service improvements that provide more complete application of guideline-based therapies and interventions
|
Improvement in providing care component: |
Catheterisation-capable hospitals (receive 56% of ACS patients) |
Not catheterisation-capable hospitals (receive 44% of ACS patients) |
|||||||||||||
|
50% |
70% |
90% |
50% |
70% |
90% |
||||||||||
|
|
|||||||||||||||
|
Provide reperfusion within recommended timeframe (STEMI) |
6.6 (1.2–12.0) |
9.3 (1.8–16.8) |
11.9 (2.3–21.5) |
11.6 (−0.4 to 19.8) |
16.3 (−0.5 to 27.6) |
21.0 (−0.7 to 35.5) |
|||||||||
|
Provide angiography to intermediate- and high-risk patients (GRACE risk score > 118) |
26.6 (17.5–35.8) |
37.3 (24.5–50.1) |
47.9 (31.5–64.4) |
36.8 (10.0–50.1) |
51.5 (14.0–70.1) |
66.3 (18.0–90.2) |
|||||||||
|
Discharge patients on statin and dual antiplatelet therapy |
2.3 (0–4.7) |
3.3 (0–6.6) |
4.3 (0–8.5) |
6.2 (−1.7 to 10.5) |
9.3 (−2.5 to 14.7) |
11.9 (−3.2 to 18.9) |
|||||||||
|
Referral to rehabilitation |
11.3 (5.5–17.2) |
15.8 (7.6–24.0) |
20.3 (9.8–30.8) |
20.3 (0.2–29.8) |
28.5 (0.3–41.7) |
36.6 (0.4–53.6) |
|||||||||
|
|
|||||||||||||||
|
STEMI = ST elevation myocardial infarction; GRACE = Global Registry of Acute Coronary Events. |
|||||||||||||||