Today’s Lancet brings together a collection of cardiology research and commentary ahead of the American College of Cardiology (ACC) Annual Meeting, Chicago, IL, USA (April 2–4). The theme of this year’s meeting is ignite innovation, as the ACC invites delegates to think in new and disruptive ways, in the context of current rapid technological change.
Preference: Cardiology and Cardiac Surgery
99
[Comment] Cardiac gene therapy: a call for basic methods development
In 1995, when I entered the specialty of cardiac gene therapy, the principal limitation was the inability to reliably transfer genes to the cardiac ventricles. Soon after that time, a series of angiogenesis gene therapy clinical trials did not show efficacy in randomised testing.1,2 Investigation of the delivery methods used in those studies verified that insufficient gene transfer was a significant factor.3 In 2016, with the publication of Barry Greenberg and colleagues’ study,4 CUPID 2, we see that a principal limitation to cardiac gene therapy continues to be the inability to reliably transfer genes to the cardiac ventricles.
A warning against heart disease complacency in 2016
Although death from heart disease in Australia continues to decrease, we cannot rest on our laurels. The greatest barrier to reducing the social and economic toll of heart disease has been complacency. As a nation, we have dropped the ball. It’s time to think again.
Heart disease continues to result in more Australian deaths than any other single cause, and remains the leading cause of death for Aboriginal and Torres Strait Islander peoples. It continues to place a heavy burden on our already stretched health system, demanding the highest expenditure for any individual disease group at $7.7 billion in 2008–09 (http://www.aihw.gov.au/australias-health/2014/health-system).
Most Australians are either sedentary or engage in low levels of physical activity. Obesity among adults has almost tripled in the last two decades (http://www.aihw.gov.au/WorkArea/DownloadAsset.aspx?id=6442459497). Our ageing community, and the success in treating previously fatal heart conditions, means more people are living with heart diseases.
The devastating impact of inaction will see the number of adults with obesity double to 41% by 2031–32, and cardiovascular disease and type 2 diabetes are estimated to cost the government $58 billion if recent trends continue (http://heartfoundation.org.au/about-us/what-we-do/heart-disease-in-australia/australian-heart-disease-statistics).
The Heart Foundation has driven great change, but we can only do so much alone. The government has ignored the facts for too long and heart disease remains a national priority in name only. We now need a nationally funded action plan to improve prevention, treatment and research. Investment will pay big dividends and has the potential to save countless lives, improve national productivity and ease the pressure on hospitals.
Our strategy will continue to target inequalities, develop a heart attack survivor initiative, and tackle the causes of heart disease through funding innovative research. However, we need to see strong government, industry and community leadership resulting in lasting change that can help all Australians lead long, healthy lives.
[Seminar] Infective endocarditis
Infective endocarditis occurs worldwide, and is defined by infection of a native or prosthetic heart valve, the endocardial surface, or an indwelling cardiac device. The causes and epidemiology of the disease have evolved in recent decades with a doubling of the average patient age and an increased prevalence in patients with indwelling cardiac devices. The microbiology of the disease has also changed, and staphylococci, most often associated with health-care contact and invasive procedures, have overtaken streptococci as the most common cause of the disease.
Acute heart failure admissions in New South Wales and the Australian Capital Territory: the NSW HF Snapshot Study
Heart failure (HF) is a major burden on the health care system, and much of this burden is associated with the high rates of admission to hospital for managing episodes of acute decompensation. Based on the expected rise in the number of patients with HF as the population ages, it is likely that the use of hospital resources will continue to increase.1 Detailed data on hospital admissions for HF are therefore of considerable interest, including measures of morbidity, case load and costs related to HF.
Despite the importance of national data for quantifying HF and understanding its management and outcomes, such data are not currently available. Lack of funding, difficulties with case definition, and cross-jurisdictional problems have contributed to this failure.2 To facilitate a national approach to understanding HF and improving outcomes, the New South Wales HF Snapshot therefore sought to provide detailed representative data on hospital admissions for acute HF.
Methods
The NSW HF Snapshot was a prospective audit of consecutive patients who presented with acute HF and were admitted to 24 public hospitals (13 metropolitan and 11 rural) in NSW and the Australian Capital Territory during a one-month period. Each hospital had an attending cardiologist who was responsible for confirming the admission diagnosis. The snapshot methodology was based on a similar audit of patients with acute coronary syndrome.3
Data were collected from patient interviews, case note reviews and electronic database review. A two-page paper-based case report form with a standardised completion note captured key demographic and clinical data for each patient. To standardise case and data definitions, two face-to-face meetings with representatives from all participating hospitals were held before conducting the snapshot study.
The snapshot investigation was approved by the St Vincent’s Hospital Human Research Ethics Committee (reference number, LNR/13/SVH/84). All 24 hospitals who participated had received institutional governance approval. An opt-out consent approach was adopted to maximise the likelihood of capturing all patients admitted to the participating hospitals. The ethics approval for the investigation did not include the capture of data from non-participating hospitals, so the admission and discharge data for patients who had been transferred from or discharged to a non-participating hospital were based on the first and last available results at the participating hospital.
Patient eligibility
Patients were eligible to participate in the study if they were admitted to a participating hospital between 9 am on 8 July 2013 and 9 am on 8 August 2013, and had presented with first onset HF or acute decompensation of chronic HF. The admission diagnosis was based on clinical symptoms, signs and investigations consistent with acute HF, as determined by the site investigator.4
Measures
Patient data collected included demographic characteristics, medical history, clinical findings at presentation, clinical management (including pathology and cardiac investigations), acute treatment, admission and discharge medications, length of stay, and outcome of hospitalisation (including in-hospital mortality and clinical status at discharge). Classification as HF with reduced ejection fraction (HFREF) or HF with preserved ejection fraction (HFPEF) was based on the most recent assessment of left ventricular ejection fraction (LVEF), with an LVEF of at least 50% the criterion for HFPEF. Information on specific comorbidities was collected, as were data for the updated Charlson Comorbidity Index.5 Frailty was measured with the Survey of Health, Ageing and Retirement in Europe Frailty Index.6 In addition to patient-level data, all hospitals were asked to complete a survey describing their model of care, clinical service availability, and workforce characteristics. Hospitalisation and mortality outcomes were collected 30 days and 12 months after discharge by telephone follow-up and hospital electronic database review; these data will be reported in a separate article.
Statistical analyses
Dichotomous variables are reported as numbers and percentages, and were compared using either χ2 tests or Fisher exact tests. Continuous variables are reported as means and standard deviations or as medians and interquartile ranges. Between-group analyses (HFPEF v HFREF) tested differences in demographic and clinical characteristics. As the evidence base for pharmacotherapy in HFREF is derived primarily from trials in patients with an LVEF < 40%, we compared the rate of pharmacotherapy in patients with an LVEF ≥ 40% or < 40%. Patients for whom LVEF was not reported were excluded from the between-group comparisons. Further analyses compared de novo HF and decompensated HF patients.
Results
Baseline demographic factors
In total, 811 patients were recruited. The average number recruited per site was 34 (range, 4–81; Box 1). Their mean age was 77 ± 13 years; most were men (58%) and born in Australia (59%). The majority (68%) had experienced HF prior to their admission during the study period. Most patients presented with comorbidities, including ischaemic heart disease (56%), renal disease (55%) and diabetes (38%). The median Charlson Comorbidity Index score was 3. The most frequently attributed HF aetiologies were ischaemic heart disease (43%) and hypertension (25%).
Fifty-eight per cent of the patients presented with HFREF, 42% with HFPEF. Patients who presented with HFPEF were on average older, and were more likely than those with HFREF to be female and have hypertension as the antecedent cause for HF (each P < 0.001). The Charlson Comorbidity Index scores were similar in the two groups, but the distribution of comorbidities was different; there were higher rates of pulmonary disease in the HFPEF patients (P = 0.015) and of ischaemic heart disease in HFREF patients (P < 0.001). Seventy patients (9%) had an implantable cardioverter-defibrillator (including 61 patients with HFREF), and 133 (17%) had permanent pacemakers (Box 2).
The most frequently identified precipitants of admission were infection (22%) and non-adherence to medication (5%) or to dietary or fluid restrictions (16%). The first recorded rhythms on admission were sinus rhythm (42%) and atrial fibrillation/flutter (42%). Patients with HFPEF were significantly more likely to be in atrial fibrillation than those with HFREF (48% v 36%; P = 0.047). The mean first recorded blood pressure was 136 ± 33/77 ± 36 mmHg. Those with HFPEF had a significantly higher systolic blood pressure at admission (P < 0.001).
Admission pathway
Most patients (93%) were admitted after an emergency department presentation. The breakdown according to admitting specialties is shown in Box 3. Eight per cent of patients were admitted to a dedicated HF service, 62% to a general cardiology unit, 16% to a general medical unit, and 8% to a geriatric service. Patients with HFREF were more likely to be admitted to a cardiology service, whereas HFPEF patients were more likely to be admitted to a general medical unit.
Treatment received during admission
Box 4 summarises the treatments received by patients during their hospital stay. The most common therapies were oxygen therapy (87%) and intravenous diuretics (81%). Intravenous inotropic agents and glyceryl trinitrate were administered to 8% and 7% of patients respectively. Non-invasive ventilation was used for 17% of patients. Apart from oxygen therapy (89% v 83%; P = 0.013) and inotropic infusions (10% v 6%; P = 0.032), there were no statistically significant differences in the treatment received by patients with HFREF and HFPEF.
Pharmacotherapy
Box 5 shows the proportion of patients receiving cardiovascular pharmacotherapy at admission and discharge for those with an LVEF ≥ 40% or < 40%. With the exception of loop diuretics (64% at admission v 88% on discharge; P < 0.001), there was little or no change in medication use between admission and discharge for those with an LVEF ≥ 40%. There was increased prescription of loop diuretics (69% at admission v 88% on discharge; P < 0.001) and mineralocorticoid antagonists (26% v 45%; P = 0.010) for patients with an LVEF under 40%, and also a non-significant increase in the use of β-blockers (60% v 78%; P = 0.065).
For patients presenting with de novo HF and an LVEF < 40%, there was increased prescription of angiotensin-converting enzyme inhibitors (ACEIs)/angiotensin receptor blockers (ARBs) (42% at admission v 66% on discharge; P = 0.002). However, the prescription of ACEIs/ARBs for those with decompensated HF declined from 58% to 47% (P = 0.010).
For patients with de novo HF, the frequency of combination therapy (ACEIs/ARBs with β-blockers: 24% to 60%) and triple therapy (ACEIs/ARBs, β-blocker and mineralocorticoid antagonist: 4% to 19%) increased between admission and discharge. In patients with decompensated HF, there was no change in the frequency of either double (43% v 45%) or triple therapy (16% v 21%). The total daily diuretic dose (frusemide equivalent) at discharge was 75 ± 72 mg. At discharge, patients were taking an average of 10 ± 4 agents a day, requiring them to swallow 13 ± 7 pills each day.
Pre-discharge clinical status and discharge outcome
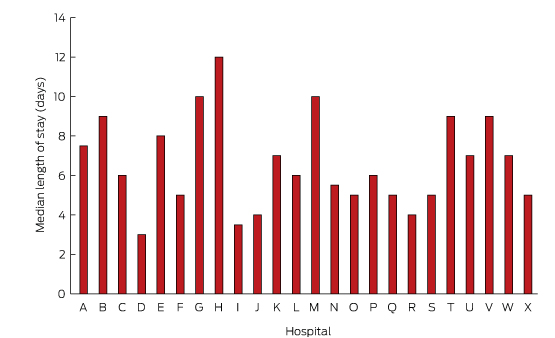
Forty-five patients (6%) died during the index admission. Of 766 patients who survived to discharge, 557 (73%) underwent frailty assessment, of whom a large proportion (71%) were assessed as being frail. On discharge, the condition of most patients (83%) was classified as New York Heart Association class II (mild symptoms) or III (marked limitations of activity) (Box 6). The median length of stay was 6 days for patients who survived to discharge, and 7 days for those who died during admission. As shown in Box 7, the median length of stay ranged between 3 and 12 days for individual hospitals. Most patients (74%) were discharged home. Just over half the patients (59%) were referred to a multidisciplinary HF service.
Discussion
The NSW HF Snapshot provides a unique window onto the characteristics of patients admitted with acute HF to public hospitals in urban and rural NSW and the ACT. The opt-out approach to patient consent enabled consecutive patients to be enrolled, limiting selection bias and providing a real world picture of patients and their care.
The mean age of patients enrolled in the NSW HF Snapshot was greater than that of patients enrolled in other international HF registries,7–17 although it was comparable with that of patients from Australian sites that participated in the Acute Decompensated Heart Failure Registry — Asia Pacific (ADHERE-AP).18 The patients were also similar in many other key demographic and clinical characteristics to those in ADHERE-AP. It is encouraging that the proportion of patients who had an echocardiogram in our study was much higher than reported in previous Australian studies.18,19
The most common precipitants of acute HF identified were infection and non-adherence to medications or to dietary or fluid restrictions, each of which accounted for about one-fifth of hospitalisations. Similar rates for these precipitants have been reported by other registries.7,20 The high rate of infection-related HF is consistent with the fact that the snapshot was conducted during mid-winter. We did not record immunisation history, but this would be a valuable addition to a future survey. The high rate of non-adherence as a precipitant is disappointing, but underscores the critical need for disease management interventions.21 The prevalence of atrial fibrillation or flutter on admission was higher than recorded by most acute HF registries, and may be partly explained by the older age of patients in the NSW HF Snapshot. Interestingly, although atrial fibrillation/flutter was detected in 42% of patients on admission, it was thought to have been the precipitant of HF in only 15% of patients.
In-hospital pharmacotherapy was similar to that reported by other major international acute HF registries,17,18,22 highlighting the lack of new therapies for acute HF. Intravenous vasodilators and inotropic agents were each administered to less than 10% of patients, consistent with recent international trends finding that use of these therapies is declining.23,24 The frequency of mechanical ventilation support (mainly non-invasive) was about 20%, similar to figures reported by international HF registries.7,9,23
The rate of prescription at admission of ACEIs/ARBs for patients with decompensated HF and an LVEF < 40% was similar to rates reported by other international registries,22 and indicated considerable shortfalls compared with their recommended use.25 We did not ascertain the reasons for which patients were not prescribed particular agents, so we can only speculate as to why there was reduced prescribing of these agents at discharge for patients with decompensated HFREF. This group may have included patients who had not responded to the agents during their admission, or who had experienced adverse events or other signs of real or perceived contraindications. While this may partly explain the underprescribing of evidenced-based HF therapy, our data suggest that the uptake of evidence-based recommendations can be improved.
An innovative aspect of the NSW HF Snapshot was the assessment of frailty prior to discharge. There are several factors that may explain the high prevalence of frailty. HF and frailty may share common pathways, including risk factors and inflammatory processes that can manifest as cachexia, which is also associated with frailty.26 We chose to use a simple measure of frailty, consisting of five questions and a measure of handgrip strength.6 This was, however, developed for primary care settings, so we cannot rule out the possibility that we overestimated the prevalence of frailty. Our data are among the first to report the prevalence of frailty in patients admitted to hospital with HF.
The variation in the length of stay could be explained by a number of factors. The NSW HF Snapshot was conducted across a broad range of institutions, from small rural hospitals to large tertiary referral centres. Variations in patient mix, available resources, and admitting speciality are just some of the factors that may have contributed to the variation. Future analyses will explore the impact of these and other factors on the length of stay.
Disease registries provide a valuable tool for capturing data over time, and allow for the evaluation of the quality of care and outcomes. Ideally, a registry would capture all relevant patients, but for common conditions, such as HF, this is usually not the case. A major criticism of registries is that they are expensive and labour-intensive to run and maintain. The snapshot methodology allows for a comprehensive although brief picture of contemporaneous usual care practice. Simultaneous inclusion of a wide range of acute facilities, ranging from tertiary urban referral centres to small rural and district hospitals, helps to ensure a real world representation of patients with acute decompensated HF.
Although this was the first population-based point prevalence survey of acute HF admissions in Australia, several limitations must be acknowledged. Hospitals were invited to participate, and all sites were teaching hospitals with staff cardiologists, and may therefore not be representative of remote facilities or hospitals without an on-site cardiologist. As the case report form consisted of only two pages, it was not possible to collect detailed information in all fields, such as echocardiography results and the aetiology of HF. As we were unable to collect data from non-participating institutions, the length of stay for patients transferred from or to another facility may have been underestimated. Finally, the NSW HF Snapshot was conducted during a one-month period during the Australian winter; as some risk factors may vary seasonally, our survey may not accurately reflect patterns of admission and care throughout the year.
Conclusion
The NSW HF Snapshot has highlighted the advanced age and multiple comorbidities of patients admitted to NSW and ACT hospitals with acute HF, and the high prevalence of frailty in these patients. The use of evidence-based therapies for patients with decompensated HF, particularly ACEIs and β-blockers, was less than optimal, and there was little evidence that these therapies were introduced during the patients’ stays in hospital. The extent to which patient, institutional and system characteristics contribute to variations in care and outcomes is being explored in further analyses. We anticipate that the results of the NSW HF Snapshot will inform the development of strategies for improving access to multidisciplinary care programs and increasing the uptake of evidence-based therapies.
Box 1 –
Number of patients recruited at each hospital for the NSW Heart Failure Snapshot study*
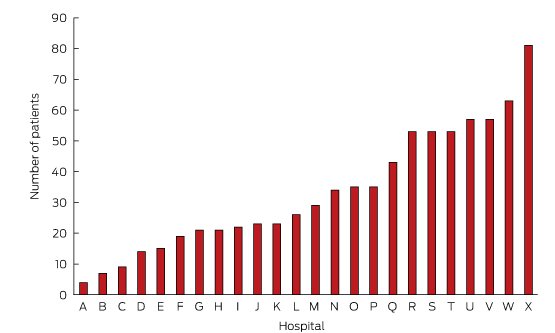
* Each site was assigned an alphabetic code to preserve anonymity, with the smallest site labelled A and the largest X.
Box 2 –
Baseline demographic characteristics, past medical history, clinical findings at presentation and cardiac investigations for the 811 study participants*
|
|
Total sample |
HFREF |
HFPEF |
P |
|||||||||||
|
|
|||||||||||||||
|
Number of patients |
811 |
433 |
318 |
|
|||||||||||
|
Demographic characteristics |
|
||||||||||||||
|
Sex (men) |
465 (58%) |
295 (69%) |
146 (46%) |
< 0.001 |
|||||||||||
|
Age, years (mean ± SD) |
77 ± 13 |
75 ± 14 |
79 ± 12 |
< 0.001 |
|||||||||||
|
Lives alone |
272 (35%) |
151 (36%) |
101 (33%) |
0.328 |
|||||||||||
|
Nursing home resident (at time of admission) |
80 (11%) |
38 (10%) |
33 (11%) |
0.501 |
|||||||||||
|
Born in Australia |
472 (59%) |
255 (59%) |
182 (57%) |
0.502 |
|||||||||||
|
Past medical history |
|
||||||||||||||
|
Previous chronic heart failure |
540 (68%) |
306 (72%) |
194 (62%) |
0.008 |
|||||||||||
|
Ischaemic heart disease |
445 (56%) |
265 (62%) |
152 (49%) |
< 0.001 |
|||||||||||
|
Renal disease |
433 (55%) |
256 (54%) |
177 (57%) |
0.601 |
|||||||||||
|
Diabetes |
304 (38%) |
165 (39%) |
120 (39%) |
0.211 |
|||||||||||
|
Pulmonary disease |
251 (32%) |
117 (29%) |
113 (37%) |
0.015 |
|||||||||||
|
Charlson Index score (median [IQR]; range) |
3 [2–5]; 0–16 |
3 [2–5]; 0–16 |
3 [2–5]; 0–14 |
0.914 |
|||||||||||
|
Heart failure aetiology |
|
|
|
|
|||||||||||
|
Hypertension |
204 (25%) |
85 (20%) |
104 (33%) |
< 0.001 |
|||||||||||
|
Ischaemic heart disease |
346 (43%) |
233 (54%) |
90 (28%) |
< 0.001 |
|||||||||||
|
Cardiomyopathy |
121 (15%) |
93 (22%) |
24 (8%) |
< 0.001 |
|||||||||||
|
Other |
236 (29%) |
87 (20%) |
133 (42%) |
< 0.001 |
|||||||||||
|
Implantable cardioverter-defibrillator |
70 (9%) |
61 (15%) |
6 (2%) |
< 0.001 |
|||||||||||
|
Permanent pacemaker |
133 (17%) |
86 (20%) |
40 (13%) |
0.008 |
|||||||||||
|
Echocardiogram† |
701 (96%) |
405 (96%) |
296 (96%) |
0.781 |
|||||||||||
|
Clinical findings at presentation |
|||||||||||||||
|
Precipitant for admission |
|
|
|
0.047 |
|||||||||||
|
Ischaemia |
98 (13%) |
71 (16%) |
27 (9%) |
|
|||||||||||
|
Infection |
169 (22%) |
95 (21%) |
74 (25%) |
|
|||||||||||
|
Rhythm abnormality |
112 (15%) |
63 (14%) |
49 (16%) |
|
|||||||||||
|
Non-adherence to medication |
41 (5%) |
21 (5%) |
20 (7%) |
|
|||||||||||
|
Non-adherence to dietary or fluid restrictions |
124 (16%) |
82 (18%) |
42 (14%) |
|
|||||||||||
|
Other |
214 (28%) |
127 (28%) |
87 (29%) |
|
|||||||||||
|
Rhythm on admission |
|
|
|
0.004 |
|||||||||||
|
Sinus rhythm |
330 (42%) |
183 (44%) |
124 (40%) |
|
|||||||||||
|
Atrial fibrillation/flutter |
330 (42%) |
152 (36%) |
149 (48%) |
|
|||||||||||
|
Systolic blood pressure on admission, mmHg (mean ± SD) |
136 ± 33 |
132 ± 33 |
141 ± 32 |
< 0.001 |
|||||||||||
|
Diastolic blood pressure on admission, mmHg (mean ± SD) |
77 ± 36 |
79 ± 43 |
75 ± 20 |
0.248 |
|||||||||||
|
|
|||||||||||||||
|
HFREF = heart failure with reduced ejection fraction; HFPEF = HF with preserved ejection fraction; IQR = interquartile range; SD = standard deviation. * Left ventricular ejection fraction was not reported for 60 patients; the data for these patients were included in the total sample analysis, but not in the separate analyses of the HFREF and HFPEF groups. † Investigators were asked to record whether subjects had undergone echocardiography either during the index admission or prior to admission as part of the investigation for clinically diagnosed heart failure. |
|||||||||||||||
Box 3 –
The admitting specialties for the 811 study participants
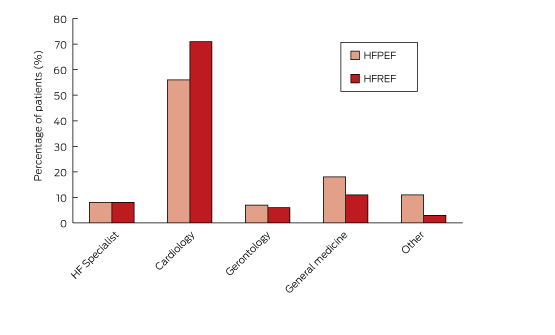
HF = heart failure; HFREF = heart failure with reduced ejection fraction; HFPEF = heart failure with preserved ejection fraction.
Box 4 –
Therapy received by the study participants during their hospital stay*
|
|
Total sample |
HFREF |
HFPEF |
P |
|||||||||||
|
|
|||||||||||||||
|
Number of patients |
811 |
433 |
318 |
|
|||||||||||
|
Intravenous diuretics |
643 (81%) |
342 (81%) |
250 (80%) |
0.824 |
|||||||||||
|
Intravenous glyceryl trinitrate |
53 (7%) |
26 (6%) |
22 (7%) |
0.670 |
|||||||||||
|
Oxygen therapy |
673 (87%) |
369 (90%) |
254 (83%) |
0.008 |
|||||||||||
|
Intravenous inotrope |
63 (8%) |
42 (10%) |
17 (6%) |
0.023 |
|||||||||||
|
Dialysis |
16 (2%) |
9 (2%) |
7 (2%) |
0.964 |
|||||||||||
|
Intra-aortic balloon pump/extracorporeal membrane oxygenation |
8 (1%) |
7 (2%) |
1 (0%) |
0.081 |
|||||||||||
|
Continuous positive airways pressure/bimodal positive airways pressure |
133 (17%) |
73 (18%) |
50 (16%) |
0.573 |
|||||||||||
|
Cardiopulmonary resuscitation |
21 (3%) |
12 (3%) |
7 (2%) |
0.578 |
|||||||||||
|
Mechanical ventilation |
29 (4%) |
18 (4%) |
8 (3%) |
0.186 |
|||||||||||
|
Referred for heart transplant assessment |
17 (2%) |
13 (3%) |
4 (1%) |
0.101 |
|||||||||||
|
Referred to multidisciplinary care team |
458 (59%) |
261 (63%) |
173 (56%) |
0.055 |
|||||||||||
|
|
|||||||||||||||
|
HFREF = heart failure with reduced ejection fraction; HFPEF = heart failure with preserved ejection fraction. * Left ventricular ejection fraction was not reported for 60 patients; the data for these patients were included in the total sample analysis, but not in the separate analyses of the HFREF and HFPEF groups. |
|||||||||||||||
Box 5 –
Admission and discharge pharmacotherapy for patients with left ventricular ejection fraction (LVEF) ≥ 40% or LVEF < 40%
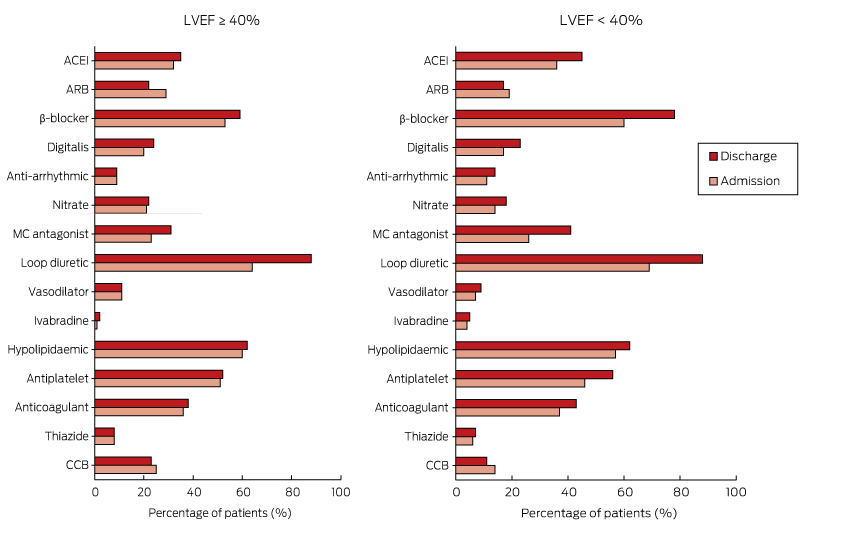
ACEI = angiotensin-converting enzyme inhibitor; ARB = angiotensin receptor blocker; CCB = calcium channel blocker; MC antagonist = mineralocorticoid receptor antagonist.
Box 6 –
Pre-discharge frailty assessment, New York Heart Association status, and discharge outcome*
|
Pre-discharge assessment |
Total sample |
HFREF |
HFPEF |
P |
|||||||||||
|
|
|||||||||||||||
|
Frailty (n = 557) |
|
|
|
0.038 |
|||||||||||
|
Not frail |
45 (8%) |
29 (9%) |
13 (6%) |
||||||||||||
|
Pre-frail |
115 (21%) |
76 (24%) |
35 (17%) |
||||||||||||
|
Frail |
397 (71%) |
214 (67%) |
164 (77%) |
||||||||||||
|
New York Heart Association class (n = 706)† |
|
|
|
0.103 |
|||||||||||
|
Class I |
70 (10%) |
26 (7%) |
33 (12%) |
||||||||||||
|
Class II |
368 (52%) |
208 (55%) |
145 (52%) |
||||||||||||
|
Class III |
220 (31%) |
117 (31%) |
86 (31%) |
||||||||||||
|
Class IV |
48 (7%) |
30 (8%) |
15 (5%) |
||||||||||||
|
Outcome (n = 783)† |
|||||||||||||||
|
Discharged home |
582 (74%) |
352 (75%) |
230 (74%) |
0.271 |
|||||||||||
|
Discharged to residential aged care facility |
71 (9%) |
36 (8%) |
35 (11%) |
||||||||||||
|
Transferred to another medical facility |
85 (11%) |
56 (12%) |
29 (9%) |
||||||||||||
|
Died |
45 (6%) |
28 (6%) |
17 (6%) |
||||||||||||
|
|
|||||||||||||||
|
HFREF = heart failure with reduced ejection fraction; HFPEF = heart failure with preserved ejection fraction. * Left ventricular ejection fraction was not reported for 60 patients; the data for these patients were included in the total sample analysis, but not in the separate analyses of the HFREF and HFPEF groups. † Reduced numbers are the result of missing data in the case report forms for these data items. New York Heart Association class was recorded only for hospital survivors. |
|||||||||||||||
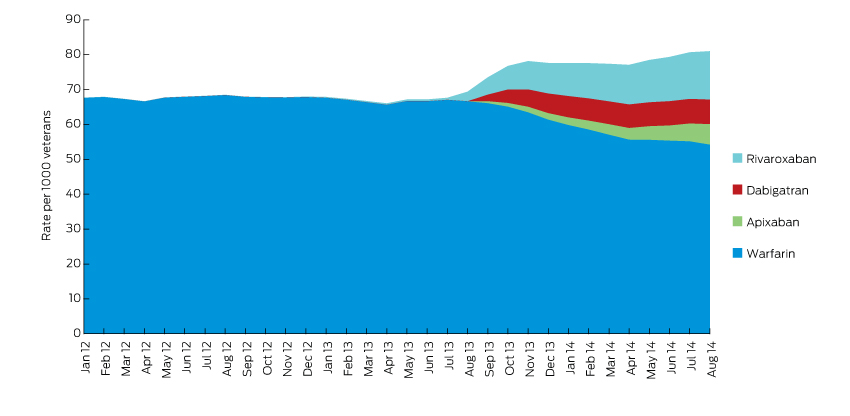
Uptake of novel oral anticoagulants in Australia
Clinical trials have shown that novel oral anticoagulants (NOACs) are as efficacious as warfarin in reducing the risk of stroke in patients with atrial fibrillation.1–3 However, concerns regarding efficacy and safety in real-world populations remain, particularly in patients aged 75 years and older and those with comorbid conditions.4 Three NOACs — dabigatran, rivaroxaban and apixaban — were listed by the Pharmaceutical Benefits Scheme in 2013, but there is little information about their uptake in clinical practice in Australia.
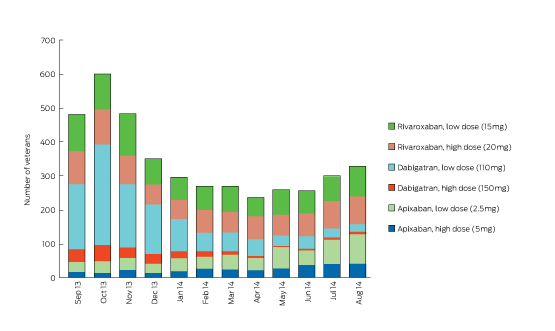
We conducted a retrospective observational study to examine overall use and initiation of oral anticoagulants, and the characteristics of patients for whom they are prescribed. We used administrative claims data from the Australian Government Department of Veterans’ Affairs for patients who were full entitlement holders (ethics approval E010/010). Monthly rates of NOAC and warfarin use were calculated for the period 1 January 2012 – 31 August 2014, and numbers of veterans initiated each month on low-dose and high-dose NOACs were calculated for the period 1 September 2013 – 31 August 2014. Clinical characteristics of new users of NOACs or warfarin (no use of warfarin in the previous 12 months) were compared using χ2 or Wilcoxon rank sum tests.
In the year after NOACs were listed on the Pharmaceutical Benefits Scheme, the overall rate of anticoagulation therapy increased, while the rate of warfarin use decreased (Box 1). There were 3936 and 1506 new users of NOACs and warfarin respectively. The median age of patients in the cohort was 86 years. Use of low-dose formulations of NOACs was most common, potentially reflecting impaired renal function in this older population (Box 2).
Those initiated on NOACs were younger, more likely to be men, had fewer comorbidities, and were less likely to reside in aged care facilities. Use of dose administration aids was similar for NOAC and warfarin users (10.6% [416/3936] and 10.7% [161/1506] respectively). Those initiated on NOACs had fewer hospitalisations recorded in the previous 12 months for gastrointestinal bleed, stroke and myocardial infarct compared with those initiated on warfarin (1.7% [67/3936] v 3.1% [46/1506], P = 0.0017; 3.3% [128/3936] v 7.2% [108/1506], P < 0.0001; and 2.2% [86/3936] v 4.5% [68/1506], P < 0.0001 respectively). Concomitant use of antithrombotic medicines was significantly lower in those initiated on NOACs compared with those initiated on warfarin (21.0% [803/3819] v 35.1% [491/1397], P < 0.0001). Non-steroidal anti-inflammatory drug use was greater in those initiated on NOACs (8.7% [332/3819] v 6.2% [87/1397], P < 0.004). (The denominators 3819 and 1397 include only those who survived 120 days after initiation of the NOAC or warfarin.) Together with the lack of reversibility of the anticoagulation effect of NOACs, these results are of concern and suggest that prescribers should consider the potential risk of bleeds when NOACs are co-administered with medicines such as non-steroidal anti-inflammatory drugs. This analysis was performed in an older veteran population and may not be generalisable to the wider Australian population.
The overall increased use of oral anticoagulants since the introduction of NOACs may reflect use in patients who were previously considered unsuitable for treatment with warfarin. It appears that pre-existing risk factors are being considered by prescribers when making the choice between NOACs and warfarin. However, prescribers need to remain vigilant to the risk of bleeding with NOACs, particularly in patients who are taking other medicines that might increase bleeding risk.
[Perspectives] The land of the lotus eaters
One of the first cardiac arrests I was called to as a resident was in the middle of the night for a young woman who had overdosed on a mixture of heroin and fentanyl. A senior resident ran the code from the foot of the bed while another intern and I took it in turn to do chest compressions until the new automatic CPR machine was assembled and moved into place around the patient’s torso, at which point it took over and we stepped back, watching the oddly silent piston extend and retract, momentarily uncertain what to do with ourselves.
[Comment] Pulmonary pressure, telemedicine, and heart failure therapy
Heart failure is a leading cause of hospital admissions in patients with cardiac diseases and poses a huge burden for patients and societies. In recent years, major advances have been made with the introduction of new drugs and novel interventional approaches such as cardiac resynchronisation therapy. However, there is a need for further improvement, especially considering the projection for increases in heart failure prevalence caused by ageing of the population. Longer survival of patients with cardiac diseases, an effect of modern life-extending treatments, such as primary angioplasty for myocardial infarction and implantable defibrillators for prevention of sudden cardiac death, also contributes to the need for more effective therapies for heart failure.
Profit-hungry insurers put health system at risk
Aggressive cost-cutting by health insurers is leaving patients stranded without adequate cover and putting the private health system at risk, the AMA has warned.
The peak medical group has told the Federal Government’s Private Health Insurance Review that industry practices including downgrading existing policies, habitually rejecting claims, lumbering patients with bigger out-of-pocket costs, pressuring policyholders into reducing their cover and selling people cover they don’t need, were badly compromising the value of private health cover and could eventually upset the delicate balance between the public and private health systems.
“On their own, these activities reduce the value of the private health insurance product,” the AMA said in its submission to the Review. “Collectively, they are having a destabilising effect on privately insured in-hospital patient care and treatment.”
Health Minister Sussan Ley launched the Review amid growing outrage about the remorseless rise of private health insurance premiums, which far outstrip inflation.
Ms Ley said people were increasingly calling into question the value for money in private health insurance, and late last year sought consumer views on changes including allowing insurers to charge different premiums according to age, gender and smoking status – effectively ending the system of community rating.
But whereas the Health Minister has put the focus on industry regulation as much of the cause of the problem, AMA President Professor Brian Owler said it was being driven largely by the hunger for profit.
Professor Owler said there were several emerging trends in private health insurance that were alarming, most notably a steady downgrading in the quality of cover on offer.
He said that in the last six years the proportion of people with policies that had exclusions had jumped from 10 to 35 per cent, often with serious consequences.
The AMA President said it had become virtually a daily occurrence for patients booked in for common treatments to discover upon arrival that they were not covered by their insurance.
He said all too often insurers made changes to a policy after it had been bought without informing policyholders, leaving many unexpectedly stranded.
“People are shocked to make this discovery only when they need a particular treatment, and doctors are seeing this happen on a daily basis,” Professor Owler said.
The AMA is also concerned by growth in policies that only cover admission as a private patient in a public hospital, or which contain significant exclusions, such as for cardiac treatment or joint replacement.
“A high rate of ‘insured’ people with exclusion policies is effectively creating a risk rating system, as insurers reduce their exposure by offering products that are less likely to require them to pay benefits,” it said, adding that many were inadvertently buying “junk” policies that are designed solely to avoid incurring the Medicare surcharge and provide no practical health cover.
“People think they have purchased a product that will allow them [a] choice of doctor and to jump the public waiting list, but this is unlikely in reality,” the AMA said.
Another development in the peak medical group’s sights is the decision of some insurers not to cover the costs of patients readmitted to private hospital because of complications arising from their treatment.
The AMA said the new approach, pioneered by Medibank Private, the nation’s largest insurer, has serious implications for patient care, and interfere with established safety and quality arrangements.
It warned this could lead private hospitals to refuse to admit patients at high risk of complications, directly compromising the ability of doctors to care for their patients and likely forcing more patients with chronic and complex conditions into the public system.
This risk would be compounded by the possibility, aired by Ms Ley in her consumer survey, that insurers could charge different premiums according perceived health risk.
The AMA warned that such a change would fatally undermine the central tenet of community rating, which requires that all holders of a particular policy pay the same premium – a requirement that helps ensure private cover is available to all.
Professor Owler said that, taken together, these developments in private health insurance did not bode well for the nation’s health system.
“The nature of the current policy offerings, coupled with the behaviour of some insurers to minimise the benefits they pay, is undermining the quality of the product,” he warned. “If consumers withdraw from private health insurance because it is a low value product, or quality products are unaffordable, or risk-rating means some people are uninsurable, there will be additional pressure on the public hospital sector, which is already struggling to meet demand.”
Professor Owler said the Private Health Insurance Review needed to take account of how developments in private health insurance would affect the balance between the public and private health systems.
But he said the Government appeared to have little interest in this, and was instead “more focused on removing itself from financial and regulatory responsibility for the private health sector”.
The Government has flagged interest in dumping the private health insurance rebate and substituting it with a Medicare-style rebate system for hospital treatment that could be used in both the private and public sectors.
Adrian Rollins
[Perspectives] Magdi Yacoub: a lifelong affair with the heart
Professor Sir Magdi Yacoub began his career in cardiac surgery’s pioneering days at a time when surgeons had an unspoken licence to be adventurous. Not surprisingly, he has accumulated an immense depth and breadth of experience in operations on children as well as adults. But so, of course, did others. What then was special about him? One colleague who has had ample opportunity to watch Yacoub at work is anaesthetist Gavin Wright. He first met him in the 1980s, and worked with him for three decades.