As appropriately highlighted by the accompanying Comment,1 the study by Anoop Shah and colleagues (Dec 19, 2015, p 2481)2 nicely complements previous efforts defining safe and effective strategies to rule out myocardial infarction.3,4 We would like to ask the authors to better help clinicians to put their findings into perspective by providing more details regarding two methodological limitations that could affect the clinical application of the single value strategy. First, only 1608 (42%) of 3799 patients had serial sampling of cardiac troponin.
Preference: Cardiology and Cardiac Surgery
99
[Correspondence] Measurement of cardiac troponin for exclusion of myocardial infarction
In a prospective cohort study using a high-sensitivity cardiac troponin assay, Anoop Shah and colleagues1 determined an optimal threshold of circulating troponin to identify patients suitable for immediate discharge among those presenting to emergency departments with suspected acute coronary syndrome. The threshold of less than 5 ng/L could identify almost two-thirds of patients without myocardial infarction along with a high negative predictive value of 99·6% in the entire cohort. These findings are probably generalisable, because a recent meta-analysis of 23 studies,2 which evaluated troponin concentrations using a different high-sensitivity assay, generated similar results, and found that the threshold of 3–5 ng/L will miss up to 1% of patients with myocardial infarction.
[Correspondence] Measurement of cardiac troponin for exclusion of myocardial infarction
Anoop Shah and colleagues1 report that an ARCHITECTSTAT high-sensitivity cardiac troponin I (hs-cTnI) of less than 5 ng/L at presentation would identify two-thirds of patients with suspected acute coronary syndrome as being at low risk of cardiac events (negative predictive value of 99·6%) who could be discharged. The authors acknowledge that this requires evaluation in clinical practice.
Absolute risk of cardiovascular disease events, and blood pressure- and lipid-lowering therapy in Australia
Cardiovascular disease (CVD) is the leading cause of morbidity and mortality internationally.1,2 A large proportion of CVD events are preventable by appropriate population-level interventions and individual management of risk. The potential for benefit, the balance of benefits and harms, and the cost-effectiveness of treatments to reduce CVD events are more closely related to an individual’s absolute CVD risk — the absolute probability that they will experience a CVD event in a given time period — than to isolated individual risk factors or relative risks.3,4
Accurate assessment of absolute CVD risk applies quantitative data on multiple factors that influence risk, including smoking status, blood pressure (BP), blood lipid levels, and diabetes status, to a person’s age- and sex-specific background level of absolute risk.3 Assessment that is based only on individual risk factors (eg, considering cholesterol levels alone) and does not use tools that allow quantification of overall absolute CVD risk leads to substantial misclassification, a general underestimation of risk, and under- and overtreatment.5 Quantitative absolute risk models that assess risk and guide management are central to the primary prevention of CVD, nationally and internationally.6–9
Population-level data on absolute CVD risk have the potential to inform programs, policy and planning, including those associated with implementing large scale treatment strategies according to absolute CVD risk.10 However, population-level data on absolute CVD risk are not available for most countries, including Australia.
Our investigation aimed to quantify absolute CVD risk in the Australian adult population, as well as treatment with BP- and lipid-lowering medications, using data from a representative health survey. It focused on individuals aged 45–74 years, the age group for which most risk calculators have been validated, and with the greatest population burden of premature CVD.
Methods
Study population
The study population comprised 9564 participants from the Australian Bureau of Statistics (ABS) Australian Health Survey11 aged 18 years or over who provided biomedical data for the National Health Measures Survey (NHMS) between March 2011 and September 2012. Details of the Australian Health Survey and NHMS are provided in the Appendix. Of the 30 329 respondents eligible to participate in the NHMS (ie, Australian Health Survey participants aged 5 years and over), 11 246 (37.1%) did so (46.5% of those aged 45–74 years).
Data and variables
Data on sociodemographic and health-related factors, including prior CVD, medical history and health behaviours, were provided by self-report at the home-based interview for the Australian Health Survey. Height, weight, waist circumference, and systolic and diastolic BP were measured directly, fasting blood samples taken and assayed, and a medications review conducted, using standard methods. Details of these methods and the derived variables (eg, diabetes status) are included in the Appendix, in reference and in Box 1.
Absolute risk of a primary CVD event
The absolute risk of a primary CVD event over the next 5 years for a participant without prior CVD was estimated by applying the Australian National Vascular Disease Prevention Alliance (NVDPA) risk assessment and risk management algorithm, which includes the Framingham CVD risk equation;7,11–13 see the Appendix for details. The absolute risk of a primary CVD event over the next 5 years was categorised using the cut-points: low (< 10%); moderate (10–15%); high (> 15%).7
Statistical methods
All analyses were conducted by staff at the ABS, in collaboration with the authors and using ABS statistical programs, in accordance with the Australian Census and Statistics Act 1905 (Cth), supplemented by calculations by the authors, based on these analyses.
The proportions of people with and without prior CVD were calculated for the entire population aged 18 years or more, as well as by sex and age group. Among those without prior CVD, the distributions of the risk factors contributing to the CVD risk algorithm were estimated for those aged 45 years or more.
The proportions of those aged 18 years or more with low, moderate and high absolute CVD risk were calculated for those without prior CVD and presented according to age group and sex. In those aged 45–74 years, the proportions of those with selected health characteristics and risk factors and the proportions receiving BP- and/or lipid-lowering medications were estimated according to prior CVD and absolute primary CVD risk.
Weights were applied to all prevalence estimates to account for the sampling strategy and non-response (see Appendix). The numbers of individuals in Australia with different CVD risk factors, absolute risk levels, and treatment profiles were estimated by applying the weighted proportions to Australian general population data.11 Standard errors were calculated, taking into account variability due to sampling and to random adjustment, as were 95% confidence intervals (CIs).
Ethics approval
Ethics approval for NHMS data collection was provided by the Australian Government Department of Health Human Research Ethics Committee (reference 2/2011). Additional approval was granted by the Australian National University Human Research Ethics Committee (reference 2014/208).
Results
Respondents for whom data were missing about previous CVD or any components of the risk assessment algorithm, including factors in the Framingham CVD risk equation, were excluded from the analyses; 1059 participants were excluded by these criteria. We therefore analysed the data for 8505 participants aged 18 years or more (3828 men and 4677 women), of whom 4844 were aged 45–74 years (2210 men, 2634 women). The Appendix includes the separate results for men and women.
Prior CVD and absolute risk of a primary CVD event
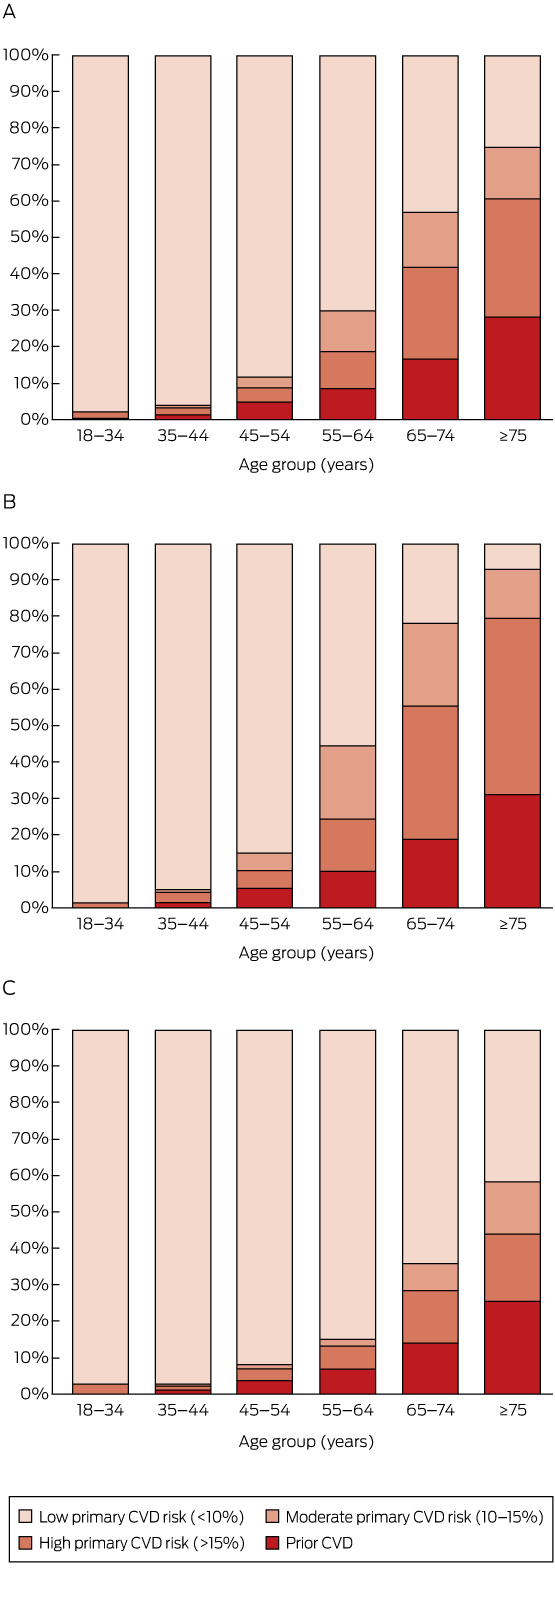
Overall, 6.2% of those aged 18 years or more (corresponding to an estimated 1 071 000 adults in Australia), including 8.7% (95% CI, 7.8–9.6%) of those aged 45–74 years (an estimated 634 000 adults), were classified as having prior CVD (Box 2).
A total of 8.2% of those aged 18 years or more (an estimated 1 412 000 adults) were at high absolute risk of a primary CVD event (Box 2). The proportion at high primary risk was 1.9% in those aged 18–44 years, and increased with age (Box 2, Box 3). Major risk factors were often present in those aged 45–74 years without prior CVD (Box 1, Appendix).
Among those aged 45–74 years, 71.5% (95% CI, 70.1–72.9%; an estimated 5 209 000 people) were at low risk of a primary CVD event, 8.6% (95% CI, 7.4–9.8%; an estimated 625 000 people) were at moderate primary risk, and 11.2% (95% CI, 10.2–12.2%; an estimated 811 000 people) were at high primary risk (Box 2).
Combining those with prior CVD and those at high risk of a primary event, an estimated 19.9% (95% CI, 18.5–21.3%) of people in Australia aged 45–74 years had a high 5-year risk of a CVD event (an estimated 1 445 000 people), including 25.8% (95% CI, 23.4–28.2%) of men (an estimated 925 000 people) and 14.2% (95% CI, 12.6–15.8%) of women (an estimated 522 000 people) in this age bracket (Box 2, Appendix). As would be expected, risk was related to major CVD risk factors (Appendix, Table S2).
BP- and lipid-lowering medications
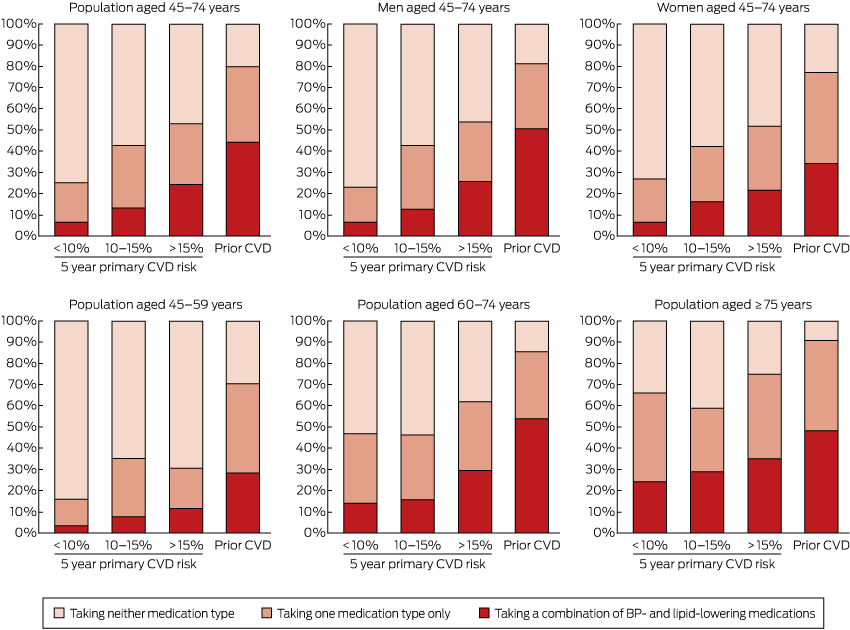
Use of BP- and lipid-lowering medications was substantially more common in those with prior CVD and in those at higher primary risk than in those at lower risk (Box 4, Box 5; Appendix, Table S3). In those aged 45–74 years with prior CVD, 44.2% were receiving both BP- and lipid-lowering medications (an estimated 280 000 people), 35.4% were receiving only one of these medication types (an estimated 225 000 people), and 20.4% were receiving neither (an estimated 129 000 people) (Box 4).
Among people aged 45–74 years who did not have prior CVD and were at high absolute risk of a primary event, 24.3% were receiving both BP- and lipid-lowering medications (an estimated 197 000 people), 28.7% were receiving only one of these medication types (an estimated 233 000 people), and 47.1% were receiving neither (an estimated 382 000 people) (Box 4). Corresponding figures for those at moderate primary CVD risk were 13.2% (an estimated 82 000 people); 29.5% (an estimated 185 000 people); and 57.3% (an estimated 358 000 people). Of those at low primary CVD risk, 6.6% were receiving both BP- and lipid-lowering medications (an estimated 346 000 people), 18.6% were receiving only one of these medication types (an estimated 966 000 people), and 74.8% were receiving neither (an estimated 3 896 000 people) (Box 4).
Discussion
An estimated one-fifth of the Australian population aged 45–74 years, or about 1.4 million people, had a greater than 15% absolute risk of a CVD event in the next 5 years. This was made up of 11% of individuals aged 45–74 years (about 800 000 people) with a greater than 15% probability of a primary CVD event in the next 5 years, and 9% (about 630 000 people) with existing CVD. Although the risk assessment tools used have not generally been validated outside this age range, our data also suggest that around 2.6% of the population aged 18–44 years (about 230 000 people) and 60.6% of those aged 75 years or more (about 850 000 people) were at high absolute risk of a future CVD event. Levels of absolute CVD risk were higher for men than for women; risk also increased markedly with age.
The Australian NVDPA algorithm uses global CVD (which encompasses coronary heart disease, cerebrovascular disease, peripheral vascular disease and heart failure) as its predicted outcome.14 For more than a decade, Australian national guidelines have recommended lipid-lowering therapies for those at high absolute CVD risk, and consideration of absolute CVD risk in the management of hypertension.15,16 The 2012 NVDPA guidelines recommend combination treatment with BP- and lipid-lowering medications unless contraindicated or clinically inappropriate, together with lifestyle advice, for those with a 5-year primary CVD risk of more than 15%; it advises considering combination treatment for those at moderate risk (5-year primary CVD risk of 10–15%) if 3 to 6 months of lifestyle intervention does not reduce risk sufficiently, or if certain risk factors are present, such as a family history of premature CVD.7 Recently, United Kingdom and United States guidelines have changed from recommending lipid-lowering treatment for those with a 10-year CVD risk of 20% or greater (roughly equivalent to the Australian moderate and high risk categories) to recommending it for individuals with 10-year CVD risks of 10% (UK)9 or 7.5% (US)8 or greater.
We were unable to identify any previous studies that had profiled absolute global CVD risk for a national population, integrating representative information on the absolute risk of primary and secondary CVD events, and treatment with BP- and lipid-lowering medications. A recent article reported that 15.5% of the US population aged 20–79 years was at high absolute risk of a future coronary heart disease event (rather than global CVD event) within 10 years according to the US Adult Treatment Panel (ATP) III guidelines.17 Although CVD absolute risk is likely to vary by population and over time, these US results on coronary heart disease are comparable with our findings that 6.2% of those aged 18 years or more have prior CVD of any kind, and that 13.0% have at least a 10% primary risk of global CVD over the next 5 years.17,18
About half of those with prior CVD aged 45–74 years and one-quarter of those with a 5-year primary CVD risk above 15% were receiving both BP- and lipid-lowering medications, compared with one in 15 of those at low primary risk. This indicates that these medications were, to some extent, being targeted. At the same time, large opportunities for improvement in treatment are apparent, especially in the younger age group: 76% of individuals aged 45–74 years and 88% of individuals aged 45–59 years with a 5-year primary CVD risk greater than 15% were not receiving combination BP- and lipid-lowering treatment.
Applying our estimates to the general population in 2011–12, an estimated 510 000 individuals aged 45–74 years in Australia were at high risk of primary CVD or had prior CVD and were receiving neither BP-lowering nor lipid-lowering medications; a further 460 000 in these groups were receiving only one of the two medication types. This suggests that up to 970 000 people, or 13% of the Australian population aged 45–74 years, have a 5-year risk of a CVD event greater than 15% and are not receiving currently recommended combination BP- and lipid-lowering therapies. A further 620 000 people are at moderate absolute risk of CVD, with about 540 000 not receiving combination BP- and lipid-lowering therapies.
BP- and lipid-lowering treatments were the focus of our analyses because they are the main treatments for preventing CVD events, and are indicated in both primary and secondary prevention. Additional medications, including anti-platelet agents, are recommended for individuals with existing CVD. The treatment gaps we have identified are therefore likely to be underestimates.
The general findings that BP- and lipid-lowering treatment was more common among those at high risk than in those at low risk, and that there were considerable gaps in treatment, are broadly consistent with findings from earlier clinical and non-representative studies, despite the generally higher levels of CVD risk in these samples.19,20 These studies found that 40–75% of patients with existing CVD were receiving both BP- and lipid-lowering therapies,21–23 consistent with the 44% combined treatment rate we found. Also consistent are primary care data from Australia and New Zealand which indicate that about one-quarter of those with a 5-year primary risk of 15% or more are taking combination BP- and lipid-lowering treatments.19,20,22
Our findings concern the general population, a substantial proportion of whom are receiving treatment likely to influence their CVD risk and risk factors. The Framingham Risk Equation is aimed at treatment-naive individuals and will tend to underestimate risk in those receiving treatment. Ideally, absolute CVD risk should be assessed before commencing treatment; however, this is not practical for a population-based sample of this type. It is not possible to reliably ascertain the underlying prior absolute CVD risk status of those who are being treated with BP- and/or lipid-lowering medications and who are assessed as being at low or moderate absolute CVD risk, as they may have moved to a lower risk category because of changes in BP and/or blood lipid profiles. Further, treatment with BP- and lipid-lowering medication is still recommended in some contexts for individuals with abnormalities in single risk factors. Consequently, while lipid-lowering treatments are not recommended for those at low CVD risk, data from our study are relatively uninformative with regard to potential overtreatment in this group.
The gap between current guideline-recommended treatment and the use of BP- and lipid-lowering medications we describe is likely to be related to a number of factors, including the extent of absolute risk-based CVD assessment, appropriate prescribing and uptake, and continuation of treatment. In Australia, CVD risk assessment is recommended from age 45 for the general population and from age 35 for people of Aboriginal and/or Torres Strait Islander background.7 The fact that more than 97% of individuals aged 18–44 years in our study were estimated to be at low primary CVD risk supports the current age cut-off for assessment. It is not known what proportion of the general population undergoes guideline-based absolute CVD risk assessment. Recent evidence indicates that less than half of the eligible individuals attending primary care have had a documented quantitative CVD risk assessment.20,22,23 Although BP- and lipid-lowering medications are generally well tolerated and relatively safe, it is likely that their not being used is, in some cases, the result of contraindications, adverse drug events, a lack of prescription, cost, or their being declined by the patient. Further, international summary estimates of continuation with BP-lowering medications are 42–61% and 62–79% for primary and secondary prevention of coronary heart disease respectively; corresponding figures for statins are 57% and 76%.24
The NHMS assessed CVD risk and medication using inclusive home interview-based sampling and high quality methods. Despite its large size, particularly in comparison with other representative surveys, numbers were limited and confidence intervals were wide in some subgroups. There were insufficient numbers of Aboriginal and Torres Strait Islander participants to quantify risk in this group; relevant analyses would be beneficial when appropriate data become available. The study response rate was 46.5% in the target population (those aged 45–74 years) and the study methods produced estimates representative of the general non-institutionalised Australian population. The NHMS used validated data collection tools that have inherent limitations, including a range of measures based on self-report (such as smoking status, alcohol consumption, and previous CVD). Data were lacking for some measures incorporated into the NVDPA algorithm, including familial hypercholesterolaemia and persistent proteinuria. These limitations and the under-inclusion of institutionalised participants (who are more likely to be older and to have a greater illness burden) mean that absolute CVD risk may have been underestimated, particularly in those over 74 years of age.
Implications
Our results highlight the ongoing efforts and the major opportunities for reducing the frequency of CVD events. Implementation of large scale CVD risk assessment and treatment based on absolute risk is considered to be one of the most cost-effective interventions.25 We estimate that about 870 000 individuals aged 45–74 years at moderate to high absolute risk of CVD are receiving neither BP- nor lipid-lowering therapies. Broadly speaking, lowering systolic BP by around 8 mmHg in this group would prevent an estimated 20 to 37 cardiovascular events per 1000 treated;4 an estimated 31 to 61 events would be prevented for each 1 mmol/L reduction in low-density lipoprotein cholesterol levels.26 While detailed modelling is required for accurate quantification, these findings indicate that more extensive treatment of this single risk group alone could prevent tens of thousands of CVD events in Australia.
Box 1 –
Estimated distribution of cardiovascular disease (CVD) risk factors included in the National Vascular Disease Prevention Alliance algorithm for the Australian-population without prior CVD, by age group
|
Characteristic |
Age group (years) |
||||||||||||||
|
45–54 |
55–64 |
65–74 |
≥ 75 |
Total (≥ 45) |
|||||||||||
|
|
|||||||||||||||
|
Total number |
|
|
|
|
|
||||||||||
|
Smoking status |
|
|
|
|
|
||||||||||
|
Never smoked |
48.1% |
48.7% |
49.6% |
48.9% |
48.7% |
||||||||||
|
Ex-smoker |
37.8% |
38.6% |
43.4% |
48.4% |
40.4% |
||||||||||
|
Current smoker |
14.1% |
12.7% |
7.0% |
2.6% |
11.0% |
||||||||||
|
Systolic blood pressure |
|
|
|
|
|
||||||||||
|
< 120 mmHg |
49.3% |
33.3% |
21.1% |
16.6% |
35.3% |
||||||||||
|
120–139 mmHg |
35.9% |
40.1% |
40.9% |
40.0% |
38.6% |
||||||||||
|
140–179 mmHg |
14.5% |
25.6% |
35.8% |
37.6% |
24.6% |
||||||||||
|
≥ 180 mmHg |
0.2% |
1.0% |
2.2% |
5.7% |
1.5% |
||||||||||
|
Diastolic blood pressure |
|
|
|
|
|
||||||||||
|
< 90 mmHg |
83.0% |
84.3% |
86.8% |
91.3% |
85.1% |
||||||||||
|
90–109 mmHg |
16.7% |
15.3% |
12.5% |
8.0% |
14.5% |
||||||||||
|
≥ 110 mmHg |
0.3% |
0.4% |
0.7% |
0.7% |
0.4% |
||||||||||
|
Low density lipoprotein cholesterol |
|
|
|
|
|
||||||||||
|
< 2.0 mmol/L |
2.0% |
4.0% |
9.1% |
12.4% |
5.2% |
||||||||||
|
2.0–3.5 mmol/L |
52.5% |
47.6% |
51.7% |
59.8% |
51.6% |
||||||||||
|
> 3.5 mmol/L |
45.4% |
48.4% |
39.2% |
27.8% |
43.2% |
||||||||||
|
High density lipoprotein cholesterol |
|
|
|
|
|
||||||||||
|
≥ 1.0 mmol/L |
88.7% |
89.8% |
89.7% |
91.5% |
89.6% |
||||||||||
|
< 1.0 mmol/L |
11.3% |
10.2% |
10.3% |
8.5% |
10.4% |
||||||||||
|
Total cholesterol |
|
|
|
|
|
||||||||||
|
< 4.0 mmol/L |
4.7% |
6.2% |
10.8% |
15.3% |
7.6% |
||||||||||
|
4.0–7.5 mmol/L |
92.8% |
91.5% |
87.0% |
83.3% |
90.2% |
||||||||||
|
> 7.5 mmol/L |
2.5% |
2.3% |
2.2% |
1.5% |
2.2% |
||||||||||
|
Total cholesterol:high density lipoprotein cholesterol ratio |
|
|
|
|
|
||||||||||
|
< 4.5 |
62.3% |
67.8% |
73.7% |
79.7% |
68.2% |
||||||||||
|
4.5–5.9 |
28.3% |
24.1% |
20.1% |
16.5% |
24.0% |
||||||||||
|
≥ 6 |
9.4% |
8.2% |
6.2% |
3.7% |
7.7% |
||||||||||
|
Diabetes |
4.7% |
8.1% |
14.5% |
11.2% |
8.4% |
||||||||||
|
Diabetes with microalbuminuria |
0.8% |
1.4% |
4.5% |
4.0% |
2.1% |
||||||||||
|
Moderate to severe chronic kidney disease |
0.1% |
0.4% |
1.7% |
6.8% |
1.3% |
||||||||||
|
|
|||||||||||||||
|
|
|||||||||||||||
Box 2 –
Estimated proportions and numbers of individuals in the Australian population with prior cardiovascular disease (CVD), and among those without prior CVD with low, moderate or high absolute 5-year risk of a primary CVD event, by age group and sex
|
Age group and sex |
No prior CVD |
Prior CVD |
|||||||||||||
|
Absolute CVD risk category |
|
|
|||||||||||||
|
Low (< 10%) |
Moderate (10–15%) |
High (> 15%) |
|
|
|||||||||||
|
% [95% CI] |
N* |
% [95% CI] |
N* |
% [95% CI] |
N* |
% [95% CI] |
N* |
||||||||
|
|
|||||||||||||||
|
Total population |
|||||||||||||||
|
18–34 years |
97.8 [96.6–99.0] |
5271 |
0.0 [0.0–0.0] |
0 |
1.8 [0.8–2.8] |
98 |
0.4 [0.0–0.8] |
19 |
|||||||
|
35–44 years |
96.3 [95.2–97.4] |
3042 |
0.3 [0.0–0.6] |
9 |
2.1 [1.3–2.9] |
68 |
1.3 [0.5–2.1] |
41 |
|||||||
|
45–54 years |
88.4 [86.5–90.3] |
2685 |
3.0 [1.7–4.3] |
90 |
4.0 [2.7–5.3] |
121 |
4.6 [3.3–5.9] |
139 |
|||||||
|
55–64 years |
70.3 [67.7–72.9] |
1800 |
11.0 [8.9–13.1] |
281 |
10.2 [8.3–12.1] |
263 |
8.5 [6.7–10.3] |
218 |
|||||||
|
65–74 years |
43.1 [39.7–46.5] |
724 |
15.1 [12.7–17.5] |
254 |
25.4 [22.5–28.3] |
427 |
16.4 [13.9–18.9] |
277 |
|||||||
|
≥ 75 years |
25.6 [20.4–30.8] |
359 |
13.8 [10.8–16.8] |
194 |
32.4 [27.5–37.3] |
456 |
28.2 [23.1–33.3] |
396 |
|||||||
|
Total |
80.8 [80.0–81.6] |
13 923 |
4.8 [4.3–5.3] |
828 |
8.2 [7.5–8.9] |
1412 |
6.2 [5.6–6.8] |
1071 |
|||||||
|
Men |
|||||||||||||||
|
18–34 years |
98.5 [97.3–99.7] |
2693 |
0.0 [0.0–0.0] |
0 |
1.4 [0.3–2.5] |
40 |
0.0 [0.0–0.0] |
0 |
|||||||
|
35–44 years |
95.1 [93.2–97.0] |
1492 |
0.4 [0.0–0.9] |
6 |
3.1 [1.4–4.8] |
48 |
1.4 [0.3–2.5] |
23 |
|||||||
|
45–54 years |
85.0 [81.7–88.3] |
1278 |
4.9 [2.5–7.3] |
74 |
4.8 [2.6–7.0] |
72 |
5.4 [3.1–7.7] |
81 |
|||||||
|
55–64 years |
55.5 [51.1–59.9] |
706 |
20.1 [16.0–24.2] |
256 |
14.3 [11.4–17.2] |
183 |
10.0 [7.1–12.9] |
128 |
|||||||
|
65–74 years |
21.9 [17.6–26.2] |
182 |
22.7 [18.8–26.6] |
188 |
36.6 [31.4–41.8] |
305 |
18.8 [14.7–22.9] |
156 |
|||||||
|
≥ 75 years |
7.1 [3.0–11.2] |
41 |
13.3 [9.3–17.3] |
78 |
48.5 [41.5–55.5] |
285 |
31.1 [24.6–37.6] |
183 |
|||||||
|
Total |
74.8 [73.5–76.1] |
6361 |
7.2 [6.2–8.2] |
615 |
11.1 [10.1–12.1] |
943 |
6.8 [5.9–7.7] |
579 |
|||||||
|
Women |
|||||||||||||||
|
18–34 years |
97.1 [95.2–99.0] |
2577 |
0.0 [0.0–0.0] |
0 |
2.2 [0.5–3.9] |
59 |
0.7 [0.0–1.5] |
19 |
|||||||
|
35–44 years |
97.5 [96.2–98.8] |
1552 |
0.2 [0.0–0.6] |
3 |
1.2 [0.5–1.9] |
19 |
1.2 [0.2–2.2] |
19 |
|||||||
|
45–54 years |
91.8 [89.5–94.1] |
1405 |
1.1 [0.2–2.0] |
18 |
3.3 [1.8–4.8] |
51 |
3.8 [2.3–5.3] |
59 |
|||||||
|
55–64 years |
84.8 [81.6–88.0] |
1093 |
1.9 [1.1–2.7] |
26 |
6.2 [4.0–8.4] |
80 |
7.0 [5.1–8.9] |
90 |
|||||||
|
65–74 years |
64.0 [59.7–68.3] |
544 |
7.5 [5.1–9.9] |
64 |
14.4 [11.8–17.0] |
122 |
14.1 [10.9–17.3] |
120 |
|||||||
|
≥ 75 years |
41.6 [33.3–49.9] |
340 |
14.3 [9.9–18.7] |
117 |
18.5 [12.1–24.9] |
151 |
25.6 [18.1–33.1] |
210 |
|||||||
|
Total |
86.6 [85.6–87.6] |
7570 |
2.4 [1.9–2.9] |
210 |
5.3 [4.4–6.2] |
466 |
5.6 [4.8–6.4] |
490 |
|||||||
|
|
|||||||||||||||
|
* N = estimated number, in thousands, of persons in each category in Australia. Weighting and missing values mean that numbers do not always sum to totals. |
|||||||||||||||
Box 3 –
Estimated distribution of prior cardiovascular disease (CVD) and absolute risk of a primary CVD event over the next 5 years by age group, in the total Australian population aged 18 years or more (A) and for men (B) and women (C) separately
Box 4 –
Estimated proportions and numbers of individuals aged 45 or more in the Australian who were receiving blood pressure (BP)-lowering* and/or lipid-lowering† medications, according to cardiovascular disease (CVD) risk
|
|
No prior CVD |
Prior CVD |
Total |
||||||||||||
|
Absolute primary CVD risk category |
|
|
|
|
|||||||||||
|
Low (<10%) |
Moderate (10-15%) |
High (>15%) |
|
|
|
|
|||||||||
|
% [95% CI] |
N‡ |
% [95% CI] |
N‡ |
% [95% CI] |
N‡ |
% [95% CI] |
N‡ |
% [95% CI] |
N‡ |
||||||
|
|
|||||||||||||||
|
Population aged 45–74 years |
|||||||||||||||
|
Lipid-lowering medication |
13.7 [11.4–16.0] |
714 |
20.1 [13.2–27.0] |
126 |
32.5 [25.9–39.1] |
265 |
55.7 [47.0–64.4] |
354 |
19.8 [17.8–21.8] |
1438 |
|||||
|
No lipid-lowering medication |
86.3 [83.9–88.7] |
4494 |
79.9 [73.0–86.8] |
499 |
67.5 [60.9–74.1] |
548 |
44.3 [35.5–53.1] |
281 |
80.2 [78.2–82.2] |
5842 |
|||||
|
BP-lowering medication |
18.1 [15.9–20.3] |
945 |
35.8 [27.1–44.5] |
223 |
44.7 [37.7–51.7] |
362 |
68.1 [60.5–75.7] |
432 |
26.6 [24.3–28.9] |
1940 |
|||||
|
No BP-lowering medication |
81.9 [79.7–84.1] |
4262 |
64.2 [55.5–72.9] |
401 |
55.3 [48.3–62.3] |
449 |
31.9 [24.3–39.5] |
202 |
73.4 [71.1–75.7] |
5340 |
|||||
|
BP- and lipid-lowering medication |
6.6 [5.1–8.1] |
346 |
13.2 [7.7–18.7] |
82 |
24.3 [18.3–30.3] |
197 |
44.2 [36.8–51.6] |
280 |
12.2 [10.6–13.8] |
889 |
|||||
|
Taking one medication only |
18.6 [16.2–21.0] |
966 |
29.5 [21.8–37.2] |
185 |
28.7 [22.7–34.7] |
233 |
35.4 [27.8–43.0] |
225 |
22.0 [20.1–23.9] |
1599 |
|||||
|
Taking neither medication |
74.8 [72.2–77.4] |
3896 |
57.3 [48.4–66.2] |
358 |
47.1 [39.9–54.3] |
382 |
20.4 [13.9–26.9] |
129 |
65.8 [63.3–68.3] |
4792 |
|||||
|
Population aged ≥ 75 years |
|||||||||||||||
|
Lipid-lowering medication |
39.3 [25.5–53.1] |
142 |
30.8 [16.7–44.9] |
60 |
43.0 [30.8–55.2] |
196 |
59.7 [45.9–73.5] |
236 |
44.1 [36.6–51.6] |
621 |
|||||
|
No lipid-lowering medication |
60.7 [46.9–74.5] |
219 |
69.2 [55.1–83.3] |
134 |
57.0 [44.8–69.2] |
259 |
40.3 [26.5–54.1] |
160 |
55.9 [48.4–63.4] |
785 |
|||||
|
BP-lowering medication |
51.0 [35.3–66.7] |
184 |
56.9 [38.9–74.9] |
110 |
66.6 [58.6–74.6] |
304 |
79.1 [69.5–88.7] |
313 |
63.9 [58.0–69.8] |
899 |
|||||
|
No BP-lowering medication |
49.0 [33.3–64.7] |
176 |
43.1 [25.2–61.0] |
84 |
33.4 [25.3–41.5] |
152 |
20.9 [11.3–30.5] |
83 |
36.1 [30.2–42.0] |
507 |
|||||
|
BP- and lipid-lowering medication |
24.2 [12.9–35.5] |
87 |
28.9 [14.5–43.3] |
56 |
34.9 [24.2–45.6] |
158 |
48.3 [35.0–61.6] |
192 |
34.3 [27.8–40.8] |
482 |
|||||
|
Taking one medication only |
41.9 [28.8–55.0] |
151 |
30.0 [15.9–44.1] |
59 |
39.8 [28.4–51.2] |
181 |
42.3 [29.6–55.0] |
167 |
39.4 [32.2–46.6] |
555 |
|||||
|
Taking neither medication |
33.9 [19.7–48.1] |
121 |
41.2 [23.6–58.8] |
81 |
25.3 [16.2–34.4] |
115 |
9.4 [2.9–15.9] |
37 |
26.3 [19.7–32.9] |
369 |
|||||
|
|
|||||||||||||||
|
* Hypertension medications includes Anatomic Therapeutic Chemical Classification C02 (antihypertensives), C03 (diuretics), C07 (beta blocking agents), C08 (calcium channel blockers) and C09 (agents acting on the renin–angiotensin system). † Lipid-lowering medications include Anatomic Therapeutic Chemical Classification C10 (lipid modifying agents, plain and combinations. ‡ N = estimated number, in thousands, of persons in each category in Australia. Weighting and missing values mean that numbers do not always sum to totals. |
|||||||||||||||
Box 5 –
Estimated distribution of Australians receiving blood pressure (BP)-lowering* and/or lipid-lowering† medications, by absolute risk of primary cardiovascular disease (CVD) event or prior CVD, by sex and age group
* Hypertension medications includes Anatomic Therapeutic Chemical Classification C02 (antihypertensives), C03 (diuretics), C07 (beta blocking agents), C08 (calcium channel blockers) and C09 (agents acting on the renin–angiotensin system). † Lipid-lowering medications include Anatomic Therapeutic Chemical Classification C10 (lipid modifying agents, plain and combinations.
Lost in translation: the gap between what we know and what we do about cardiovascular disease
An estimated one million Australians at high risk may not have been receiving recommended preventive treatments
We still seem disappointingly distant from getting it right with disease prevention in Australia. An analysis of data from the 2011–12 Australian National Health Measures Survey reported in this issue of the MJA1 found that most respondents at high risk of cardiovascular disease (CVD) were not receiving the recommended combination of blood pressure-lowering and lipid-lowering medications. Applying these estimates to the general population, almost one million Australians at high risk may not have been receiving these treatments, although their use has long been recommended by the national peak body on the basis of level A evidence.
Perhaps the data are incorrect? While the response rate to the survey among those aged 45–74 years (47%) was lower than desirable, survey respondents would be expected to have better, not worse, treatment rates than non-respondents. It is also likely that self-reporting overestimates treatment levels. Perhaps the data reflect the prevalence of contraindications to recommended treatment? Again, this is unlikely: definite contraindications to lipid-lowering and blood pressure-lowering medications are very rare, and placebo-controlled trials have shown that only a small proportion of subjects taking statins experience symptomatic side effects.2
What is going wrong?
How much of the problem is related to physicians not prescribing medications in the first place, and how much is due to patients not continuing to use them in the long term? For people with an acute coronary syndrome, prescription rates at discharge have climbed steadily in recent years; the main challenge seems to be the steady drop-off in adherence in the months and years following the acute event.3 Both patient- and prescriber-related factors contribute to this drop-off. Patient-related factors include comorbidities, mental health problems, social context, and their perceptions of their illness; even those who have a heart attack underestimate their risk, and misperceptions are associated with the persistence of risk-elevating behaviours, including smoking and non-adherence to medication.4 The cost of drugs may play a bigger role in the Australian context than is recognised.5 Physicians may fail to recognise non-adherence or explain the need to continue therapy. Over-attribution of “side effects” to medication is also a factor,2 compounded in Australia by biased media coverage about statins.6
For people at high primary risk of CVD, we suspect the main problem is under-prescribing of medications that reduce the risk of CVD. A paradigm change is needed, and we have only begun to address this need. The dominant paradigm for many decades has been to prescribe these medications only for people with hypertension or dyslipidaemia; indeed, many drug labels still recognise only these indications. The compelling rationale that use of these drugs should instead be primarily targeted on the basis of high absolute risk of CVD has been plain for many years. The evidence for the benefits of blood pressure-lowering medications for people with non-optimal blood pressure but without hypertension has become even clearer in the past few months.7 Nevertheless, diagnosis and treatment practices for hypertension remain similar to those of several decades ago, when it was erroneously thought there was a threshold of hypertension below which lowering blood pressure conferred no benefit.
Do we need to try something new?
We clearly need to improve our strategies for addressing the evidence–practice gap in CVD risk management. This is part of a wider systemic problem in continuing medical education, our ability to translate large amounts of new research data into practice.
Should we be considering a public health and policy-driven approach? In the United Kingdom, the Quality and Outcomes Framework (QOF) annually rewards practices for their provision of quality care according to evidence-based indicators.8 For example, the indicators for the secondary prevention of coronary heart disease (CHD) include general practices maintaining a register of CHD patients and of the proportions prescribed angiotensin-converting enzyme inhibitors or angiotensin-receptor blockers, aspirin, β-blockers, and statins.8 A registry would enable practices to have annual recall programs for reviewing treatment of CHD patients. In Australia, the National Health and Medical Research Council has recently adopted implementing the absolute risk approach to primary prevention as a priority for research translation.9
Technology-based solutions may also help. Hospital medical records, patient-controlled e-health medical records, and general practice medical records could incorporate red flags for pre-specified indicators of prevention needs not being met. Electronic decision support studies support the potential effectiveness of these type of strategies.10 Other technology-based solutions could include smart pill boxes, pharmacy support programs, telehealth support, and automated text reminders.11 These strategies are all ready to roll now, whereas other innovations, such as polypills, may play a role in the near future.12 There is evidence that supports the efficacy of all these strategies, but none has yet been substantively employed.
CVD is our leading killer and cause of health care costs, but almost one million Australians at high risk may not have been receiving the basic recommended preventive medications. This is the low-hanging fruit in CVD control. A multifaceted approach is needed: patient-centred, evidence-based primary care will be the key.
Out-of-hospital cardiac arrest in high-rise buildings: delays to patient care and effect on survival [Research]
Background:
The increasing number of people living in high-rise buildings presents unique challenges to care and may cause delays for 911-initiated first responders (including paramedics and fire department personnel) responding to calls for out-of-hospital cardiac arrest. We examined the relation between floor of patient contact and survival after cardiac arrest in residential buildings.
Methods:
We conducted a retrospective observational study using data from the Toronto Regional RescuNet Epistry database for the period January 2007 to December 2012. We included all adult patients (≥ 18 yr) with out-of-hospital cardiac arrest of no obvious cause who were treated in private residences. We excluded cardiac arrests witnessed by 911-initiated first responders and those with an obvious cause. We used multivariable logistic regression to determine the effect on survival of the floor of patient contact, with adjustment for standard Utstein variables.
Results:
During the study period, 7842 cases of out-of-hospital cardiac arrest met the inclusion criteria, of which 5998 (76.5%) occurred below the third floor and 1844 (23.5%) occurred on the third floor or higher. Survival was greater on the lower floors (4.2% v. 2.6%, p = 0.002). Lower adjusted survival to hospital discharge was independently associated with higher floor of patient contact, older age, male sex and longer 911 response time. In an analysis by floor, survival was 0.9% above floor 16 (i.e., below the 1% threshold for futility), and there were no survivors above the 25th floor.
Interpretation:
In high-rise buildings, the survival rate after out-of-hospital cardiac arrest was lower for patients residing on higher floors. Interventions aimed at shortening response times to treatment of cardiac arrest in high-rise buildings may increase survival.
Two energy drinks a day may send a doctor your way
Many Australians turn to energy drinks to reduce fatigue, increase wakefulness, and improve concentration and performance, but a study has found that drinking more than two energy drinks a day can cause adverse heart reactions, including a fast heartbeat, heart palpitations, and chest pain.
Researchers from the University of Adelaide surveyed patients aged 13 to 40 years who attended an emergency department in South Australia with heart palpitations, and found 70 per cent had consumed some version of an energy drink.
Dr Scott Willoughby, co-author of the study, said that the study was able to find a direct link between energy drink consumption and hospital admissions for adverse heart reactions.
“Of the patients surveyed, 36 per cent had consumed at least one energy drink in the 24 hours prior to presenting at the hospital, and 70 per cent had consumed some sort of energy drink in their lifetime,” Dr Willoughby said.
“Those patients who were heavy consumers of energy drinks were found to have significantly higher frequency of heart palpitations than those who consumed less than one a day.
“And importantly, fast heartbeat, heart palpitations, and chest pain was seen in energy drink consumers who were healthy and had no risk factors for heart disease.”
AMA Vice President, Dr Stephen Parnis, told the Herald Sun that people did not realise the serious health repercussions of energy drinks, some of which have the same amount of caffeine as 10 or 20 cups of coffee.
“Poisoning is not too strong a word to use for the effects of these drinks on some people,” Dr Parnis said.
“I have seen teenagers present in emergency with heart rates of 200 beats per minute or who are so stimulated that their behaviour is extremely distressing to their parents and the people around them.
“At the bare minimum, energy drinks should come with warning labels.
“I think that preventing sales of these drinks to people under 18 is something that we need to look at very closely.”
The study was published in International Journal of Cardiology.
Kirsty Waterford
English as a second language and outcomes of patients presenting with acute coronary syndromes: results from the CONCORDANCE registry
Australia is one of the most culturally and linguistically diverse nations in the world, its population of 24 million including an estimated 6 million people who were born overseas.1 Australian research has shown a higher prevalence of cardiovascular risk factors among southern European, Middle Eastern and Indian immigrants.2,3 The lack of a mutually comprehensible and usable written and spoken language is a major barrier to effective communication between health care providers and patients. This potentially affects the provision of primary and secondary disease preventive care, which, in turn, may affect patient outcomes. Immigrants from non-English-speaking backgrounds have a higher incidence of admissions for acute myocardial infarction, and remain in hospital longer than their English-speaking peers.4 Communication and language barriers have also been shown to affect the provision of quality care for South Asian immigrants.5
The Cooperative National Registry of Acute Coronary Care, Guideline Adherence and Clinical Events (CONCORDANCE) is an Australian observational registry that describes the management and outcomes of patients presenting to hospitals with acute coronary syndromes (ACS) from geographically diverse regions of Australia.6 Information about patients’ demographic characteristics, including whether the patient reported English as their second language, their presenting characteristics, past medical history, in-hospital management, and outcomes at 6 months and 2 years are collected. In our study, we examined the effect of having English as the second spoken language on the treatment and outcomes for patients presenting with an ACS.
Methods
The CONCORDANCE registry currently includes data from 41 hospitals representative of regional and acute care facilities, with a range of clinical and treatment characteristics and procedural capabilities. Enrolment processes and inclusion and exclusion criteria for the registry have been described previously.6 In brief, every month each site enrols the first ten patients who present to hospital with symptoms of an ACS together with significant electrocardiographic changes, elevated cardiac enzyme levels, or newly documented coronary heart disease.
Data collection and measures
The data collected included details about pre-hospital assessment and management, and the admission diagnosis; demographic characteristics; medical history; in-hospital investigations and management, including the timing of invasive therapy; medication dosage and timing; and in-hospital events. Clinical events are defined in the Appendix. Patients were followed up to assess quality of life measures, clinical events, and medication compliance 6 months and 2 years after discharge.
Definition of English as a second language
Demographic information collected included data pertaining to Indigenous status, country of birth, and language (English as first language [EFL] v English as second language [ESL] v unknown/undocumented). Ethnic background was classified as documented in the medical record, according to participant self-report or determined when discussing the study with the participant. The focus of our study was an analysis of demographic differences, use of evidence-based therapies, and cardiovascular outcomes, according to whether the subject reported using English as their first or second language.
Statistical analysis
Patients were dichotomised according to their English language status (ESL v EFL). Data for continuous variables were summarised as means and standard deviations (SDs), and for dichotomous variables as numbers of people and percentages.
Data were analysed in SAS 9.3 (SAS Institute). Baseline data were compared in univariate analyses (χ2 tests, t tests and Wilcoxon rank sum tests). Stepwise logistic regression was used to model the predictors associated with mortality. To account for the clustering effect of hospital as a factor, generalised estimating equation correction with an exchangeable working correlation matrix was applied. Similarly, a robust variance estimator was applied to the Cox regression analysis used to model overall mortality (from admission to 6-month follow-up). The proportional hazards assumption was visually checked by plotting the estimated survivor functions, and the ratio of hazards was found to be constant across time. Estimates of adjusted survival curves from the proportional hazard model were generated using the mean of covariates method.
The following factors were included in the Cox regression model: age, sex, diagnosis, Global Registry of Acute Coronary Events (GRACE) risk score, prior percutaneous coronary intervention (PCI), prior coronary bypass grafting (CABG), in-hospital PCI, in-hospital CABG, diabetes, prior myocardial infarction, congestive heart failure, renal failure, and prior stroke.
Candidate variables for the stepwise logistic regression models included those statistically significant at α = 0.1 in univariate comparisons. GRACE risk score was included in the model regardless of the statistical significance in the univariate comparison. Generalised linear modelling was performed using a forward selection process with entry and exclusion criteria set at α = 0.1.
Missing data
For 106 patients there was no registry information about language; these patients were excluded from the models that included language as a variable. In addition, about 2% of responses for other variables were missing; patients with missing data have been omitted from analyses where these variables were included in the model.
Ethics approval
The study protocol conforms with the ethics guidelines of the 1975 Declaration of Helsinki as reflected by a priori approval in the guidelines of the institutions’ human research ethics committees. Concord Hospital was the lead site for the New South Wales sites (approval reference, HREC 08/CRGH/180). Two authors (BD and DB) had full access to the data and assume full responsibility for the integrity of the data and the accuracy of the analysis. The lead author (CJ) affirms that this article is an accurate and transparent account of the study.
Results
Enrolment in the CONCORDANCE registry commenced in February 2009. In this article we present data on the first 6304 patients enrolled at 41 sites, of whom 27.7% presented with ST elevation myocardial infarction (STEMI), 47.3% with non-STEMI (NSTEMI), and 25% with unstable angina. The data used in this analysis include patients registered to June 2014.
Nearly three-quarters of the patients (4578, or 73%) were from Australia or New Zealand; 287 were from Asia (Chinese, 37; Southern Asian, 117; other Asian, 133), 498 from the United Kingdom or North America, 578 from Europe, 45 from Africa, and 318 were categorised as “other”. A total of 418 patients (6.6%) identified themselves as Aboriginal or Torres Strait Islander.
One thousand and five patients (15.9%) reported English as their second language. These patients were younger than those in the EFL group, and the prevalence of cardiovascular risk factors was higher (Box 1). The incidence of comorbidities was also higher in the ESL group, but there were no significant differences between the ESL and EFL groups in median GRACE risk score. ESL patients were more likely to be admitted to a metropolitan than to a rural hospital (70.4% v 61.1%; P < 0.001), but there were no differences in median symptom onset to admission time (2.4 h v 2.6 h; P = 0.44), median door-to-needle time (47 min v 42 min; P = 0.59), or median door-to-balloon time (118 min v 113 min; P = 0.40).
Rates of coronary angiography and PCI were lower in the ESL group, while rates of CABG were similar. ESL patients were also less likely to be referred for outpatient cardiac rehabilitation (Box 2).
The median length of hospital stay was greater for ESL patients (5 days v 4 days; P < 0.001). Antiplatelet agents such as ticagrelor and prasugrel were used less by ESL patients, but the use of other evidence-based therapies was similar in both groups (Box 3).
There was a higher incidence of heart failure, renal failure, stroke, recurrent myocardial infarction, major bleeding, and in-hospital mortality in the ESL group (Box 4). Independent predictors of in-hospital mortality included presentation in cardiogenic shock, cardiac arrest in hospital, in-hospital renal or cardiac failure, and having English as a second language (Box 5). At the 6-month follow-up, all-cause mortality was also higher in the ESL group (13.8% v 8.3%; P = 0.0001) (Box 6). ESL, age, in-hospital renal failure, and recurrent ischaemia were independent predictors of 6-month mortality (Box 7). The Cox regression model of survival at 6 months is outlined in Box 8.
Discussion
We found that mortality among patients presenting with an ACS who report English as their second language was higher than among those who report English as their first language. Other studies of Australian populations have not reported such a difference,7,8 but analyses of administrative data have compared populations according to standardised mortality rates, and did not specifically assess language as a marker of risk.
The incidence of diabetes mellitus, hypertension, dyslipidaemia and smoking was higher in our ESL group than among than those who used English as their first language. A systematic review2 found a higher incidence of smoking among male immigrants from the Middle East, the UK and Ireland, western and southern Europe, China, and Vietnam than among Australians of the same age. Another UK study suggested that people of South Asian origin had a higher incidence of diabetes mellitus, hypertension, dyslipidaemia and obesity than comparable Europeans,9 although the authors concluded that the measured metabolic risk factors did not entirely explain the overall differences in the incidence of coronary heart disease. Similarly, a study of Asian Indians living in Australia found a higher incidence of hypertension, diabetes mellitus and obesity than the national average.3 The proportion of patients from South Asia in our study was less than 2%, too small for us to identify this particular group as being at increased risk.
Several American studies have found longer delays to treatment for myocardial infarction for Hispanics than for non-Hispanic whites.10–12 The median door-to-needle and door-to-balloon times were slightly longer for our ESL patients, but the differences were not statistically significant.
Although patients with ESL were more likely to be admitted to a metropolitan rather than a rural hospital, we identified a reduced rate of cardiac catheterisation in ESL patients presenting with an ACS and a much lower rate of PCI than for those with English as their first language. Similar findings have been reported for Hispanic migrants in the United States13 and migrants of South Asian background in the UK.14 This is thought to reflect not a physician bias in recommending patients for revascularisation,14 but rather patient treatment preferences15 and perhaps their lack of language skills.16,17 We did not collect data on why revascularisation was not performed, but ESL patients may have had more diffuse disease, not amenable to revascularisation. Lack of English comprehension can affect access to health education that promotes health maintenance (primary prevention), which may mean patients present later, at a more advanced stage of disease.18
An Australian study4 that examined hospital discharge data for the period between 1993–94 and 1997–98 compared outcomes using an English-speaking background (ESB) v non-English-speaking background (NESB) dichotomy, based on the patient’s country of birth rather than their actual capacity to speak English. It was found that NESB patients were more likely to be admitted for acute myocardial infarction than ESB patients, possibly because of a delay in diagnosis. This study found a longer average length of hospital stay for NESB than for ESB patients, which the authors attributed to complications associated with later presentation. We also found a slightly longer length of stay in our ESL group; this may reflect differences in hospital events, but may also reflect delays in organising professional interpreters for obtaining an accurate history and facilitating informed consent for procedures.
Deficiencies in intercultural communication may play a role in the adverse outcomes for patients from culturally and linguistically diverse backgrounds.19,20 A review of the literature on cultural differences in communication suggested that doctors behave less effectively when interacting with patients from ethnic minorities, and patients themselves are also less verbally expressive and seem to be less assertive and effective during medical encounters.4
Fewer patients in our ESL group were referred for cardiac rehabilitation after discharge than patients with English as their first language. Two systematic reviews of secondary prevention programs of randomised controlled trials have shown that either supervised exercise alone21,22 or risk factor education or counselling without an exercise component22 reduced mortality. It is therefore possible that reduced attendance at cardiac rehabilitation in the ESL group also contributed to poorer outcomes. Hospitals should extend the reach of cardiac rehabilitation services by offering multilingual opportunities for patients of different backgrounds.
Second-line antiplatelet agents, such as ticagrelor and prasugrel, were used less in our ESL group. This may be partially explained by fewer PCIs in this cohort and a higher incidence of major bleeding, but clinicians may also have been concerned that they could not accurately exclude contraindications of their use in ESL patients. Prasugrel23 and ticagrelor24 reduce major adverse ischaemic events in patients presenting with an ACS more effectively than clopidogrel, and the less frequent use of these agents in our ESL patients may have contributed to their poorer outcomes.
Limitations
The patients themselves identified whether English was their first or second language, and we have no data on their fluency or length of time in Australia, and this may affect patient care and understanding. Further, we did not collect data on the use of interpreters with our ESL patients. A professionally trained medical interpreter can provide a higher degree of accuracy and confidentiality than family members or bilingual staff members; using non-professional interpreters can be expedient, but has the disadvantage of loss of productivity and additional stress on the staff involved, together with the risk of inadequate or incomplete translation. It is therefore unknown whether the use of interpreter services was adequate, and whether improving their availability would enhance clinical outcomes.
While we attempted to adjust for baseline differences, there may have been unmeasured variables, such as socio-economic status and educational level, that may have confounded the impact of English proficiency on outcomes. Finally, we did not rigorously collect data on compliance with medications and physician follow-up, which may also have affected long term outcomes.25
Conclusion
In this large registry study of patients presenting with an ACS, in-hospital and 6-month mortality was greater for patients who reported English as their second language. While this may be explained by a higher prevalence of cardiovascular risk factors leading to more advanced disease, problems of culturally specific communication may also play important roles, and should be the subject of further research.
Box 1 –
Baseline demographics of the 6304 patients at 41 sites enrolled in the CONCORDANCE database
|
|
English as second language |
English as first language |
Difference (95% CI) |
P |
|||||||||||
|
|
|||||||||||||||
|
Number |
1005 |
5299 |
|
|
|||||||||||
|
Age [SD], years |
63.3 [14.9] |
65.3 [13.5] |
–2.06 (–3.05 to –1.07) |
< 0.001 |
|||||||||||
|
Sex (men) |
691 (68.8%) |
3699 (69.8%) |
–1% (–4% to 2%) |
0.507 |
|||||||||||
|
Diabetes |
403 (40.1%) |
1351 (25.5%) |
15% (11% to 18%) |
< 0.001 |
|||||||||||
|
Hypertension |
669 (66.6%) |
3287 (62.0%) |
5% (1% to 8%) |
0.005 |
|||||||||||
|
Dyslipidaemia |
628 (62.5%) |
2970 (56.0%) |
6% (3% to 10%) |
< 0.001 |
|||||||||||
|
Current smoker |
310 (30.8%) |
1429 (27.0%) |
4% (1% to 7%) |
0.011 |
|||||||||||
|
Median GRACE risk score [IQR] |
124 [100.8–147.6] |
125 [104.0–147.6] |
–1.00 (–3.30 to 1.30) |
0.400 |
|||||||||||
|
Prior cerebrovascular accident |
73 (7.3%) |
430 (8.1%) |
–1% (–3% to 1%) |
0.396 |
|||||||||||
|
Prior myocardial infarction |
368 (36.6%) |
1609 (30.4%) |
6% (3% to 10%) |
< 0.001 |
|||||||||||
|
Prior heart failure |
134 (13.3%) |
488 (9.2%) |
4% (2% to 6%) |
< 0.001 |
|||||||||||
|
Prior coronary artery bypass grafting |
131 (13.0%) |
681 (12.9%) |
0% (–2% to 3%) |
0.840 |
|||||||||||
|
Prior percutaneous coronary intervention |
201 (20.0%) |
1125 (21.2%) |
–1% (–4% to 1%) |
0.380 |
|||||||||||
|
Chronic renal failure |
185 (18.4%) |
411 (7.8%) |
11% (8% to 13%) |
< 0.001 |
|||||||||||
|
|
|||||||||||||||
|
GRACE = Global Registry of Acute Coronary Events. |
|||||||||||||||
Box 2 –
In-hospital interventions in 6304 patients at 41 sites enrolled in the CONCORDANCE database
|
|
English as second language |
English as first language |
Difference (95% CI) |
P |
|||||||||||
|
|
|||||||||||||||
|
Number |
1005 |
5299 |
|
|
|||||||||||
|
Cardiac catheter |
714 (71.0%) |
4003 (75.5%) |
–5% (–8% to –2%) |
0.002 |
|||||||||||
|
Percutaneous coronary intervention |
346 (34.4%) |
2240 (42.3%) |
–8% (–11% to –5%) |
< 0.001 |
|||||||||||
|
Coronary artery bypass grafting |
89 (8.9%) |
411 (7.8%) |
1% (–1% to 3%) |
0.234 |
|||||||||||
|
Rehabilitation referral |
495 (49.3%) |
3120 (58.9%) |
–9% (–13% to –6%) |
< 0.001 |
|||||||||||
|
|
|||||||||||||||
|
|
|||||||||||||||
Box 3 –
Discharge medications for 6304 patients at 41 sites enrolled in the CONCORDANCE database
|
|
English as second language |
English as first language |
Difference (95% CI) |
P |
|||||||||||
|
|
|||||||||||||||
|
Number |
1005 |
5299 |
|
|
|||||||||||
|
Aspirin |
790 (85.9%) |
4276 (85.0%) |
1% (–2% to 3%) |
0.917 |
|||||||||||
|
Clopidogrel |
497 (54.0%) |
2596 (51.6%) |
2% (–1% to 6%) |
0.341 |
|||||||||||
|
Ticagrelor or prasugrel |
79 (8.6%) |
627 (12.5%) |
–4% (–6% to –2%) |
< 0.001 |
|||||||||||
|
β-Blockers |
719 (78.1%) |
3881 (77.1%) |
1% (–2% to 4%) |
0.733 |
|||||||||||
|
Angiotensin-converting enzyme inhibitor or angiotensin receptor blocker |
704 (76.5%) |
3799 (75.5%) |
–1% (–4% to 2%) |
0.740 |
|||||||||||
|
Statin |
815 (88.6%) |
4508 (89.6%) |
–1% (–3% to 1%) |
0.548 |
|||||||||||
|
|
|||||||||||||||
|
|
|||||||||||||||
Box 4 –
In-hospital events for 6304 patients at 41 sites enrolled in the CONCORDANCE database
|
|
English as second language |
English as first language |
Difference (95% CI) |
P |
|||||||||||
|
|
|||||||||||||||
|
Number |
1005 |
5299 |
|
|
|||||||||||
|
Left ventricular failure |
153 (15.2%) |
444 (8.4%) |
7% (5% to 9%) |
< 0.001 |
|||||||||||
|
Renal failure |
103 (10.2%) |
268 (5.1%) |
5% (3% to 7%) |
< 0.001 |
|||||||||||
|
Myocardial infarction |
41 (4.1%) |
144 (2.7%) |
1% (0 to 3%) |
0.021 |
|||||||||||
|
Stroke |
12 (1.2%) |
25 (0.5%) |
1% (0 to 1%) |
0.007 |
|||||||||||
|
Major bleed |
106 (10.5%) |
441 (8.3%) |
2% (0 to 4%) |
0.020 |
|||||||||||
|
Death |
71 (7.1%) |
200 (3.8%) |
3% (2% to 5%) |
< 0.001 |
|||||||||||
|
|
|||||||||||||||
|
|
|||||||||||||||
Box 5 –
Logistic regression analysis of in-hospital mortality
|
Characteristic |
Odds ratio |
95% CI |
P |
||||||||||||
|
|
|||||||||||||||
|
English as first language |
0.56 |
0.33–0.94 |
0.029 |
||||||||||||
|
Cardiac arrest in hospital |
16.95 |
10.53–27.78 |
< 0.001 |
||||||||||||
|
Cardiogenic shock |
7.04 |
4.46–11.11 |
< 0.001 |
||||||||||||
|
GRACE score |
1.04 |
1.03–1.05 |
< 0.001 |
||||||||||||
|
Renal failure |
5.08 |
3.29–7.81 |
< 0.001 |
||||||||||||
|
Congestive failure |
2.08 |
1.26–3.44 |
0.005 |
||||||||||||
|
|
|||||||||||||||
|
GRACE = Global Registry of Acute Coronary Events. |
|||||||||||||||
Box 6 –
Kaplan–Meier estimates of survival at 6 months for 6304 patients at 41 sites enrolled in the CONCORDANCE database*
ESL = English spoken as second language. * Adjusted for age, diagnosis, sex, previous stroke, chronic renal failure, chronic heart failure, diabetes, prior myocardial infarction, prior coronary artery bypass grafting and prior percutaneous coronary intervention.
Box 7 –
Logistic regression analysis of mortality to 6 months after discharge for 6304 patients at 41 sites enrolled in the CONCORDANCE database
|
Characteristic |
Odds ratio |
95% CI |
P |
||||||||||||
|
|
|||||||||||||||
|
English as first language |
0.55 |
0.31–0.97 |
0.040 |
||||||||||||
|
Age |
1.09 |
1.07–1.11 |
< 0.001 |
||||||||||||
|
Renal failure |
4.67 |
2.88–7.58 |
< 0.001 |
||||||||||||
|
Ischaemia |
2.54 |
1.54–4.22 |
< 0.001 |
||||||||||||
|
|
|||||||||||||||
|
|
|||||||||||||||
Box 8 –
Cox regression model of survival at 6 months for 6304 patients at 41 sites enrolled in the CONCORDANCE database
|
Characteristic |
Hazard ratio |
95% CI |
P |
||||||||||||
|
|
|||||||||||||||
|
Age |
1.08 |
1.06–1.10 |
< 0.001 |
||||||||||||
|
Diagnosis |
3.96 |
3.22–4.70 |
< 0.001 |
||||||||||||
|
Sex |
0.86 |
0.42–1.30 |
0.502 |
||||||||||||
|
Prior stroke/transient ischaemic attack |
0.95 |
0.35–1.55 |
0.868 |
||||||||||||
|
Chronic renal failure |
0.43 |
0.05–0.90 |
< 0.001 |
||||||||||||
|
Congestive heart failure |
0.36 |
0.12–0.84 |
< 0.001 |
||||||||||||
|
Diabetes |
0.90 |
0.46–1.34 |
0.642 |
||||||||||||
|
Prior myocardial infarction |
0.84 |
0.36–1.33 |
0.489 |
||||||||||||
|
Prior coronary artery bypass grafting |
1.03 |
0.52–1.53 |
0.922 |
||||||||||||
|
Prior percutaneous coronary intervention |
1.08 |
0.57–1.59 |
0.764 |
||||||||||||
|
Percutaneous coronary intervention |
1.36 |
0.85–1.87 |
0.239 |
||||||||||||
|
Coronary artery bypass grafting |
8.00 |
6.01–9.98 |
0.040 |
||||||||||||
|
|
|||||||||||||||
|
|
|||||||||||||||
Improving health outcomes for linguistically diverse patients
Cardiovascular health for all in Australia requires language-sensitive health systems
Every day, most Australian clinicians treat patients whose first language is not English. Nearly four million Australians speak 350 non-English languages, and 17% rate their spoken English as poor.1 To date, there has been little large scale Australian research into the health impacts of not speaking the country’s dominant language.
Studies on the relationship between linguistic diversity and health outcomes are methodologically challenging. Many have been criticised for their failure to adjust for socio-economic status, education, or English language proficiency, or for using country of birth as a proxy for language spoken at home.2 The prospective cohort study by Juergens and his colleagues, published in this issue of the MJA,3 adds to research on cardiovascular disease and language by analysing mortality 6 months after discharge from hospital. The authors found that mortality was higher in patients whose first language was not English.
Two broad sets of explanations are offered when interpreting differences in health outcomes associated with language: explanations related to socio-epidemiological determinants in the affected population, and explanations related to failures of health service responsiveness.
Although Australia’s immigrant population is heterogeneous, the cardiovascular risk factors in some populations warrant intensive primary and secondary preventive care. The two leading source regions for immigrants to Australia at present — China and South Asia — face escalating epidemics of diabetes.4 So rapid is the increase in prevalence that many communities do not have established strategies for managing patients with diabetes.5 Although the smoking rates among people whose first language is not English are overall lower than those of other Australians, some subpopulations have markedly higher rates.6
Equally important is health literacy: the ability to obtain, read and understand health information. In the 2006 national health literacy survey, only 26% of those born in a non-English speaking country had adequate health literacy, compared with about 45% of those born in Australia or in an English-speaking country.7 Patients with low health literacy may struggle to read and interpret information on how and why to take their medications, the significance of new cardiovascular symptoms, and how to obtain emergency help when they need it. For patients who have experienced cardiovascular events, achieving parity in health literacy may require innovative methods of cardiovascular rehabilitation with language-competent health providers; for example, by employing remote technology, such as Skype, supported by written language information, such as that produced by the National Heart Foundation (http://heartfoundation.org.au/support/information-in-your-language).
Health literacy is the product of good communication between a clinician and their patient, and of health systems that are responsive to the needs of patients. Doctors frequently overestimate the language capacity of their patients,8 who may themselves incorrectly assess their capacity to understand. In the national health literacy survey, more than a quarter of patients with demonstrably poor health literacy rated their ability to read and write English as excellent.7
Despite being a largely migrant country, Australia is unusually monolingual. Four out of five of us can speak only English,1 making us the third most monolingual country in the world, after Brazil and Japan.9 There is as an urgent need to develop and sustain health systems that are responsive to the needs of non-English-speaking Australians. A language-sensitive health system would ensure that complex health information, such as that provided before discharge from hospital or when explaining health interventions, such as cardiac catheterisation, is delivered comprehensibly, using language support resources.
We are a long way from achieving this. So great is the linguistic diversity of Australia that even multilingual doctors rarely find themselves sharing the language of their non-English-speaking patients. Hospitals cannot rely upon on-site interpreters to meet all the language needs of their patients. The Translating and Interpreting Service offers the most extensive telephone interpreting system in the world, providing doctors and pharmacists with rapid, 24-hour access to interpreters; this service does not, however, include Indigenous languages. Further, it is used in less than 1% of consultations by private practitioners with patients with limited English proficiency.10 We should also be able to reliably assess whether or not family members have the competence to adequately interpret for their relatives, when desired.
The challenge of meeting the needs of non-English speakers is a permanent one for Australia. The proportion of people over 65 years who have limited English proficiency increases at each census,1 reflecting the phenomenon of second language attrition as we age.11 The age group at greatest risk of cardiovascular disease is thus the one that may be struggling with diminishing English competence. Effective solutions will require us to develop culturally sensitive health promotion programs for cardiovascular disease, with a particular focus on diabetes as a comorbidity, and whole-of-system approaches which ensure that Australians who do not speak English as their first language can communicate clearly and confidently with their health care providers.
[Comment] Cardiology: a call for papers
The Lancet is planning a special issue to coincide with the European Society of Cardiology Congress to be held Aug 27–31, 2016, in Rome, Italy. We will consider high quality original research papers that will influence clinical practice, especially those that describe the results of randomised trials. If your work is being presented at the meeting and falls under an embargo policy, please tell us the date, time, and manner or presentation (poster or oral). If your paper is accepted, publication on our website can be scheduled to coincide with the presentation.