Cardiac imaging is a rapidly evolving field, with improvements in the diagnostic capabilities of non-invasive cardiac assessment. In this article, we seek to introduce family physicians to the two main emerging technologies in cardiac imaging: computed tomography coronary angiography (CTCA) to evaluate chest symptoms consistent with ischaemia and exclude coronary artery disease; and cardiovascular magnetic resonance (CMR) imaging for evaluating cardiac morphology, function and presence of scar. These modalities are now in routine clinical practice for cardiologists in Australia and New Zealand. We provide a practical summary of the indications, clinical utility and limitations of these modern techniques to help familiarise clinicians with the use of these modalities in day-to-day practice. The clinical vignettes presented are cases that may be encountered in clinical practice. We searched the PubMed database to identify original papers and review articles from 2008 to 2016, as well as specialist society publications and guidelines (Society of Cardiovascular Computed Tomography, Society for Cardiovascular Magnetic Resonance, Cardiac Society of Australia and New Zealand, and Australian and New Zealand Working Group for Cardiovascular Magnetic Resonance), to formulate an evidence-based overview of new cardiac imaging techniques, as applied to clinical practice.
Part 1: Computed tomography coronary angiography for clinicians
CTCA is a non-invasive coronary angiogram, using electrocardiogram (ECG)-gated CT. The accuracy of CTCA has been well established in three large multicentre studies, with a negative predictive value approaching 100%, making it an excellent “rule out” test.1 This means that a normal CTCA showing no coronary plaque or stenosis accurately correlates to absence of disease on invasive angiography. Prognostic data have shown that a negative CTCA has very low event rate (< 1%), whereas increasing levels of disease seen on CTCA are associated with increasing risk of myocardial infarction and death over 5 years for both men and women.2
CTCA has been formally tested in randomised trials of chest pain in the emergency department, showing more rapid discharge and decreased health care costs, including in the Australian health system.3,4
The radiation dose for CTCA has decreased dramatically in recent years, with current generation scanners able to image the entire heart and coronary arteries for 2–3 mSv (equivalent to annual background radiation), and < 1 mSv in appropriate patients (similar to a mammogram). Thus, CTCA is gaining traction in clinical practice to rule out coronary artery disease (CAD) in a variety of clinical situations.
The primary use for CTCA is to exclude significant coronary artery stenosis in patients with symptoms consistent with coronary ischaemia due to potential stenotic CAD (harnessing the near 100% negative predictive value of CTCA). Application of the test in this manner is appropriate for patients with chest pain syndromes, with angina equivalent symptoms (eg, dyspnoea), to exclude graft stenosis in symptomatic patients after coronary artery bypass surgery, and also for patients with ongoing symptoms despite negative results from functional tests such as nuclear or echocardiography stress tests (as functional tests may return false-negative results). The Society of Cardiovascular Computed Tomography has published Appropriate Use Criteria,5 and the Cardiac Society of Australia and New Zealand has produced guidelines on non-invasive coronary imaging (Box 1).6
Clinical vignette 1: A 55-year-old woman presents to her general practitioner with dyspnoea on exertion, and risk factors of obesity and hypertension. A nuclear single-photon emission computed tomography myocardial perfusion scan is reported as positive for “mild apical ischaemia”. Computed tomography coronary angiography (CTCA) is performed to exclude significant coronary artery disease, demonstrating no significant stenosis in the major epicardial coronaries (left anterior descending, left circumflex or right coronary artery), but mild diffuse coronary atherosclerosis is present (with a calcium score of 370 Agatston units). She is commenced on medical therapy of aspirin and a statin, and is reassured that she does not have a stenosis requiring stent or bypass surgery, and that her chest symptoms are not due to coronary artery disease.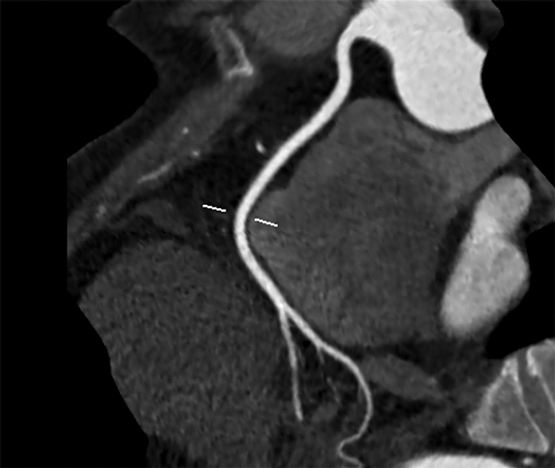
CTCA showing “clean” coronary arteries with no plaque or stenosis.
In Australia, Medicare reimbursement is available via specialist referral for three indications:
-
chest symptoms consistent with coronary ischaemia in low to intermediate risk patients;
-
evaluation of suspected coronary anomaly or fistula; or;
-
exclusion of CAD before heart transplant or valve surgery (non-coronary cardiac surgery).
Medicare-reimbursed indications do not cover asymptomatic patients with a strong family history of coronary artery disease (in which case, a coronary calcium score may suffice).7 When used appropriately, CTCA reduces the need for invasive coronary angiography, which is about five times more expensive, as a consequence of the reduced need for hospital admissions and different Medicare Benefits Schedule charges. Data suggest that use of CTCA is cost-effective and reduces downstream testing.8
Importantly, CTCA is not appropriate in patients with typical angina (defined as “constricting discomfort in the chest, which is precipitated by physical exertion, and relieved by rest or GTN”9) who have a high pre-test probability of obstructive disease and should proceed directly to invasive coronary angiography.
Evaluation after coronary artery stenting is limited to large diameter stents (> 3 mm) in proximal arteries and, in general, functional testing remains the clinical standard for reassessment of patients with known CAD.5 Conversely, assessment of graft patency following coronary artery bypass surgery can be well assessed by CTCA, without the risks of stroke or graft dissection from invasive engagement of the grafts during catheter angiography.5
The main weakness of CTCA is its modest positive predictive value, which varies from 60% to 90% depending on the prevalence of disease and the study. In clinical practice, this generally means that although coronary disease seen on CTCA is real, the percentage of stenosis generally appears more severe on CTCA compared with invasive coronary angiography. On the other hand, CTCA can visualise eccentric coronary plaques with positive vessel wall remodelling, which may be missed on invasive angiography (which only images the coronary lumen, and not the vessel wall itself).
An important factor in CTCA is heart rate control, which remains essential for good quality CTCA imaging. Ideal heart rates are in the 50–60 beats per minute range for optimal imaging, requiring pre-medication with β-blockers and/or ivabradine. Heart rate control is proportional to radiation dose, therefore low dose studies require a slow and steady heart rate. This improves the diagnostic accuracy of CTCA, but negative chronotropic medications may not be suitable for all patient groups, and atrial fibrillation remains a challenge. Newer high resolution and dual source scanners are able to image at higher heart rates, with algorithms to reconstruct cardiac motion, and are becoming more widely available.
Clinical vignette 2: A 38-year-old man presents to an emergency department with atypical central chest pain. Serial troponins are negative, and a 12-lead electrocardiogram shows non-specific T wave changes. He has ongoing pain, is not deemed suitable for an “accelerated diagnostic protocol” pathway, and early computed tomography coronary angiography (CTCA) is performed after 100 mg oral metoprolol with 10 mg ivabradine, to achieve a heart rate of 59 beats per minute, allowing a low dose (< 1 mSv) scan. CTCA shows a normal left coronary system, but an anomalous right coronary artery origin arising from the contralateral cusp, with an interarterial course and a slit-like origin.6 This is a potentially life-threatening anomaly due to potential compression between the aorta and pulmonary artery resulting in sudden death;10 however, this may not have been diagnosed on functional testing (eg, single-photon emission computed tomography). Cardiac CT is the reference test for the assessment of coronary anomalies and coronary fistulae.6
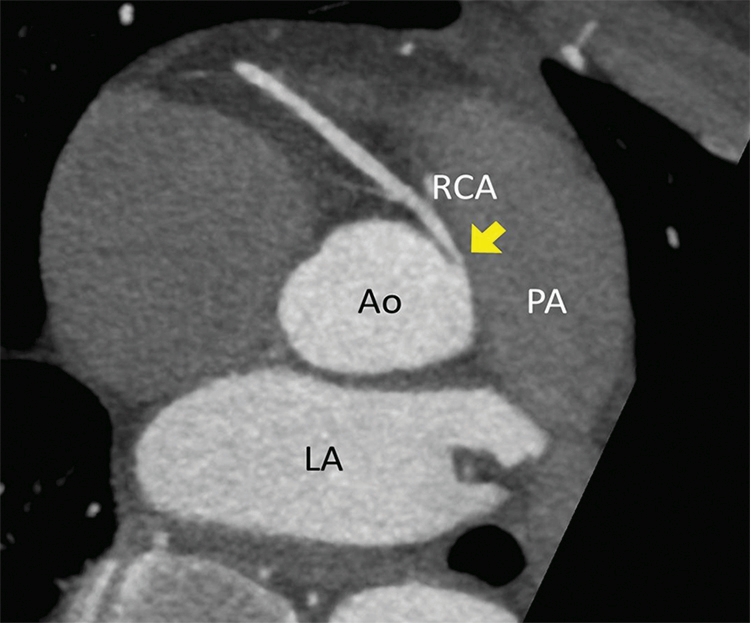
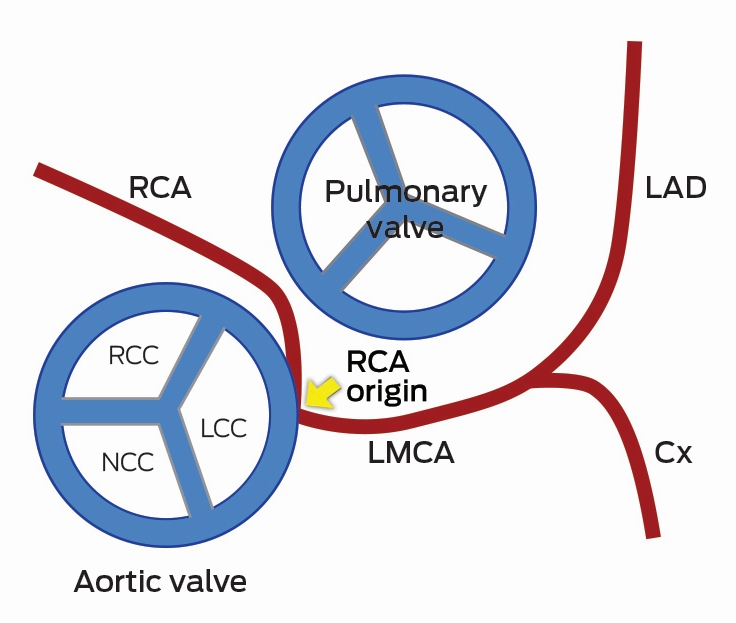
CTCA axial view showing the RCA origin adjacent to the left main sinus and with an interarterial course between the aorta and pulmonary artery (arrow). Ao = aorta. Cx = circumflex. LA = left atrium. LAD = left anterior descending artery. LCC = left coronary cusp. LMCA = left main coronary artery. NCC = non-coronary cusp. PA = pulmonary artery. RCA = right coronary artery. RCC = right coronary cusp.
Recent data from the PROMISE trial in 10 000 patients showed equivalence of a CTCA versus functional testing strategy in symptomatic patients, but with a reduced rate of “normal” invasive angiograms and decreased downstream testing in the CTCA group.11 Further, the SCOT-HEART trial recently demonstrated that adding CTCA to standard care reduced the need for additional stress testing, and was associated with a 38% reduction in fatal and non-fatal myocardial infarction.12
Future directions for CTCA
Rapid technological advancement in both CT hardware and post-processing reconstruction software algorithms are leading to further improvements in spatial and temporal resolution while minimising radiation exposure. CTCA has the ability to detect high risk vulnerable plaques,6,13 and statin therapy may help alter the natural history of atherosclerosis as imaged by CTCA.13 New developments enable functional assessment of a lesion on CTCA, allowing assessment of lesion-specific ischaemia at the same time as evaluating coronary anatomy. Adenosine stress perfusion cardiac CT allows functional assessment of myocardial perfusion in a similar manner to nuclear single-photon emission computed tomography (SPECT), and can be performed at the same time as CTCA with minimal additional radiation.14 Fractional flow reserve can be derived from static CTCA datasets, using computational fluid dynamics, and has been compared favourably with invasive haemodynamic assessment of fractional flow reserve during invasive coronary angiography.15 Overall, CTCA is a very useful tool to non-invasively assess the coronary arteries, with prognostic data now available to support its routine use in clinical practice.
Part 2: Cardiovascular magnetic resonance imaging for clinicians
CMR is a specialised form of magnetic resonance imaging (MRI), which employs specific MRI techniques with ECG gating to capture high resolution images of the heart and cardiac motion, in any imaging plane, without radiation.16 CMR is like a “super-echocardiogram” to assess heart function, but has the additional ability to quantitate vascular flow, myocardial oedema, cardiac perfusion, viability, and the presence of infiltrate or scar using gadolinium-based contrast agents. CMR improves diagnosis and risk stratification, predicts prognosis, and guides treatment decisions in many cardiac disorders.
Left and right ventricular function
Accurate quantitation of left and right ventricular function are essential to making decisions in clinical medicine, from commencement of drug therapy to implantation of costly devices such as automatic defibrillators. CMR is the gold standard for measurements of left ventricular mass, volume and ejection fraction and assessing the presence of regional wall motion abnormalities,17,18 and it is more reproducible than echocardiography.19
CMR offers particular advantages for conditions affecting the right ventricle, which is particularly difficult to assess using echocardiography. Assessment of right ventricular volume and wall motion by CMR are assigned as major criteria in the diagnosis of arrythmogenic right ventricular dysplasia/cardiomyopathy (ARVD/C), a genetic condition resulting in arrhythmias and sudden death.20 Right ventricular function is important in patients in pulmonary hypertension and with adult congenital heart disease,21 for which CMR is critical to decision making (eg, timing of surgery, replacement of cardiac valves). In patients with dilated right hearts, CMR is useful to detect the underlying causes, which may not be apparent on echocardiography (such as partial anomalous pulmonary venous drainage, or ARVD/C).
Viability and scar imaging
CMR can be used to confirm the diagnosis of myocardial infarction and assess viability before stenting or coronary artery bypass surgery, using gadolinium contrast agents to image scar tissue.
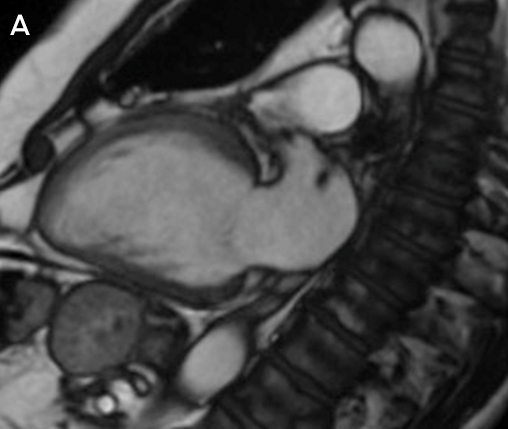
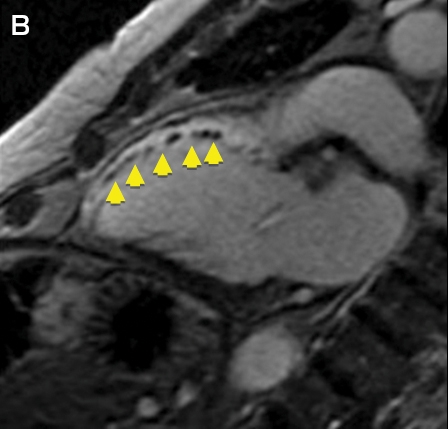
Clinical vignette 3: A 74-year-old man with a late-presentation ST-elevation myocardial infarction is shown to have an occluded left anterior descending artery during coronary angiography. Echocardiography shows an ejection fraction of 40%. Cardiovascular magnetic resonance (CMR) demonstrates that the anterior wall is akinetic, with full thickness infarction and no residual viable myocardium. Based on this information, he does not undergo stenting or coronary artery bypass graft surgery and is treated medically with heart failure therapy.
CMR imaging: two-chamber view showing a dilated left ventricle with akinetic anterior wall (A), and post-contrast imaging showing full thickness infarction of the entire anterior wall with no residual viable myocardium (B, arrows).
Infiltrative disorders traditionally requiring cardiac biopsy
CMR is a useful tool to diagnose infiltrative disorders which have traditionally required invasive cardiac biopsy, such as cardiac sarcoidosis, cardiac amyloidosis, and detection of fibrosis in hypertrophic cardiomyopathy.22–25 The EuroCMR registry of over 27 000 patients showed that using CMR improves diagnosis and changes clinical management in patients with cardiac conditions.26 Common indications and contraindications for CMR are shown in Box 2.27
Clinical vignette 4: A 26-year-old woman with palpitations has an echocardiogram showing a dilated right heart but with intact atrial and ventricular septum; the cause for right heart dilation was unclear. CMR showed a right ventricular volume index of 143 mL/m2 (moderate to severely dilated), and confirmed a diagnosis of partial anomalous pulmonary venous drainage of the right veins to the superior vena cava (significant intracardiac shunt: Qp:Qs, 2:1). She underwent minimally invasive cardiac surgical repair, with normalisation of right heart size at follow-up.
Myocardial fibrosis and iron overload
CMR is a “non-invasive microscope” of the heart, with techniques such as quantitative T1 mapping allowing non-invasive measurement of fibrosis and extracellular volume fraction.28 Cardiac iron overload occurs in haemochromatosis and thalassaemia, and is a significant cause of morbidity and mortality in these conditions.29 In the past, cardiac biopsy was the only means to assess myocardial iron overload. However, using iron-sensitive T2* imaging, CMR has been validated to quantitatively and non-invasively measure myocardial iron stores. Australian guidelines exist for using CMR to assess for iron overload, with T2* values of > 20 ms being normal, < 10–20 ms indicating moderate iron overload, and values of < 10 ms indicating severe iron overload warranting consideration for chelation therapy.29
Ventricular thrombus
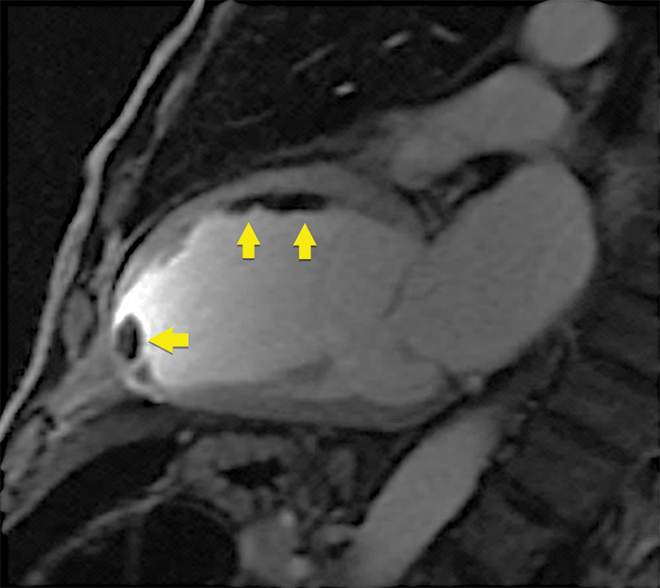
CMR is the gold standard test for detection of ventricular thrombus after myocardial infarction and is superior to echocardiography, including microsphere contrast echocardiography (Box 3).30
Valvular dysfunction
Quantitation of valvular regurgitation is more reproducible by CMR than by echocardiography,31 and is particularly useful in assessing aortic and pulmonary regurgitation, which are difficult to quantitate echocardiographically. CMR has been allocated a Class I indication for use in patients with moderate or severe valve disorders and suboptimal or equivocal echocardiographic evaluation (Class I, Level of evidence B).31,32 CMR is validated for the direct planimetric assessment of aortic stenosis, which can be performed using steady-state free precession cine imaging without requiring contrast (this may be useful for patients with renal impairment, such as those being assessed for transcatheter aortic valve implantation).33 CMR is also superior to echocardiography for the assessment of mitral regurgitation after percutaneous mitral valve repair.34 In clinical practice, CMR is useful when a valve lesion is of indeterminate or equivocal severity by echocardiography, when quality echocardiographic images are suboptimal (eg, due to limited acoustic windows), or when the “downstream effect” of a lesion needs further quantitation, such as left ventricular dilation in severe but asymptomatic valve regurgitation.
Stress perfusion CMR
Stress perfusion testing can be performed with CMR and has superior spatial resolution to nuclear SPECT imaging without the exposure to radiation. A large, prospective comparative efficacy trial recently demonstrated that stress perfusion CMR was superior to SPECT for the diagnosis of myocardial ischaemia.35 CMR can also provide information on viability (scar) and the coronary arteries in the same non-invasive test, making it a “one-stop shop” that is increasingly being adopted in Europe and the United Kingdom for stress imaging in cardiology practice.26
Limitations of CMR
The main limitation of CMR is availability, with the technique mainly confined to reference expert centres owing to its complexity and the degree of training required to perform and report CMR. Guidelines exist from the Society of Cardiovascular Magnetic Resonance on the performance and reporting of CMR, and specific Australian and New Zealand guidelines are currently being formulated. The second major limitation is the lack of specific Medicare reimbursement for CMR. At present, two applications are before the Medical Services Advisory Committee (MSAC): one for stress perfusion/viability imaging and one for assessment of cardiomyopathies in patients with abnormal baseline echocardiography (MSAC application 1393: http://www.msac.gov.au/internet/msac/publishing.nsf/Content/1393-public).
While CMR provides superior diagnostic information than echocardiography in virtually all cardiac disorders, it is more resource intensive, time consuming and currently less available than echocardiography. CMR should be targeted for patients in whom echocardiography is inconclusive or non-diagnostic, or in specific circumstances where CMR is more appropriate than echocardiography (such as complex congenital heart disease, or the use of stress perfusion when it is clinically appropriate to assess ventricular function, viability and ischaemia in a single test).
Relative contraindications are present in patients with arrhythmias that affect ECG gating, claustrophobia, implantable devices, and severe renal impairment (if contrast imaging is required). Most modern pacemaker systems are MRI conditional at a field strength of 1.5 T, but are not compatible with 3 T systems.
Conclusions
Cardiac imaging is a rapidly evolving field, with improvements in the diagnostic capabilities of non-invasive cardiac assessment. CTCA is useful to exclude coronary artery disease non-invasively. CMR is useful to accurately quantitate left ventricular and right ventricular function and investigate cardiomyopathies, or patients with congenital heart disease. CTCA and CMR and are becoming routine clinical practice for cardiologists in Australia and New Zealand, with increasing use in both hospital and outpatient settings. General practitioners and general physicians should be familiar with the basic indications, clinical utility and limitations of these modern techniques to assist in their appropriate use and interpretation in day-to-day practice.
Box 1 –
Appropriate indications for computed tomography coronary angiography endorsed by the Cardiac Society of Australia and New Zealand6
- Chest pain with low to intermediate pre-test probability of coronary artery disease (CAD)
- Chest pain with uninterpretable or equivocal stress test or imaging results
- Normal stress test results but continued or worsening symptoms
- Suspected coronary or great vessel anomalies
- Evaluation of coronary artery bypass grafts (with symptoms)
- Exclude coronary artery disease in new onset left bundle branch block or heart failure
Box 2 –
Common indications and contraindications for cardiovascular magnetic resonance imaging25
Common indications
- Myocardial viability (ischaemic cardiomyopathies)
- Accurate assessment of left ventricular ejection fraction; eg, before device implantation (implantable cardioverter defibrillator and cardiac resynchronisation therapy)
- Detection of interventricular thrombus
- Interstitial fibrosis (dilated and infiltrative cardiomyopathies)
- Congenital heart disease
- Cardiac mass
- Right ventricular quantification
- Evaluation for arrythmogenic right ventricular dysplasia/cardiomyopathy
- Post cardiac transplantation surveillance
- Constrictive pericarditis
- Quantification of valvular dysfunction
- Aortic and vascular measurement
- Iron overload quantification (T2*)
Contraindications
- Absolute
- Non-magnetic resonance compatible implantable devices
- Severe claustrophobia
- Relative
- Magnetic resonance imaging conditional pacemakers (only 1.5 T field strength)
- Arrythmias that affect electrocardiogram gating (atrial fibrillation and ectopy)
- Severe renal impairment (risk of nephrogenic systemic fibrosis)
Box 3 –
Early post-contrast cardiovascular magnetic resonance image showing multiple thrombi in the mid-anterior wall and left ventricular apex (arrows)