×

Never-ending intern and training crisis looms again

Hundreds of medical graduates and junior doctors face missing out on vital training places in the next two years without urgent investment by Federal, State and Territory governments, the AMA has warned.

As aspiring doctors and specialists scramble to secure internships, prevocational and vocational positions, the Association has urged governments to honour existing training funding commitments and lift their investment in specialist education if the country is to avoid a looming shortage of doctors.

Medical graduates in South Australia are facing uncertainty following indications the State Government is preparing to renege on its commitment to fund internships for all SA medical graduates.

The AMA has warned that, on current projections, 22 SA medical graduates will miss out on an internship in the State in 2017, rising to 39 in the following year.

Further along the training pipeline, the AMA has told a Health Department review of the Specialist Training Program (STP) that the number of places provided under the scheme will increasingly fall short of what the nation needs.

AMA President Professor Brian Owler said modelling by the former Health Workforce Australia indicated the nation was facing a shortfall of 569 first-year advanced specialist training places by 2018, increasing to 689 places in 2024 and 1011 places in 2030.

He warned this would have knock-on effects throughout the medical training pipeline, and there are concerns it could leave the nation short of the specialists it needs to meet future demand.

HWA predicted general practitioners, psychiatrists and anaesthetists, in particular, could be in short supply by 2030, and the problem will be especially acute in rural and regional areas.

Professor Owler said the Government should boost the size of its well-regarded STP program from 900 to 1400 places by 2018, and to 1900 places by 2030.

“We should now be trying to improve the distribution of the medical workforce and encouraging future medical graduates to train in the specialties where they will be needed to meet future community need for healthcare services,” he said.

Until now, much of the growth in training opportunities has been at the undergraduate level. In the past decade there has been a 150 per cent jump rapid expansion in the number of medical school places, and currently there are 3736 students enrolled nationwide.

But the AMA and the Australian Medical Students’ Association have warned that much of this investment will be wasted without a commensurate increase in intern, pre-vocational and specialist training places.

Modelling undertaken for the Australia’s Future Health Workforce identified an emerging mismatch between trainees and the number of vocational training places, with a shortfall of around 1000 places by 2030.

Professor Owler said this was particularly concerning because the pressure on intern places nationwide meant there was no guarantee that SA graduates unable to secure a place locally would be offered an internship interstate.

In its submission to the STP review, the AMA urged that the program be used to help address current and developing workforce shortages in particular specialties and regions.

It said the program could make an important contribution to relieving shortages in the specialist workforce in rural areas by increasing the priority given to providing training positions in rural and regional areas.

Already, 41 per cent of STP training positions are in rural Australia, but the AMA has argued this should be increased, in part by shifting away from the current emphasis on one-year placements to a structure that instead supports clear and co-ordinated pathways for trainees interested in pursuing rural careers.

It said STP funding could support the establishment of regional training networks – vertically integrated networks of health services and regional prevocational and specialist training hubs – which the AMA has proposed as a way of remedying chronic rural workforce issues by enhancing generalist and specialist training opportunities and supporting prevocational and vocational trainees to live and work in regional and rural areas.

“Medical training does not stop at the gates of the medical school,” Professor Owler said. “We have seen a massive investment in extra medical school places, which must not be allowed to go to waste.

“It is important that all governments look beyond the intern year. With medical workforce planning data showing shortfalls in specialist training places, we need investment across the medical training pipeline,” he said.

Adrian Rollins

Hand hospitals, GP over to the states: OECD

The states and territories would assume exclusive responsibility for hospitals and primary care while the Commonwealth would steer policy and funding and oversee quality and performance under a far-reaching shake-up of the health system proposed by an international review.

As the states warn of the devastating effects of Federal Government cutbacks to hospital spending, the Organisation for Economic Cooperation and Development has recommended an end to the complex and confusing split of responsibility for health care between the two levels of government.

In its annual Health Care Quality Review of Australia, the OECD said that although the nation’s health system achieves good health outcomes for the amount of funding it receives – the sixth longest life expectancy among rich countries with only average health expenditure – the country could do better if it simplified lines of responsibility and boosted the role of GPs.

“Australia achieves good health outcomes relatively efficiently, with health expenditure at 8.8 per cent of GDP, about the same as the OECD average,” the Review said. “[But] the health system features a complex split of federal and state and territory funding and responsibilities which can make it difficult for patients to navigate their way through.”

Under current fragmented and nonsensical arrangements, both levels of government carry responsibility for overseeing health care quality, the OECD found.

But, within this, states are given the lead role as hospital “system managers” while the Commonwealth retains prime responsibility for primary health care.

It said arrangements for supervising private care were just as labyrinthine, with the states carrying responsibility for licensing private hospitals while health funds were regulated by the Federal Government.

“Better rationalised responsibilities, by making states and territories responsible for primary care, for example, would help ease some of the system’s complexity, as well as the tension that sometimes exists between the two levels of government,” the review said.

Related: Public hospitals stretched by rising demand

For decades the nation’s public hospitals have been caught up in outbreaks of the “blame game” between the Commonwealth and the –states over funding, and medical students battling for limited intern places are the latest victims of the blurred lines of responsibility.

The OECD said the states should assume responsibility for hospitals and primary health, leaving the Commonwealth to oversee quality and performance.

The OECD said it made sense for the Federal Government to play the lead role in steering health policy and overseeing quality and performance, noting the work of agencies like the Australian Commission on Safety and Quality in Health Care and the Independent Hospital Pricing Authority.

It said Australia also stood out among its peers for having a consolidated national registration scheme for practitioners.

“Greater harmonisation of quality monitoring and improvement approaches would make the states more comparable, providing opportunities for health services to be benchmarked against a larger pool of peers, and to draw lessons that could help improve health care quality,” the OECD said.

The Organisation said quality could be further enhanced by strengthening primary health care, particularly given the growing number of patients with chronic health problems.

It said an “unusual division” had developed between primary care and community health, adding to the fragmentation of the system, while the slow adoption of e-health made it difficult to coordinate care among different providers.

The OECD also took aim at fee-for-service payment model, which it said did little to promote the integration of care, and decried that the Practice Incentive Program, as a pay-for-performance scheme, remained largely under-developed.

“[It] consists of few incentives that are tied to quality and patient outcomes,” the Organisation said, and expressed surprise at the lack of data collected on primary health care quality and outcomes: “[this] provides general practitioners with very limited opportunity to compare their performance with that of their peers”.

Adrian Rollins

Latest news:

Australian hospital peer groups

This report presents the AIHW’s revised peer grouping for Australian public and private hospitals (updating the original peer grouping for public hospitals developed in 1999). The new peer groups are: defined by the type and nature of the hospital services provided; based on data from a broad range of sources; intended to be multi-purpose and stable over time.

Do teleoncology models of care enable safe delivery of chemotherapy in rural towns?

Even in developed nations, cancer survival rates among patients from rural regions are often inferior to those of their urban counterparts.13 In Australia, these problems are further compounded by the poorer outcomes for Indigenous patients compared with non-Indigenous patients.4 Reasons that have been proposed to explain this disparity include the differential access of rural and urban patients to various cancer screening and treatment programs.5 Achieving timely and equitable access to cancer care services for all patients remains a significant challenge, especially in large countries with geographically dispersed populations, such as Australia.

When compared with their urban counterparts, rural patients in New South Wales have different rates of prostatectomy and orchiectomy for prostate cancer,6 undergo less breast-conserving surgery for breast cancer,7 and have a lower probability of completing radiotherapy for rectal cancer.8 Overseas studies have also reported that the uptake of chemotherapy may be lower for patients from rural areas; for example, patients with colorectal cancer living in disadvantaged areas of Scotland were less likely to receive chemotherapy.9 A Canadian study by the British Columbia Cancer Agency similarly reported that patients from rural areas were less likely to receive adjuvant chemotherapy for rectal cancer than those from larger urban centres.10

There are many possible explanations for the differing rates of chemotherapy in rural and urban populations. These include the limited access to chemotherapy closer to home5 and clinicians being concerned about the potential toxicity of chemotherapy. To explore the latter possibility, the Townsville Cancer Centre (TCC) conducted a study of patients with breast and colon cancer in northern Queensland.11 Its findings suggested that rural patients with these cancers could be treated safely with the same doses and dose intensity as their urban counterparts; further, complications of treatment could be managed at rural centres, with supervision and partnership shared by rural and urban clinicians.11

A possible solution that would provide timely access to chemotherapy closer to home and improve the uptake of chemotherapy by rural and remote patients would be to administer chemotherapy in rural centres, with medical oncology support and supervision provided through teleoncology (telehealth for cancer care). Similar to cancer centres in Kansas (United States) and Kelowna (Canada),12,13 medical oncologists from our centre, the TCC, supervise the delivery of chemotherapy agents in Mount Isa (a large rural town 900 km from Townsville) using the Townsville teleoncology model that operates under the auspices of the Townsville Teleoncology Network (TTN).14,15 Patients in Mount Isa are able to receive almost all types of solid tumour chemotherapy. Within the TTN, medical oncologists are able to assess rural patients for fitness to undergo chemotherapy and to use video-conferencing to make decisions about admitted inpatients. This assessment is supported by rurally based doctors and nurses during telehealth consultations. Chemotherapy-proficient nurses administer chemotherapy agents prescribed by TCC-based medical oncologists.

Although this model has been shown to be accepted by both patients and health professionals,16 and facilitates timely provision of medical oncology services in rural towns,17 it is not known whether the safety and quality of treatment received by Mount Isa patients (as indicated by dose intensity and toxicity profile) are comparable with those for Townsville patients. The aim of this study was therefore to determine whether there were any differences between the quality and safety of chemotherapy received by patients treated in person at the TCC and those treated at the Mount Isa Hospital by the same oncologists via teleoncology.

Methods

Data collection

Retrospective chart audits were conducted at both the Mount Isa Hospital and the TCC for patients who received chemotherapy. The data collected included:

  • demographic details, including age, sex and cancer type;

  • types of chemotherapy regimen, dose intensity (actual and planned doses) and number of treatment cycles;

  • intent of treatment: curative (chemotherapy was the primary therapy or an adjunct to surgery that aimed to cure cancer) or palliative (chemotherapy that aimed to prolong survival and to improve or maintain quality of life); and

  • rates of severe side effects (grade 3 and 4 toxicities according to National Cancer Institute Common Toxicity Criteria [NCI CTC], version 4)18 and of admissions to inpatient facilities linked with the side effects of cancer therapy.

Patient selection

The Mount Isa audit included all chemotherapy administered from the inception of the Townsville teleoncology model of care from 1 May 2007 until 30 April 2012. The TCC audit was conducted during two separate 3-month periods: March – May 2009 and June – August 2010. These two periods were chosen for two reasons. First, from 2010 many patients were enrolled in clinical trials at the TCC, a tertiary centre, and these trials were not available at Mount Isa; including these TCC patients would make comparing the data difficult. Second, referral patterns at the TCC fluctuate during major holiday seasons according to the availability of surgical theatres; the end-of-year holiday period was excluded from our study because of the unusual patient profile at the TCC at this time of year. The two unrelated time periods for data collection were thus selected to avoid tumour selection bias in the study population. As Mount Isa does not have radiotherapy facilities, patients undergoing chemoradiotherapy at the TCC were also excluded from the study.

We also attempted to match the sample population for patient comorbidities, but chart data on minor comorbidities tend to be incomplete. It was therefore assumed that both patient populations were fit for chemotherapy, based on the usual practice that patients with severe comorbidities and poor performance status would not be offered chemotherapy.

Statistical analysis

The SPSS program (IBM) was used for all analyses. Between-group differences for categorical variables were analysed with χ2 tests; where the expected cell count was less than 5, the Fisher exact test was instead used. Between-group differences for numerical variables were analysed with t tests; where data were not normally distributed or the sample size for each group was less than 30, Mann–Whitney U tests were used instead. Statistical significance was defined as P < 0.05. Sample size calculations indicated that a total of about 160 participants was required to detect a between-group difference of 20% in the rate of side effects, assuming a base side effect rate of 10% (previously determined at Townsville Hospital), with 90% power and α = 0.05.

Ethics approval

This study received ethics approval from the human research ethics committees of the Townsville Health and Hospital Services (HREC/12/QTHS/29) and the James Cook University (H4602).

Results

During the period May 2007 – April 2012, a total of 89 patients received chemotherapy at Mount Isa Hospital under the supervision of TCC medical oncologists through the teleoncology model. The comparison group included 117 eligible patients from Townsville. Demographic details are summarised in Box 1. The three most common cancer types were breast, colorectal and lung cancers, although most solid tumour types were treated at both sites. There were no significant differences in the characteristics of the patients at the two sites with respect to sex, age, cancer types or treatment intent (P > 0.05 for each comparison). However, significantly more Indigenous patients were treated at Mount Isa than in Townsville (χ2 [1] = 11.66, P < 0.001).

Chemotherapy doses and side effects

A total of 626 and 799 cycles were respectively administered at the Mount Isa and Townsville hospitals. All chemotherapy regimen types (lines) used in Townsville were also available to patients in Mount Isa, but as the number of patients receiving each regimen type was small, no comparison between Mount Isa and Townsville was attempted in this regard. Data on the chemotherapy cycles and toxicity rates are summarised in Box 2 and Box 3; the side effect profiles at the two hospitals are summarised in Box 4.

No statistically significant differences between the hospitals were observed with regard to the numbers of treatment cycles, of cycles per line, of lines per patient, of side effects, or of hospital admissions (P > 0.05 for each comparison). Although neutropenia was reported more frequently in Mount Isa, this did not cause more hospital admissions or dose delays. There were no deaths in either group caused by toxicity. Further, there were no statistically significant differences in dose intensities between sites, regardless of treatment intent. Due to the higher proportion of Indigenous patients in Mount Isa, the analysis comparing sites was stratified by Indigenous status; no site differences in any parameters related to dose intensities and rates of serious adverse events were detected after this stratification.

Discussion

Teleoncology models enable many types of chemotherapy to be administered in a timely manner closer to home for rural patients, with close supervision by medical oncologists from urban centres.14,17 This model of remote chemotherapy supervision has been shown (a) to reduce the need for rural patients to travel long distances; (b) to be accepted by both patients and health professionals; and (c) to reduce health care system expenses.12,19 However, it is also imperative to ensure that safety is not compromised, and that the quality of care provided through these models is of at least the same standard as that experienced by patients receiving their care from oncologists in person.

It had previously been reported that thrombolysis could be safely and effectively performed on stroke patients at remote centres using telehealth techniques.20 Our study has shown that, in comparable populations, there were no statistical differences in safety parameters between an urban, traditional model of care and a rural teleoncology model. Similar numbers of treatment cycles and lines and dose intensities indicate that the administration of therapy was comparable for the rural and urban patient groups. Although the Mount Isa group included a greater number of Indigenous patients, it did not affect our results, as chemotherapy treatment decisions are based on medical comorbidities and not on ethnic background.

Our study is the first to show that many types of chemotherapy can be administered in rural centres, without compromising safety and quality, by teleoncology models of care. These results, together with those of an earlier study that compared the safety of chemotherapy for rural and urban patients with breast or colon cancer,11 may reassure many urban clinicians that high-quality cancer care can be provided at rural centres by teleoncology models. It is important to note, however, that these models require appropriate governance, and that adequate health care system resources be directed to rural centres.

Within the TTN, the quality of care provided through teleoncology is closely related to the adequacy of the rural workforce and strict governance of chemotherapy management.15 Workforce requirements and governance of chemotherapy administration are the same for all sites. Medical oncologists from the TCC provide their outpatient services regularly and on demand via video-conferencing, and are also able to review and make decisions for admitted inpatients.14 These are the same medical oncologists who provide face-to-face care in Townsville. TCC-based oncologists are supported by general physicians, nurses, allied health professionals and pharmacists in the rural centres. These multidisciplinary services undertake initial consultations, monitoring and management of toxicity in ambulatory care, and inpatient settings and follow-up until the completion of a treatment program or referral to palliative services for end-of-life care. As part of this network and throughout our study, the Mount Isa Hospital was adequately resourced to provide services locally through a teleoncology model of care.15 As the scope of practice broadened and the complexity of cases increased over time, clinicians successfully lobbied for increased resources for Mount Isa to expand its rural service capabilities. The results of our study should therefore be applied with caution to centres with more limited resources.

Our study was designed to detect differences in toxicity profiles and dose intensities for treatment delivered by teleoncology (Mount Isa) or in person (Townsville). None were detected. However, further research is required with larger sample sizes to assess the statistical equivalence of these treatment modalities. Although our study was statistically powered for the analysis of differences in dose intensities associated with teleoncology and face-to-face models of care at the two hospitals, comparisons for individual tumour types would not be meaningful because of the small patient numbers for each tumour type. Selecting a matched patient sample at the TCC was considered, but it was difficult to compile a complete history of patient comorbidities because of the retrospective nature of the audit and the incomplete chart data. In reality, however, patients with severe comorbidities would not have received chemotherapy at either hospital, and lack of matching probably had only a minimal impact on the outcomes of our study.

As our data were not collected prospectively, it is possible that some adverse effects and other relevant data, including quality-of-life information, were not recorded and captured by the audit. However, serious adverse effects (NCI CTC grades 3 and 4) usually result in admission to hospital, and this would have been captured by admission records. In addition, any omission or delays in chemotherapy are likely to be documented in patient charts.

In conclusion, our results, together with those of telestroke studies and our earlier rural chemotherapy study,11 provide initial reassurance that high-quality and safe cancer care, including a variety of complex medical therapies, can be provided to rural patients closer to their homes by teleoncology and other telehealth models of care. By expanding the scope of practice and capabilities of rural health care systems through the use of telehealth models, rural patients may gain access to chemotherapy and other complex medical therapies similar to that of urban patients. To ensure a high level of safety and quality, centres embarking on providing chemotherapy and complex medical therapies in rural areas using telehealth models need to ensure that rural resources are adequate and that governance arrangements are strict.

Box 1 –
Demographic characteristics of the patients treated in Mount Isa and Townsville

Mount Isa

Townsville


Number of patients

89

117

Sex

Male

43 (48%)

60 (51.3%)

Female

46 (52%)

57 (48.7%)

Ethnicity*

Indigenous

20 (22%)

7 (6.0%)

Non-Indigenous

69 (77%)

109 (94.0%)

Age, years (median, range)

58 (18–82)

59 (20–86)

Treatment intent

Curative/adjuvant

34 (38%)

56 (47.9%)

Palliative

55 (62%)

61 (52.1%)

Cancer type

Breast

24 (27%)

33 (28.2%)

Colon

10 (11%)

12 (10.3%)

Lung

21 (24%)

22 (18.8%)

Prostate

1 (1.1%)

2 (1.7%)

Rectal

7 (7.9%)

2 (1.7%)

Oesophagus/gastric

4 (4.5%)

2 (1.7%)

Neuroendocrine/gastrointestinal stromal tumour

1 (1.1%)

1 (0.9%)

Head/neck

0

2 (1.7%)

Other

21 (24%)

41 (35.0%)


*Indigenous v non-Indigenous: P < 0.001; there were no other statistically significant differences.

Box 2 –
Chemotherapy doses and toxicity rates, by site

Mount Isa

Townsville


Number of patients

89

117

Cycles per line (mean ± SD)

5.38 ± 3.84

5.07 ± 4.80

Total number of cycles

626

799

Number of treatment lines (mean ± SD)

1.30 ± 0.65

1.36 ± 0.66

Rate of serious side effects (per patient)

4.4%

9.5%

Inpatient hospital admissions

Total number

30

50

Proportion of patients

28%

35.3%


P > 0.05 for all between-group comparisons.

Box 3 –
Chemotherapy doses and rates of side effects, by treatment intent and hospital

Palliative (116 patients)


Curative/adjuvant (90 patients)


Mount Isa

Townsville

Mount Isa

Townsville


Number of patients

55

61

34

56

Cycles per line (mean ± SD)

4.37 ± 2.41

4.47 ± 5.20

7.0 ± 5.02

5.70 ± 4.29

Number of lines (mean ± SD)

1.44 ± 0.76

1.45 ± 0.75

1.08 ± 0.29

1.27 ± 0.55

Total number of cycles

367

388

259

411

Rate of serious side effects (per patient)

5.4%

15%

2.9%

3.6%

Hospital admissions

Total number

24

33

6

17

Proportion of patients

36%

43%

15%

27%

Dose intensity, percentage* (mean ± SD)

97.4 ± 24.0

98.2 ± 16.1

84.4 ± 25.9

88.1 ± 25.9


* Actual dose, compared with planned dose. P > 0.05 for all between-group comparisons.

Box 4 –
Side effect profiles (National Cancer Institute Common Toxicity Criteria, grade 3 and 4 toxicity) for patients treated at Mount Isa and Townsville hospitals

Overall (206 patients)


Palliative (116 patients)


Curative (90 patients)


Mount Isa

Townsville

Mount Isa

Townsville

Mount Isa

Townsville


Neutropenia*

29%

18%

21%

23%

34%

13%

Nausea and vomiting

0

1.7%

0

0

0

3.3%

Diarrhoea

1.1%

6.9%

0

12%

1.8%

1.7%

Neuropathy

3.3%

1.7%

8.8%

0

0

3.3%

Fatigue

0

4.3%

0

1.8%

0

6.7%

Other

16%

26%

8.8%

21%

16%

30%


*More neutropenia was reported in Mount Isa, but this did not result in more hospital admissions.

Life expectancy discussions in a multisite sample of Australian medical oncology outpatients

Why provide life expectancy information? An integral part of patient-centred cancer care is ensuring that information, communication and education provided to patients meets their needs, preferences and values.1 Between 50% and 70% of patients with cancer want numerical estimates of their life expectancy.26 Assessing and responding to patient preferences about life expectancy information is therefore a necessary component of patient-centred care, and can assist patients in making informed and effective decisions about their care. Misperceptions of life expectancy by patients, however, can also influence aspects of care, such as decisions about continuing life-prolonging treatments that may diminish their quality of life.7,8

Discussing life expectancy is a complex task. Clinicians must 1) establish how much, and in what detail patients want to know; 2) offer timely information that facilitates decision making about treatment and informed consent; 3) provide information consistent with patient preferences; 4) communicate the limitations inherent to prognoses; 5) present information in formats that aid understanding; and 6) ensure that information is communicated sensitively.6,9 Self-reports by patients about their awareness and understanding of what they have been told about life expectancy arguably comprise the gold standard measure of quality in this area.10,11

Is there concordance between patient preferences and experiences of discussions of life expectancy? The proportion of patients with cancer who reportedly discuss life expectancy is variable. Using direct observation, one study found that 58% of incurable oncology patients were told about life expectancy.12 Lower rates of disclosure (27%–53%) have been reported in studies based on patient self-reports.6,13 While discrepancies between preferences and experiences regarding prognosis information have been reported,6,14 few studies have focused specifically on life expectancy information. One investigation found that 47% of patients who wanted life expectancy information did not receive it, and 4% had received information they did not want.5 The preferences of patients receiving radiation therapy for cancer in Australia regarding who should initiate life expectancy discussions (the patient or their doctor) and their actual experiences were not aligned in 40% of instances.13

Previous studies of this question have been limited by convenience samples or low response rates (24% in one study5), or by including only participants with a single cancer type from a single treatment centre.4 The degree to which these data can be generalised to all cancer patients is therefore questionable. The literature indicates that patients’ preferences and experiences of prognosis discussions may vary according to their age, sex, marital status, ethnic background, education, disease status, time since diagnosis, cancer type and psychological wellbeing.46,15,16 Given the emphasis on reducing disparities in health care,1 it is important to explore factors associated with misalignment of patient preferences and experiences, and to identify subgroups who are less likely to receive the desired information.

Our multisite study aimed to identify:

  • the proportion of patients who received their preferred level of life expectancy information; and

  • the sociodemographic, clinical and psychological factors associated with patients’ perceptions of receiving too little, too much, or the desired amount of life expectancy information.

Methods

Patient sample

Eligible medical oncology treatment centres were those providing care for at least 400 new cancer patients each year, and were nominated by state-based research representatives to reflect the relative distribution of public, private, metropolitan and regional hospitals across each of the six Australian states. Invitations were sent to the 51 nominated centres by representatives on behalf of the research team.

Eligible patients had a confirmed cancer diagnosis, were attending the clinic for their second or subsequent appointment (to ensure that patients had experienced cancer care at the centre before answering questions about this treatment), were at least 18 years old, and were able to read and understand English. They were judged by clinical staff to be physically and mentally able to give informed consent and to complete the survey.

Informed consent was obtained by a researcher or clinic staff member by consecutively approaching eligible patients while they waited for their outpatient appointments. To assess consent bias, those who withheld consent were asked to provide their age and sex (this was not done for consenters). Consenting patients were asked to complete a pen-and-paper survey, either in the clinic or at home. Non-responders were sent reminder letters 2–3 weeks and 5–6 weeks after recruitment.

The survey instrument

Development of the measure

Survey items (outcome and associate items) were distributed to a sample of consumer advocates for qualitative feedback on item comprehensibility and relevance. Items were then piloted with 324 patients, and then revised to improve their quality and acceptability. The revised survey (detailed below) was completed by the participants in our study.

Life expectancy item

Participants were asked “Which of the following best describes your experience of discussions with your cancer doctor(s) about how cancer may affect the length of your life (your life expectancy)?” A question stem and five response options were provided: “My cancer doctor(s) at this hospital has discussed or given me …”:

  1. More information than I wanted about my life expectancy;

  2. All the information that I wanted about my life expectancy;

  3. Some of the information that I wanted about my life expectancy;

  4. None of the information that I wanted about my life expectancy; or

  5. No information about life expectancy, but I haven’t wanted information.

Associate variables

All associate variables were obtained from patient self-reports. Sociodemographic items included sex, age, marital status, education (a proxy for socioeconomic status17), and ethnic background (for participants born outside Australia or who identified as being Aboriginal and/or Torres Strait Islander).

Clinical items included the patient’s most recent cancer type, stage of cancer at diagnosis, current remission status, time since diagnosis, and main reason for visit to the clinic on the day of recruitment.

Psychological wellbeing was measured with the Hospital Anxiety and Depression Scale (HADS), a 14-item survey with two subscales, anxiety and depression. Each item is rated on a four-point scale; scores range from 0 to 21 for each subscale. A mean cut-off score of 8 on each subscale optimises its sensitivity and specificity as a screening instrument.18

Statistical analysis

Stata/IC 11.1 (StataCorp) was used for all analyses. Consent bias (age, sex) was assessed with χ2 analyses. Frequency tables were calculated for each of the five life expectancy response options. A multinomial logistic regression, adjusted for clustering of results within centres by jacknife estimation, examined factors associated with the alignment of patient preference and experience. Key variables were selected a priori. Four preference–experience outcome categories were generated:

  • too much information (“More information than I wanted”);

  • too little information (“Some of the information I wanted” or “None of the information I wanted”);

  • no information wanted or received (“No information about life expectancy, but I haven’t wanted information”); and

  • received all the information wanted (“All the information that I wanted”).

The fourth category was the reference category. While the third and fourth categories both included patients whose preferences and experiences were aligned, the large sample size offered an opportunity to explore these groups separately. Odds ratios (ORs) with 95% confidence intervals and the results of adjusted Wald tests are reported.

Ethics approval

The University of Newcastle Human Research Ethics Committee and the ethics committees of the participating health services approved the study (ref. H-2010-1324).

Results

Of 51 medical oncology treatment centres that were approached, 14 consented to participate in the study (27% consent rate). Two consenting centres did not participate: one had an ethics process that was too expensive, and the other chose not to participate after consenting. Eleven of the participating treatment centres were public medical centres; nine were located in metropolitan and three in regional areas. At least one centre from each Australian state participated. Patients from 11 centres received the survey items on life expectancy during the recruitment period.

Patient sample

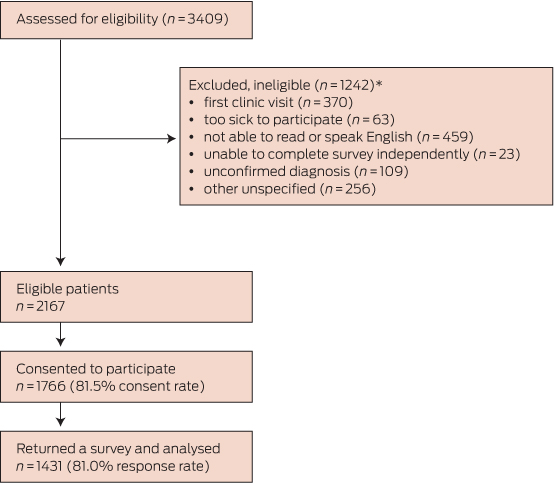
Of the 2167 eligible patients, 1431 returned a survey (Box 1). There were significant sex (χ2[1] = 12.3, P < 0.001; more women) and age differences (χ2[5] = 13.3, P = 0.02; more older patients) compared with those who withheld consent to participate. The age of those who initially consented but later did not respond could not be determined. Box 2 summarises the characteristics of the 1431 participants and the non-consenters.

Do patients receive their preferred level of information about life expectancy?

Of the 1431 responders, 1361 (95.1%) completed the life expectancy item of the survey. Responders did not differ from non-responders with respect to age (χ2[5] = 7.1, P = 0.21), sex (χ2[1] = 2.2, P = 0.14), treatment centre attended (χ2[10] = 13.8, P = 0.18), cancer type (χ2[4] = 4.4, P = 0.36) or remission status (χ2[2] = 0.2, P = 0.91), but participants who did not complete the item were less likely to have had advanced cancer at diagnosis (χ2[2] = 10.7, P = 0.005).

As summarised in Box 3, 72% of patients received the information that they desired; that is, 50% received all the information that they wanted, and 22% neither wanted nor received any information. A mismatch between preferences and experiences was reported by 388 patients (28%), of whom 24% reported not receiving enough information and 4% reported receiving too much.

After adjusting for clustering within treatment centres, no variation between institutions in the perception of life expectancy discussions was identified (post hoc χ2[10] = 35.9, P = 0.21).

What factors are associated with the alignment of preferences and experiences?

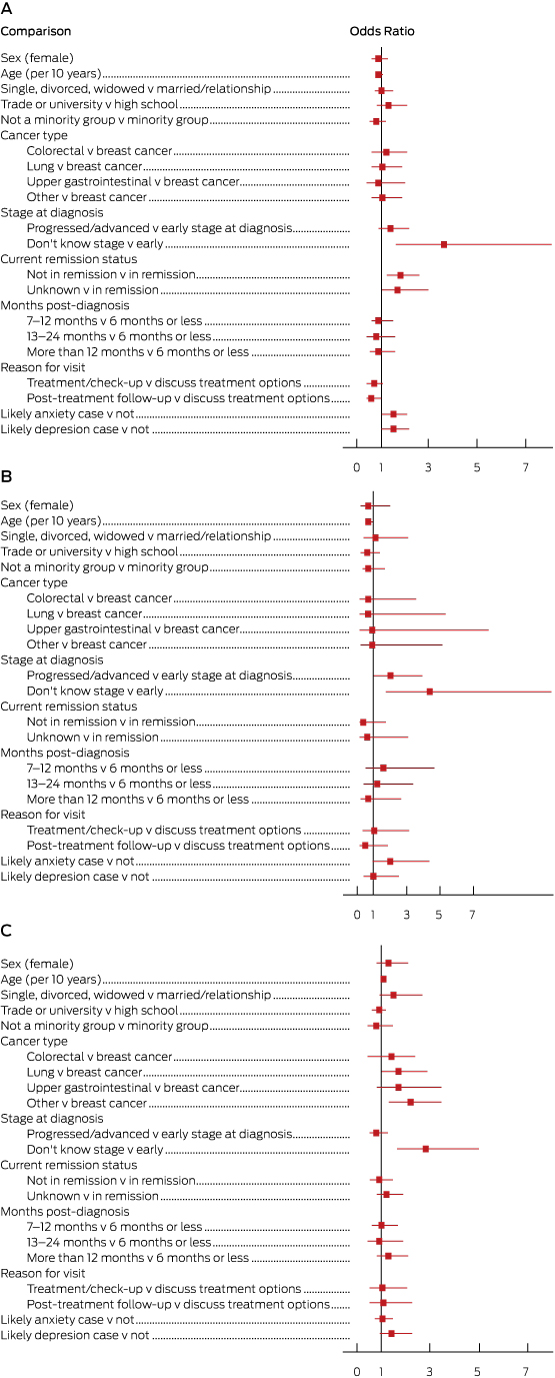
Box 4 and the Appendix present the results of our multinomial logistic regression. The reference group included those who received the desired amount of information about life expectancy. The odds of receiving too little information were greater for patients not in remission (OR, 1.8; 95% CI, 1.2–2.6), who did not know their cancer stage at diagnosis (OR, 3.6; 95% CI, 1.6–8.1), or who were likely to have anxiety (OR, 1.5; 95% CI, 1.0–2.1) or depression (OR, 1.5; 95% CI, 1.0–2.2). Younger patients (OR, 1.4; 95% CI, 1.0–2.0), those with a more progressed cancer (OR, 2.0; 95% CI, 1.0–4.0) or who did not know their stage at diagnosis (OR, 4.4; 95% CI, 1.7–11.8) were more likely to receive too much information. Older patients (OR, 1.1; 95% CI, 1.0–1.2) and those who did not know their stage at diagnosis (OR, 2.8; 95% CI, 1.6–5.0) were more likely to report that they neither wanted nor received information.

Discussion

Do patients receive their preferred level of information about life expectancy?

Almost three in four patients (72%) reported receiving the desired level of information about life expectancy: half of our sample (50%) reported receiving adequate levels of information, while 22% neither wanted nor received any information. This confirms previous findings that patients have different life expectancy information needs.25

The degree to which patients receive life expectancy information that aligns with their preferences has not improved dramatically.5 Discordant preference–experience outcomes most commonly involved patients receiving less information than they desired. Clinicians may avoid discussing prognosis and life expectancy in day-to-day practice because of uncertainty about the accuracy of estimates, a perceived lack of time, or concerns about their ability to deal with their patients’ emotions.6,19 Clinicians may wait for patients to request life expectancy information before providing it, or discuss it in ways that may be difficult for some patients to understand.5,6,19 Given that a minority of patients (4%) received more information about life expectancy than they wanted, and a substantial minority prefer to receive no information (22%), it is not appropriate to provide comprehensive information to all patients. Clinicians should take an individualised approach when providing life expectancy information.

Who gets too little information?

Patients not in remission were more likely to receive less life expectancy information than desired. As communicating a poor prognosis is complex, patients may not always understand such information in a manner that aids their decision making.11 As a consequence, clinicians should ensure they have the necessary skills to sensitively provide such information to patients who wish to be informed.20

Elevated anxiety and depression scores were associated with receiving too little information about life expectancy. Clinicians may withhold information from patients whom they perceive to be anxious or depressed, particularly if the prognosis is poor.10 On the other hand, receiving less information than desired may itself increase anxiety and depression.

Who gets too much information?

Patients who received too much life expectancy information were younger and reported having more advanced cancer at diagnosis. This finding may reflect assumptions by clinicians that younger patients will want life expectancy information. It may be especially important for those with a poor prognosis in order to guide decisions about treatment. Our findings may also indicate that clinicians assume that those with a poor prognosis want to receive this type of information.

Who neither wants nor receives information?

Consistent with the results of previous research, patients who neither wanted nor received life expectancy information were significantly more likely to be older.15,21,22 Older patients frequently report higher levels of satisfaction with cancer care.23 Younger patients are more likely to request and receive information about the prognosis,5,20 possibly reflecting increasing expectations of being involved in treatment decisions, and also the potential value of this information for assisting them regain some degree of control over their life plans.6

Stage of cancer at diagnosis unknown

One of the strongest and most consistent associate predictors was not knowing the stage of cancer at diagnosis (9% of sample). These patients had greater odds of reporting that they had received too little or too much information, or that they neither wanted nor received any information. This may reflect a general dissatisfaction with the providing of information, or that cancer diagnosis staging and prognosis was unknown to their doctors. Alternatively, it could reflect a generalised communication problem or the patient’s difficulty in understanding the clinical aspects of their diagnosis. Particular patient groups may need additional support to ensure their accurate understanding of clinical information.

Strengths and limitations of our study

While women were overrepresented and younger patients underrepresented in our sample, this multisite study is the largest and most representative to examine the research question. We are unable to determine whether cancer type profile and other clinical characteristics of the sample are representative of these parameters for the overall population of patients with cancer. While patient reports are the gold standard for assessing patient-centred care,1 they can be influenced by recall bias. Clinical characteristics were assessed by patient self-report, which may be less accurate than data obtained from medical or registry records. However, the clinical items in the survey were pilot-tested and structured to facilitate understanding by patients (lay terms, the use of examples) and to increase accuracy. The participants’ levels of health literacy, which is correlated with information-seeking behaviours and understanding provided information, were not measured, as the study aimed to assess the experiences and preferences of all patients who attended the treatment centres. The preferences of patients and their experiences may change over time as their circumstances change, so that future research should apply a longitudinal study design.

Clinical implications

To improve care delivery, health care teams should regularly collect patient feedback on the quality of care at both the patients’ and the institutional levels. Clinicians could ask patients whether they have received and understood the information about life expectancy provided to them. Enquiring about their information preferences should occur across several consultations to allow patients to process information and to formulate questions.9 At the institutional level, regular feedback about life expectancy information could be incorporated into patient experience surveys. As this study found, asking patients about this topic is practicable and acceptable, but current patient experience surveys do not routinely explore this aspect of care.

It might be expected that delivering information about life expectancy would be a matter of institutional policy. However, the lack of variation across centres suggests that these discussions are regulated by individual clinicians, rather than by policies or monitoring processes. To improve care for the 28% of patients whose preferences and experiences were not aligned, institution-wide policies and routine feedback should be considered.

Conclusions

Discussing life and death is emotional for patients, their families and their friends. That fact that 28% of cancer patients do not receive the level of information about life expectancy that they desire highlights the difficulties associated with discussing this sensitive topic. While not all patients want to receive detailed information, discordance was more often the result of patients wanting more rather than less information. The first step for clinicians should therefore be to ask whether the individual patient wants to know this information, in what format, and at what level of detail (eg, estimated life expectancy, cancer staging, prospects for cure, aim of cancer treatments). Australian consensus guidelines9 are available to assist clinicians in communicating information about life expectancy, including advice about using generic communication skills (eg, body language and active listening), and about clarifying the questions of patients and caregivers and addressing their information needs in an ongoing conversation over time. While the onus of responsibility remains with the clinician to ensure that life expectancy discussions occur in accordance with patient preferences, question prompt lists have been identified as helpful for enabling patients to obtain the information they desire.24

Box 1 –
Patient recruitment and data collection process


* Forty patients were ineligible for more than one reason.

Box 2 –
Sociodemographic and clinical characteristics of the study participants, and age and sex data for non-consenting patients

Study sample

Non-consenters


Total number

1431

401

Sex

Male

601 (42%)

200 (52%)

Female

828 (58%)

184 (48%)

Missing data

2

17

Age at diagnosis, years (mean ± SD)

62.5 ± 12.4

18–34 years

33 (2%)

16 (4%)

35–44 years

88 (6%)

17 (4%)

45–54 years

242 (18%)

57 (15%)

55–64 years

395 (29%)

120 (31%)

65–74 years

413 (30%)

100 (26%)

≥ 75 years

206 (15%)

76 (20%)

Missing data

54

15

Marital status

Married or in a relationship

906 (65%)

Single, divorced or widowed

489 (35%)

Missing data

36

Education

Primary school

97 (7%)

High school

600 (43%)

Trade or university

637 (46%)

Other

48 (3%)

Missing data

49

Minority group

Aboriginal and/or Torres Strait Islander

19 (1%)

Not born in Australia

438 (31%)

Neither

935 (67%)

Missing data

39

Cancer type

Breast

454 (33%)

Colorectal

236 (17%)

Lung

140 (10%)

Upper gastrointestinal

130 (9%)

Prostate

78 (6%)

Other urogenital

75 (5%)

Haematological

60 (4%)

Gynaecological

49 (4%)

Other

154 (11%)

Missing data

55

Stage of cancer at diagnosis

Early

818 (61%)

Advanced

408 (30%)

Don’t know

117 (9%)

Missing data

88

Current remission status

In remission

409 (30%)

Not in remission

559 (41%)

Don’t know

411 (30%)

Missing data

52

Months since cancer diagnosis

Less than 6 months

425 (30%)

6–12 months

260 (19%)

13–24 months

244 (17%)

More than 24 months

473 (34%)

Missing data

29

Reason for clinic visit

To discuss treatment options

117 (9%)

To receive treatment or check-up during treatment

801 (61%)

Post-treatment follow-up

405 (31%)

Missing data

108

Treatment received to date

Surgery

977 (70%)

Chemotherapy

113 (81%)

Radiotherapy

664 (51%)

Hormonal manipulation

312 (24%)

Biological therapies

146 (11%)

Treatment centre

A                        136 (10%)                        G

105 (7%)

B                         111 (8%)                         H

155 (11%)

C                        159 (11%)                        I

163 (11%)

D                        101 (7%)                         J

140 (10%)

E                         86 (6%)                          K

158 (11%)

F                        117 (8%)            


∗ Percentages in this table exclude missing data. † Patients may have received more than one treatment type.

Box 3 –
Concordance between patient preferences and experiences in discussions of life expectancy

Category

Response option

Number of patients

% (95% CI)


Too much information

More information than I wanted about my life expectancy

56

4% (3%–5%)

Too little information

332

24% (22%–27%)

Some of the information I wanted about my life expectancy

258

19%

None of the information I wanted about my life expectancy

74

5%

No information wanted nor received

No information about life expectancy, but I didn’t want information

298

22% (20%–24%)

The right amount of information

All the information that I wanted about my life expectancy

675

50% (47%–52%)


∗Data was missing for 70 patients (4.9%), so that sample size for this table is 1361 patients.

Box 4 –
Sociodemographic, clinical and psychological factors associated with level of life expectancy information received. A, Too little information received; B, Too much information received; C, Information neither wanted nor received


Odds ratios are shown with 95% confidence intervals; an odds ratio is significant at P < 0.05 if the 95% CI does not include the value of 1. Full data for these plots are included in the Appendix.

Indigenous health expenditure deficits obscured in Closing the Gap reports

Indigenous health expenditure trends are obscured amid myriad medical indicators and reports on Indigenous Australians’ health. The Australian Government’s Closing the Gap strategy seeks health equality for Indigenous and Torres Strait Islander peoples. However, neglecting the economics of the strategy perpetuates poor system performance as financial and resource constraints on individuals, and increasingly on the public health system, are ignored.

In contrast with Australian reporting, nearly a third of health system performance indicators of the World Health Organization’s 100 core health indicators (2015) relate to expenditure.1

Four interacting factors within Australia’s health system are potentially lethal for many Indigenous people:

  • Limited Indigenous-specific primary health care services;

  • Indigenous peoples’ underutilisation of many mainstream health services and limited access to government health subsidies;

  • Increasing price signals in the public health system and low Indigenous private health insurance rates;

  • Failure to maintain real expenditure levels over time.

Government expenditure is not commensurate with the substantially greater and more complex health needs of Indigenous Australians. It should be indexed to reflect these needs. While the average health expenditure per person for Indigenous Australians is 1.47 times that for non-Indigenous people, differences in indicators such as mortality and prevalence of disease are much greater.24 An expenditure index of (at least) two may appropriately reflect greater health needs.24

The “four A barriers” to Indigenous peoples’ access to mainstream primary health services — availability, affordability, (cultural) acceptability and appropriateness (to health need) — persist in all jurisdictions and geographical areas.24

Access to health services is recognised as critical to closing the gap.2,3 Not recognised are substantial fiscal losses from the Indigenous health sector arising from limited access to mainstream services. Ratios of Australian Government Indigenous and non-Indigenous health expenditure per person on major mainstream services are represented in the Box, with estimates of resulting fiscal losses from the Indigenous health sector.

Some major federal government health program expenditures are biased towards non-Indigenous people at the expense of other components of the health budget. For example, private health insurance accounts for nearly 10% of all federal government health expenditure: 55% of the population benefits from this, but at least 83% of Indigenous Australians do not.5

Increasing use of price signals, including copayments in the public health system and the Medicare Benefits Schedule price freeze (“copayments by stealth”), will further aggravate access barriers.2,3

Moreover, the government has failed to maintain Indigenous (real) health expenditures over time in line with population growth, distribution and greater health needs. Australian government health expenditure is expected to increase by 8% over the two years to 2015–16. The Indigenous proportion will fall by 2%, a cut of $88 million in real terms. As a result, the proportion of the health budget allocated to Indigenous health will shrink, from 1.18% in 2013–14 to 1.07% in 2015–16.2,57 Planned substantial reductions in federal government health payments to the states and territories may aggravate these losses.

There appears to be an increasing disconnect between government commitments to Closing the Gap and expenditure allocations. Solutions include aligning Indigenous health policy with commensurate funding, weighting expenditure to reflect greater health need, and redirecting more expenditure to Aboriginal community-controlled health services.2

Box –
Underutilisation of mainstream services and government health subsidies35


Ratios of Indigenous to non-Indigenous expenditure

Medicare Benefits Schedule (MBS)

0.67 : 1

Pharmaceutical Benefits Scheme (PBS)

0.80 : 1

Private health insurance

0.15 : 1

Resulting annual fiscal losses from Indigenous health (2014 estimates)

MBS

$192 million

PBS

$58 million

Private health insurance

$138 million


Climate change is harmful to our health: taking action will have many benefits

“Tackling climate change could be the greatest health opportunity of the 21st century” (The Lancet, 2015)

Humanity is at a critical juncture, where decisions made today will have a dramatic impact on our future. In late November 2015, world leaders will gather in Paris for the 21st Conference of the Parties of the United Nations Framework Convention on Climate Change (COP21). The aim of the meeting is to deliver a global agreement that will reduce carbon emissions, with the aim of limiting global warming to an increase of 2°C. A failure to do so will have far-reaching consequences for human health, in Australia and globally.

While the evidence for human-induced climate change is strong, and the current and projected effects of climate change are well described,1 calls to action often do not mention its health aspects. The Lancet Commission on Climate Change and Health has attempted to redress this omission with their second report, released in June 2015.2 This report summarises the health impacts of climate change and outlines the potential health benefits that would flow from reducing carbon emissions, such as those achieved by reducing particulate air pollution by decreasing fossil fuel combustion.2 The report concludes that “tackling climate change could be the greatest health opportunity of the 21st century”.2 This opportunity comes from maximising the direct health benefits of reducing carbon emissions, as well as from lessening the risk of human harm caused by catastrophic climate change.2 The report also makes a number of specific recommendations, including conducting further research into the impacts on human health of climate change.2

Changes in our climate have the potential to affect human health in many different ways, and some effects are amplified by other projected demographic and social changes, such as ageing populations and population growth increasing the demand on agricultural production.1,2 The consequences for human health include the effects of extreme heat and other climate-related events, such as floods, bushfires and more intense cyclones. The influence of heatwaves on morbidity and mortality is well documented.1,3 For example, the prolonged heatwave in south-eastern Australia during February 2009 was directly associated with an estimated 374 excess deaths in Victoria, more than double the 173 deaths linked with the “Black Saturday” bushfires that occurred during the heatwave.1,3,4 The immediate results of other extreme weather events are self-evident, but less apparent are the public health and mental health effects that can continue for some time after the event.5

The health consequences associated with the impact of climate change on natural, societal and economic systems will become progressively more important as global temperatures rise.2 A stable climate is important for agriculture, and threats to food security will be increasingly evident as a result of increasing temperatures.1,3 Food security does not just mean producing sufficient energy and protein for survival; the consumption of sufficient amounts of fruit, vegetables and whole grains is necessary for good health. Droughts and other climate events can affect the availability and cost of such foods, putting them out of reach for many people.6 The increasing cost of food relative to income also reduces the resources that are available for shelter, education and health services.

Water security is something that Australians know not to take for granted, and increasing drying trends, particularly as the result of more severe El Niño events, will further threaten water security in many parts of Australia. Both water availability and water quality are at risk.1,3 With sufficient resources, wealthy countries can respond to such problems with desalination plants, but these are unlikely to be available across Australia, so that people in rural and remote areas will be the most affected.1,3

The increasing frequency and intensity of extreme weather events, combined with climate change-related impacts on agriculture and the need to expend public money on infrastructure in response to rises in sea levels, will have major consequences for our economy.1,3 In particular, they will reduce the resources available for health and welfare services and education. The poor are most vulnerable to these repercussions, and are also most vulnerable to the effects of rising heat and other extreme weather events.

The impact of climate change on the emergence and spread of infectious diseases is likely to be complex, with some becoming more widespread, and others less so. Some infectious diseases are more prevalent after climate-related events such as cyclones and floods; eg, the outbreak of leptospirosis in Queensland after the 2011 floods.7 The prevalence of bacterial food- and water-borne diseases is likely to increase, and the epidemiology of some vector-borne diseases will probably shift as temperatures rise and ecosystems are transformed.1,3

While Australians are not yet sufficiently motivated to make the changes to our energy generation systems and consumption that are necessary for reducing the risk of dangerous climate change, it would be foolish to think that we will not experience its effects. We are already doing so, and will increasingly do so as temperatures rise.

The writing is on the wall, and Australia must respond. We must reduce our emissions substantially, reduce our economic reliance on the export of fossil fuels, and actively promote drastic emissions reductions in international forums such as COP21. The carbon content of the atmosphere means that we can expect to see an average global temperature rise of 1.5°C by 2030–2040, regardless of any mitigation efforts we might undertake.1 This will have consequences for health, most of which can be avoided if we invest significantly in adaptation measures, including building community resilience (the capacity to adapt and respond to changing conditions), adjusting our agricultural and water systems, and ensuring that our health and social systems are sufficiently flexible and well resourced to respond to the increasing and changing needs of our communities. We must also assist low-income countries to adapt to climate change, both for ethical reasons and to limit the risks of increased migration and conflict.1

As the Lancet Commission emphasises,2 with threat comes opportunity, and we can build a healthier nation by mitigating and adapting to climate change. Reducing air pollution caused by burning fossil fuels, increasing the use of active (walking, cycling) and public transport, and reducing our consumption of meat and animal products will all contribute both to mitigating climate change and to improving health.2 In addition, crucial adaptation measures, such as strengthening our public health systems,5 transforming our economy, improving housing and community resilience, and reducing social inequalities, will make our society a healthier and better place to live for all.1

[Correspondence] Female genital fistula repair

We read with interest the Article by Mark Barone and colleagues (July 4, p 56).1 These researchers are to be congratulated on doing a randomised trial across Africa in resource-poor hospitals providing services to a group of severely disadvantaged women.

AMA LIST OF MEDICAL SERVICES AND FEES

The 1 November 2015 edition of the AMA Fees List is now available both in hard copy or electronic format.

Members listed as being in private practice or with rights of private practice, and salaried members who have requested a hard copy should have received their AMA Fees List Book by 31 October 2015.

The AMA Fees List is available in the following electronic formats; a PDF version of the hard copy book, a CSV file for importing into practice software, as well as an Online database where members can view, print or download individual items or groups of items to suit their needs. 

The PDF and CSV versions of the AMA Fees List are now available to all members via the Members Only area of the AMA website http://www.ama.com.au/resources/fees-list. The Fees List Online Database has been updated as of 2 November 2015.

To access this part of the website simply enter your username and password by clicking on the  symbol in the right corner of the blue task bar at the top of the AMA homepage and follow these steps.

1)   From the home page hover over Resources at the top of the page. A drop down box will appear. Under this, select Fees List.

2)   For the PDF and CSV – Select first option, AMA List of Medical Services and Fees – 1 November 2015 (Members Only).

3)   Download either or both the CSV (for importing into practice software) and PDF (for viewing) versions of the AMA Fees List.

4)   For the Fees List Online Database – Select AMA Fees List Online Database (Members Only)

5)   Click on the link to open the AMA Fees List Online Database, or alternatively the database can be accessed directly via http://feeslist.ama.com.au.

Also available to members is the AMA Fees Indexation Calculator, this allows you to calculate your own fee increase based on your individual cost profile. To access the AMA Fees Indexation Calculator, follow these steps:

1)   From the home page hover over Resources at the top of the page. A drop down box will appear. Under this, select Fees List.

2)   Select AMA Fees Indexation Calculator (Members Only)

Members who do not currently have a username and password should email their name, address and AMA member services number to memberservices@ama.com.au requesting a username and password.

If you did not receive your hard copy of the 1 November 2015 AMA List of Medical Services and Fees or would like one, please contact the AMA on 02 6270 5400 or email feeslist@ama.com.au. 

Govt survey a smokescreen to undermine equal access: AMA

Charging smokers and the obese higher health insurance premiums is the first step toward a US-style system in which the poorest and sickest are shunted into over-stretched public health services while insurers book big profits, AMA President Professor Brian Owler has warned.

Professor Owler has launched a full-blooded attack on the Federal Government over a survey it has launched which asks consumers whether they think insurers should be given the discretion to charge different premiums according to smoking habits, obesity and other health risks.

The AMA President said the Government’s move played into the hands of health funds keen to offload customers with serious and chronic illnesses onto the public system in order to boost their profits, and would do nothing to cut down on smoking or otherwise improve health.

“We all know that non-smokers are going to say ‘Yes, I want to pay less for my premiums,” the AMA President said. “This is not the way to tackle smoking.”

He said the bigger policy question was whether people were prepared to let health funds pick and choose who they insured, taking into account that procedures like genetic screening for potentially fatal diseases would soon be a reality.

“If you’re positive for a genetic test, are you going to be denied cover? These are the sorts of questions that we need to be asking,” Professor Owler said.

Health Minister Sussan Ley seized on figures showing health insurance policies covering 500,000 people were dumped or downgraded in 2014-15 to argue insurers need to provide much better value.

Ms Ley said the Government was committed to “recalibrating” the private health system to make it value for money following a succession of premium increases that have outstripped inflation and the proliferation of junk policies that offer nothing more than a public hospital bed.

“Consumers are angry, confused, and I’m concerned that simply shopping around is no longer enough to get the best value for money,” she said, inviting them to take part in an online survey being run by the Health Department.

Related: MJA InSight – Use subsidy for GP rebate

Premium increases outstrip costs

The private health insurance market is dominated by five big funds and the industry recorded an after-tax profit of $1.1 billion in 2014-15. Premium revenue surged by 7.3 per cent, leading the regulator to note that “the increasing cost of health services and growing utilisation rates have been more than offset by higher premiums”.

But the Minister has been forced on to the defensive amid criticism that her approach to put the interests of insurers ahead of patients, particularly the sickest and most vulnerable.

Shadow Health Minister Catherine King said suggestions in the survey that insurers be allowed to charge different premiums according to age and gender as well as lifestyle habits like smoking showed that women and the elderly were in the Government’s sights.

Ms King said it was alarming that the survey highlighted the higher benefits paid out to patients 75 years or older, while asking about gender was a “clear sign” that women of child bearing age would be required to pay higher premiums.

Related: Patients left stranded by health cover gaps

Community rating under attack

Professor Owler said the private funds wanted to undermine community rating, the principle under which insurers must offer the same price of health cover to all, regardless of their health risk, in order to boost their bottom line.

This was the intention behind the push to have smokers charged a higher premium, he said, warning the idea would eventually be extended to policyholders with other health risks.

“Where does it stop, because we know that genetic testing is coming down the track. You know that obesity and all sorts of other issues are going to be brought into play in the future, and…the insurers are only going to want to insure those people that are fit and healthy and don’t need anything done to them,” Professor Owler said. “That is all about maintaining their bottom line and…improving their margins.”

His concerns were given added weight when Mark Fitzgibbon, Chief Executive of insurer NIB, told Fairfax Media that although higher premiums for smokers would be the first move, insurers might eventually monitor the habits of policyholders to reward healthy behaviour like exercise  (and, by implication, to punish unhealthy activity).

But Ms Ley said it was not the Government’s intention to impair access to health care, and its starting point was that Medicare and public hospital system remain universally accessible.

“It’s important we’re able to ask consumers what they expect from their private health insurance, and there’s plenty of room to do that without moving towards US or UK models that exclude sick people, or make it only available to rich people, which we don’t support,” she said.

But the Minister flagged changes to industry regulation, remarking that a succession of the above-inflation premium increases suggested there was “something wrong” with its regulatory foundations.

Professor Owler said this was worrying.

“I find it very concerning when the Health Minister makes statements like she’s concerned that the health insurers are wrapped up in regulation or being restricted by regulation,” he said. “Those regulations are there to protect the public health system, and they’re there for a good reason.”

Adrian Rollins


Latest news: