×

Public hospital performance stagnating due to lack of funding: AMA

The Australian Medical Association has launched its Public Hospital Report Card 2016, and says results point to an imminent crisis.

The report card shows key performance measures such as emergency department waiting times, elective surgery waiting time and bed number ratios have either deteriorated or are stagnant.

AMA President Professor Brian Owler said these results are a direct consequence of reduced funding from the Commonwealth.

“The States and Territories are facing a public hospital funding ‘black hole’ from 2017 when growth in Federal funding slows to a trickle,” Professor Owler said.

“From July 2017, the Commonwealth will strictly limit its contribution to public hospital costs.

“Growth in Commonwealth funding will be restricted to indexation using the Consumer Price Index (CPI) and population growth only.

“Treasury advised the Senate Economics Committee that this change will reduce Commonwealth public hospital funding by $57 billion over the period, 2017-18 to 2024-25.

“As a result, hospitals will have insufficient funding to meet the increasing demand for services,” Professor Owler said.

Related: Patients face longer delays as ‘perfect storm’ set to hit stressed public hospitals

The current report card shows that:

  • Hospital bed to population numbers have remained constant despite there being an increased demand for hospital services
  • 68% of emergency department patients classified as urgent were seen within the recommended 30 minutes. The target for this is 80%
  • Under the National Emergency Access Target (NEAT), 90% of patients should be treated within four hours of presentation to an Emergency Department. In 2014/15, only 73% were treated in this time frame.
  • Under the National Elective Surgery Target (NEST), 100% of all urgency category patients waiting for surgery should be treated within the clinically recommended time however in 2014-15, 78% of elective surgery category 2 patients were admitted within the clinically recommended time (within 90 days).

Professor Owler believes it’s a lack of focus on public hospitals since the 2014 budget that has led to poorer outcomes.

He told ABC Breakfast: “The incentives and funding was there for infrastructure and [indistinct] ward funding was all taken away. And, naturally enough, we’ve seen these performances stripped backwards.”

He also said emergency departments are under increased stress with an increase of patients.

“We’re seeing more and more patients present to emergency, and they’re not GP-type patients; these are higher triage category patients, they’re sicker patients. These are the patients that are actually – represent the growth in the presentations to our hospitals.”

Related: Hospital cuts cloud reform outlook

Opposition health spokeswoman Catherine King said the government’s decision to walk away from Labor’s funding agreement with the states and territories would lead to further increase in emergency department wait times and big increases in elective surgery wait times.

“Patently, the current arrangements are inadequate and demonstrate that this government has no interest in health reform or ensuring every Australian has access to high quality hospital care,” she said in a statement.

Health Minister Sussan Ley has previously denied the AMA’s claims that multi-billion dollar “black hole” for hospitals.


“What we are focused on in the Federal Government — and what all governments should be — is efficiency,” she said in April 2015.

“Let’s get the best bang for our dollar, wherever it goes.”

The AMA Public Hospital Report Card 2016 is available at https://ama.com.au/ama-public-hospital-report-card-2016

Latest news:

SEPSIS KILLS: early intervention saves lives

The increasing incidence of sepsis is well recognised, and is generally attributed to the growing prevalence of chronic conditions in ageing populations.13 In New South Wales, the number of patients with a diagnosis of sepsis in the Admitted Patient Data Collection (APDC) has increased, and sepsis was involved in 17.5% of in-hospital deaths in 2009, compared with a mortality of 1.5% for all hospital separations (unpublished data).

The clinical presentation of sepsis may be subtle; fever is not always present.4,5 In NSW, failure to recognise and respond to sepsis has been regularly reported. In 2009, 167 incidents were highlighted in a clinical focus report published by the Clinical Excellence Commission (CEC).6 A Quality Systems Assessment in 2011, completed by over 1500 respondents across the NSW hospital system, reported that 34% of clinical units did not have guidelines or protocols for managing sepsis.7

This article reports on the SEPSIS KILLS program of the CEC, which aims to promote the skills and knowledge needed for recognising and managing patients with sepsis in NSW hospital emergency departments.

Methods

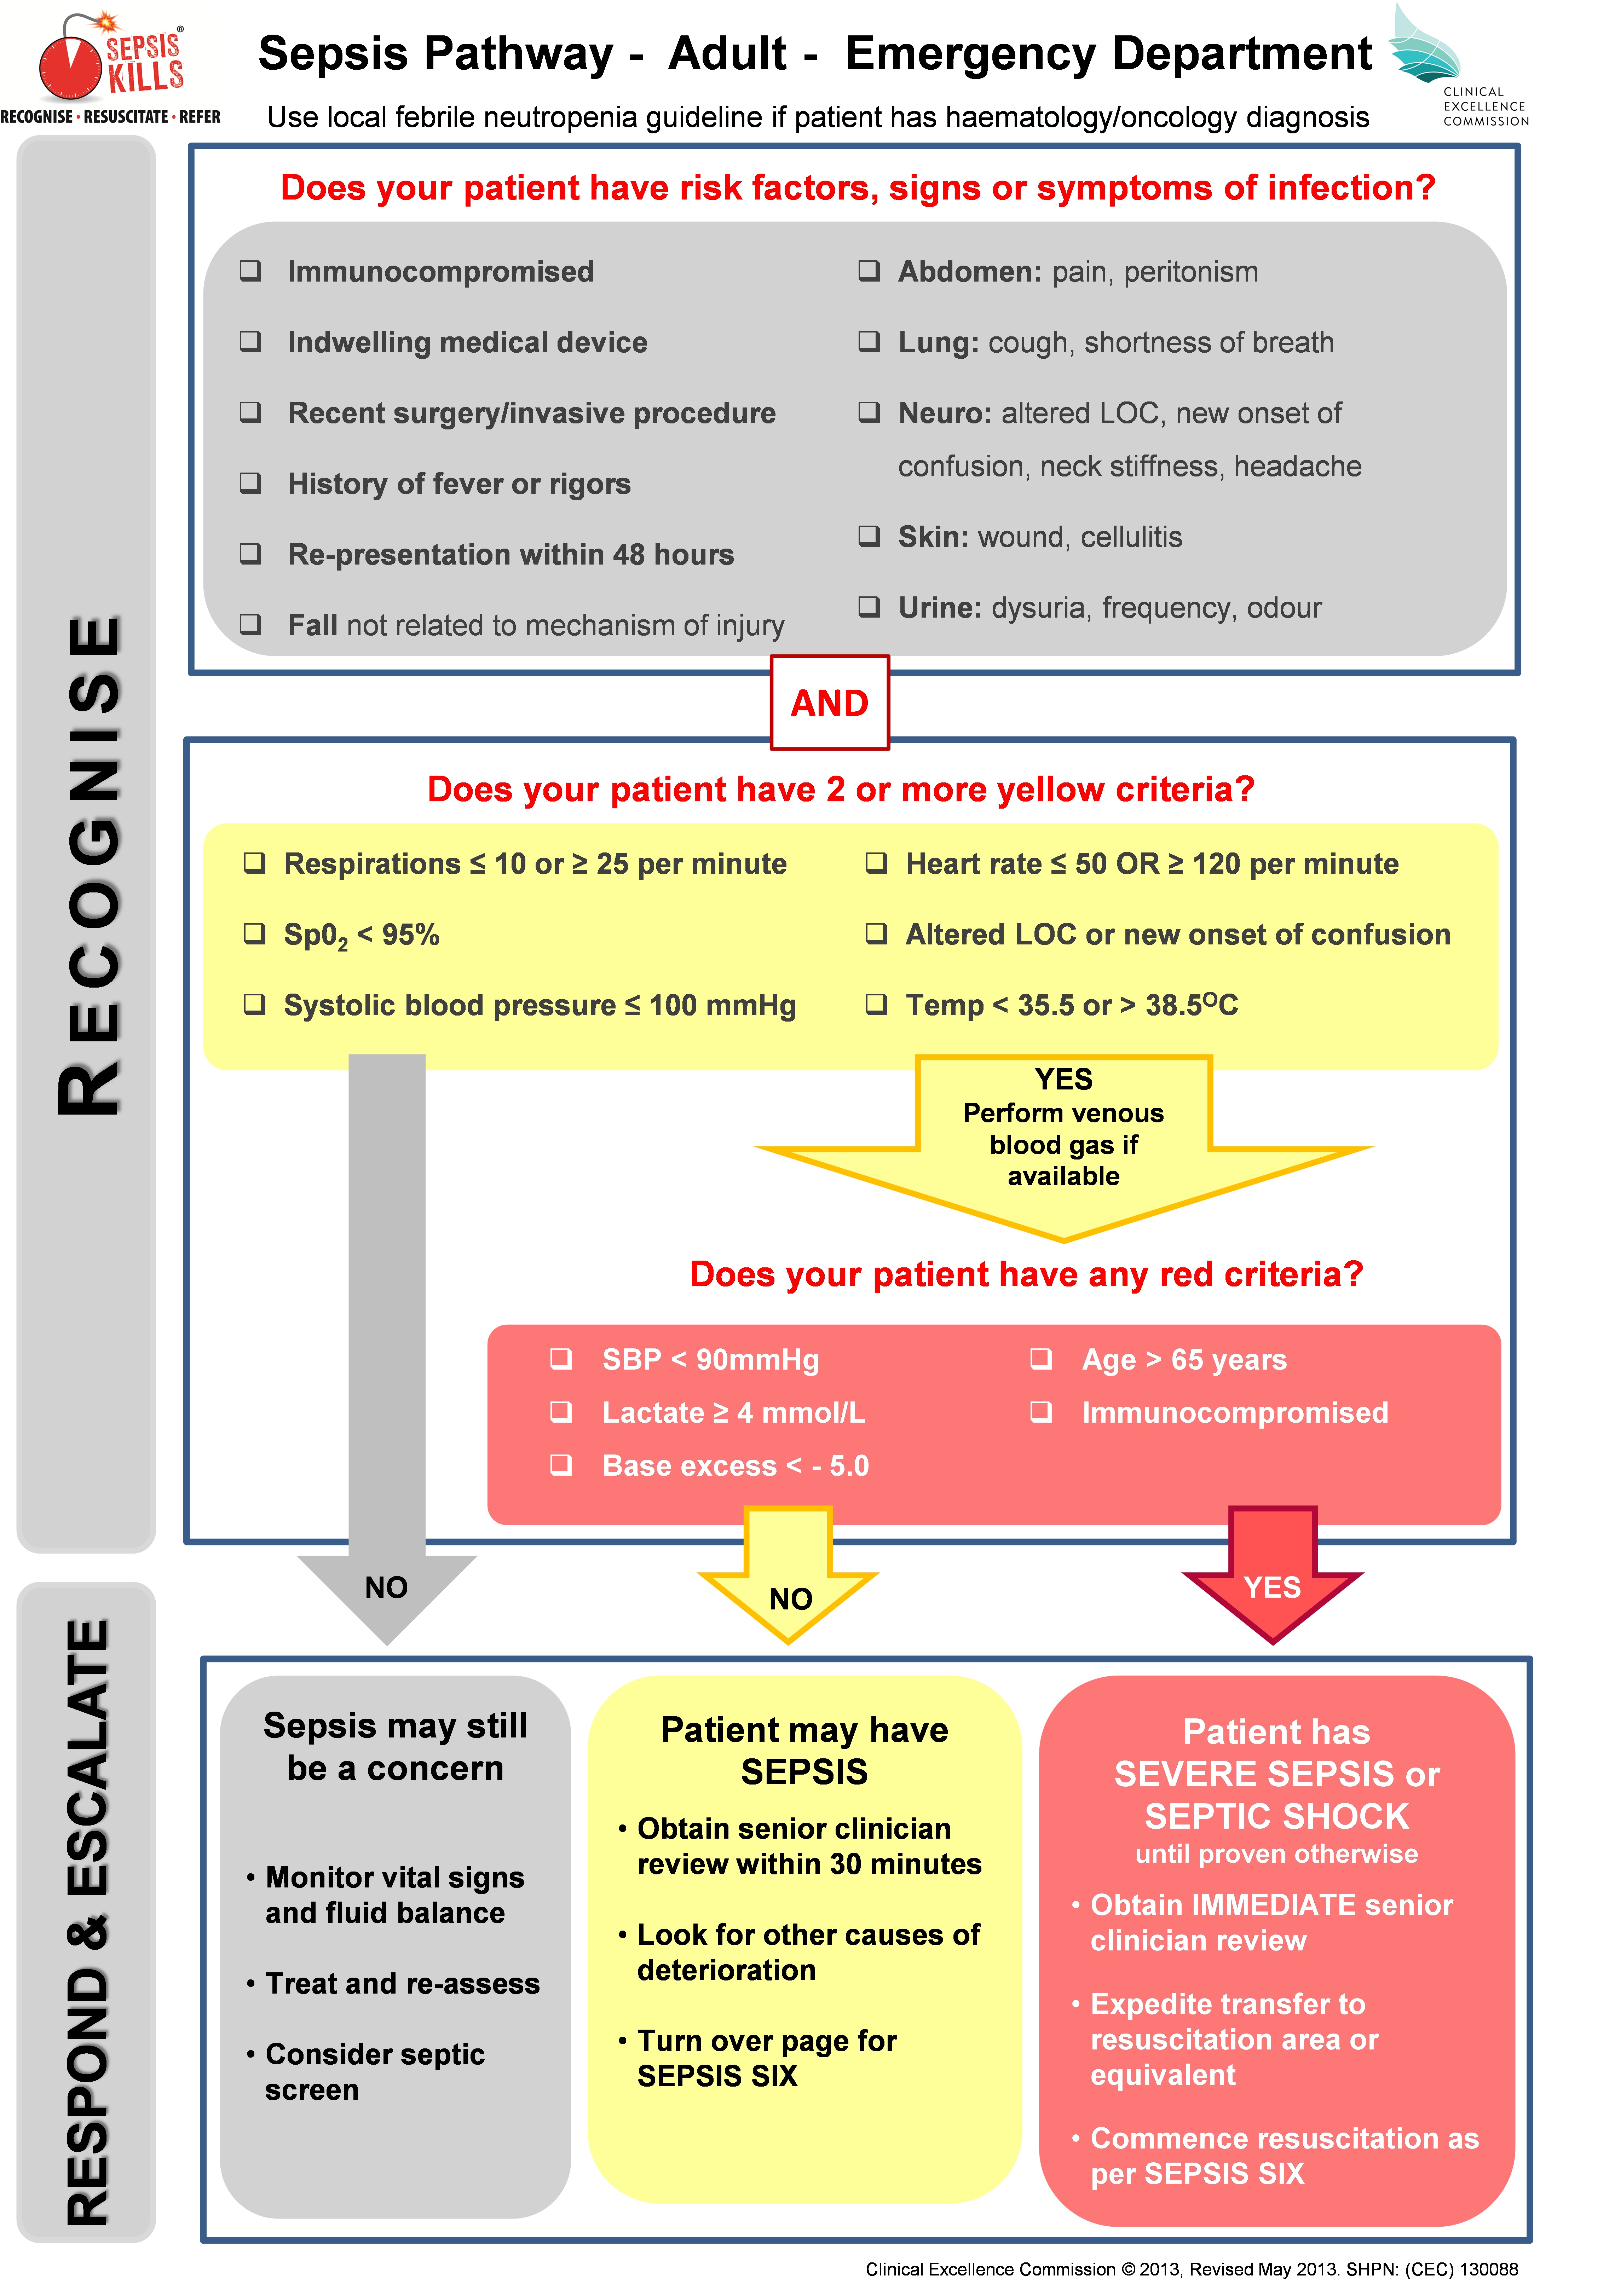
The focus of the program is to RECOGNISE risk factors, signs and symptoms of sepsis; RESUSCITATE with rapid intravenous fluids and antibiotics; and REFER to senior clinicians and teams. Standardised sepsis tools were developed in consultation with NSW emergency physicians, and included adult and paediatric pathways that built on the NSW deteriorating patient system, Between the Flags (BTF).8 The vital signs assessed in the sepsis pathways were consistent with BTF, and varied marginally from accepted systemic inflammatory response criteria (Box 1).

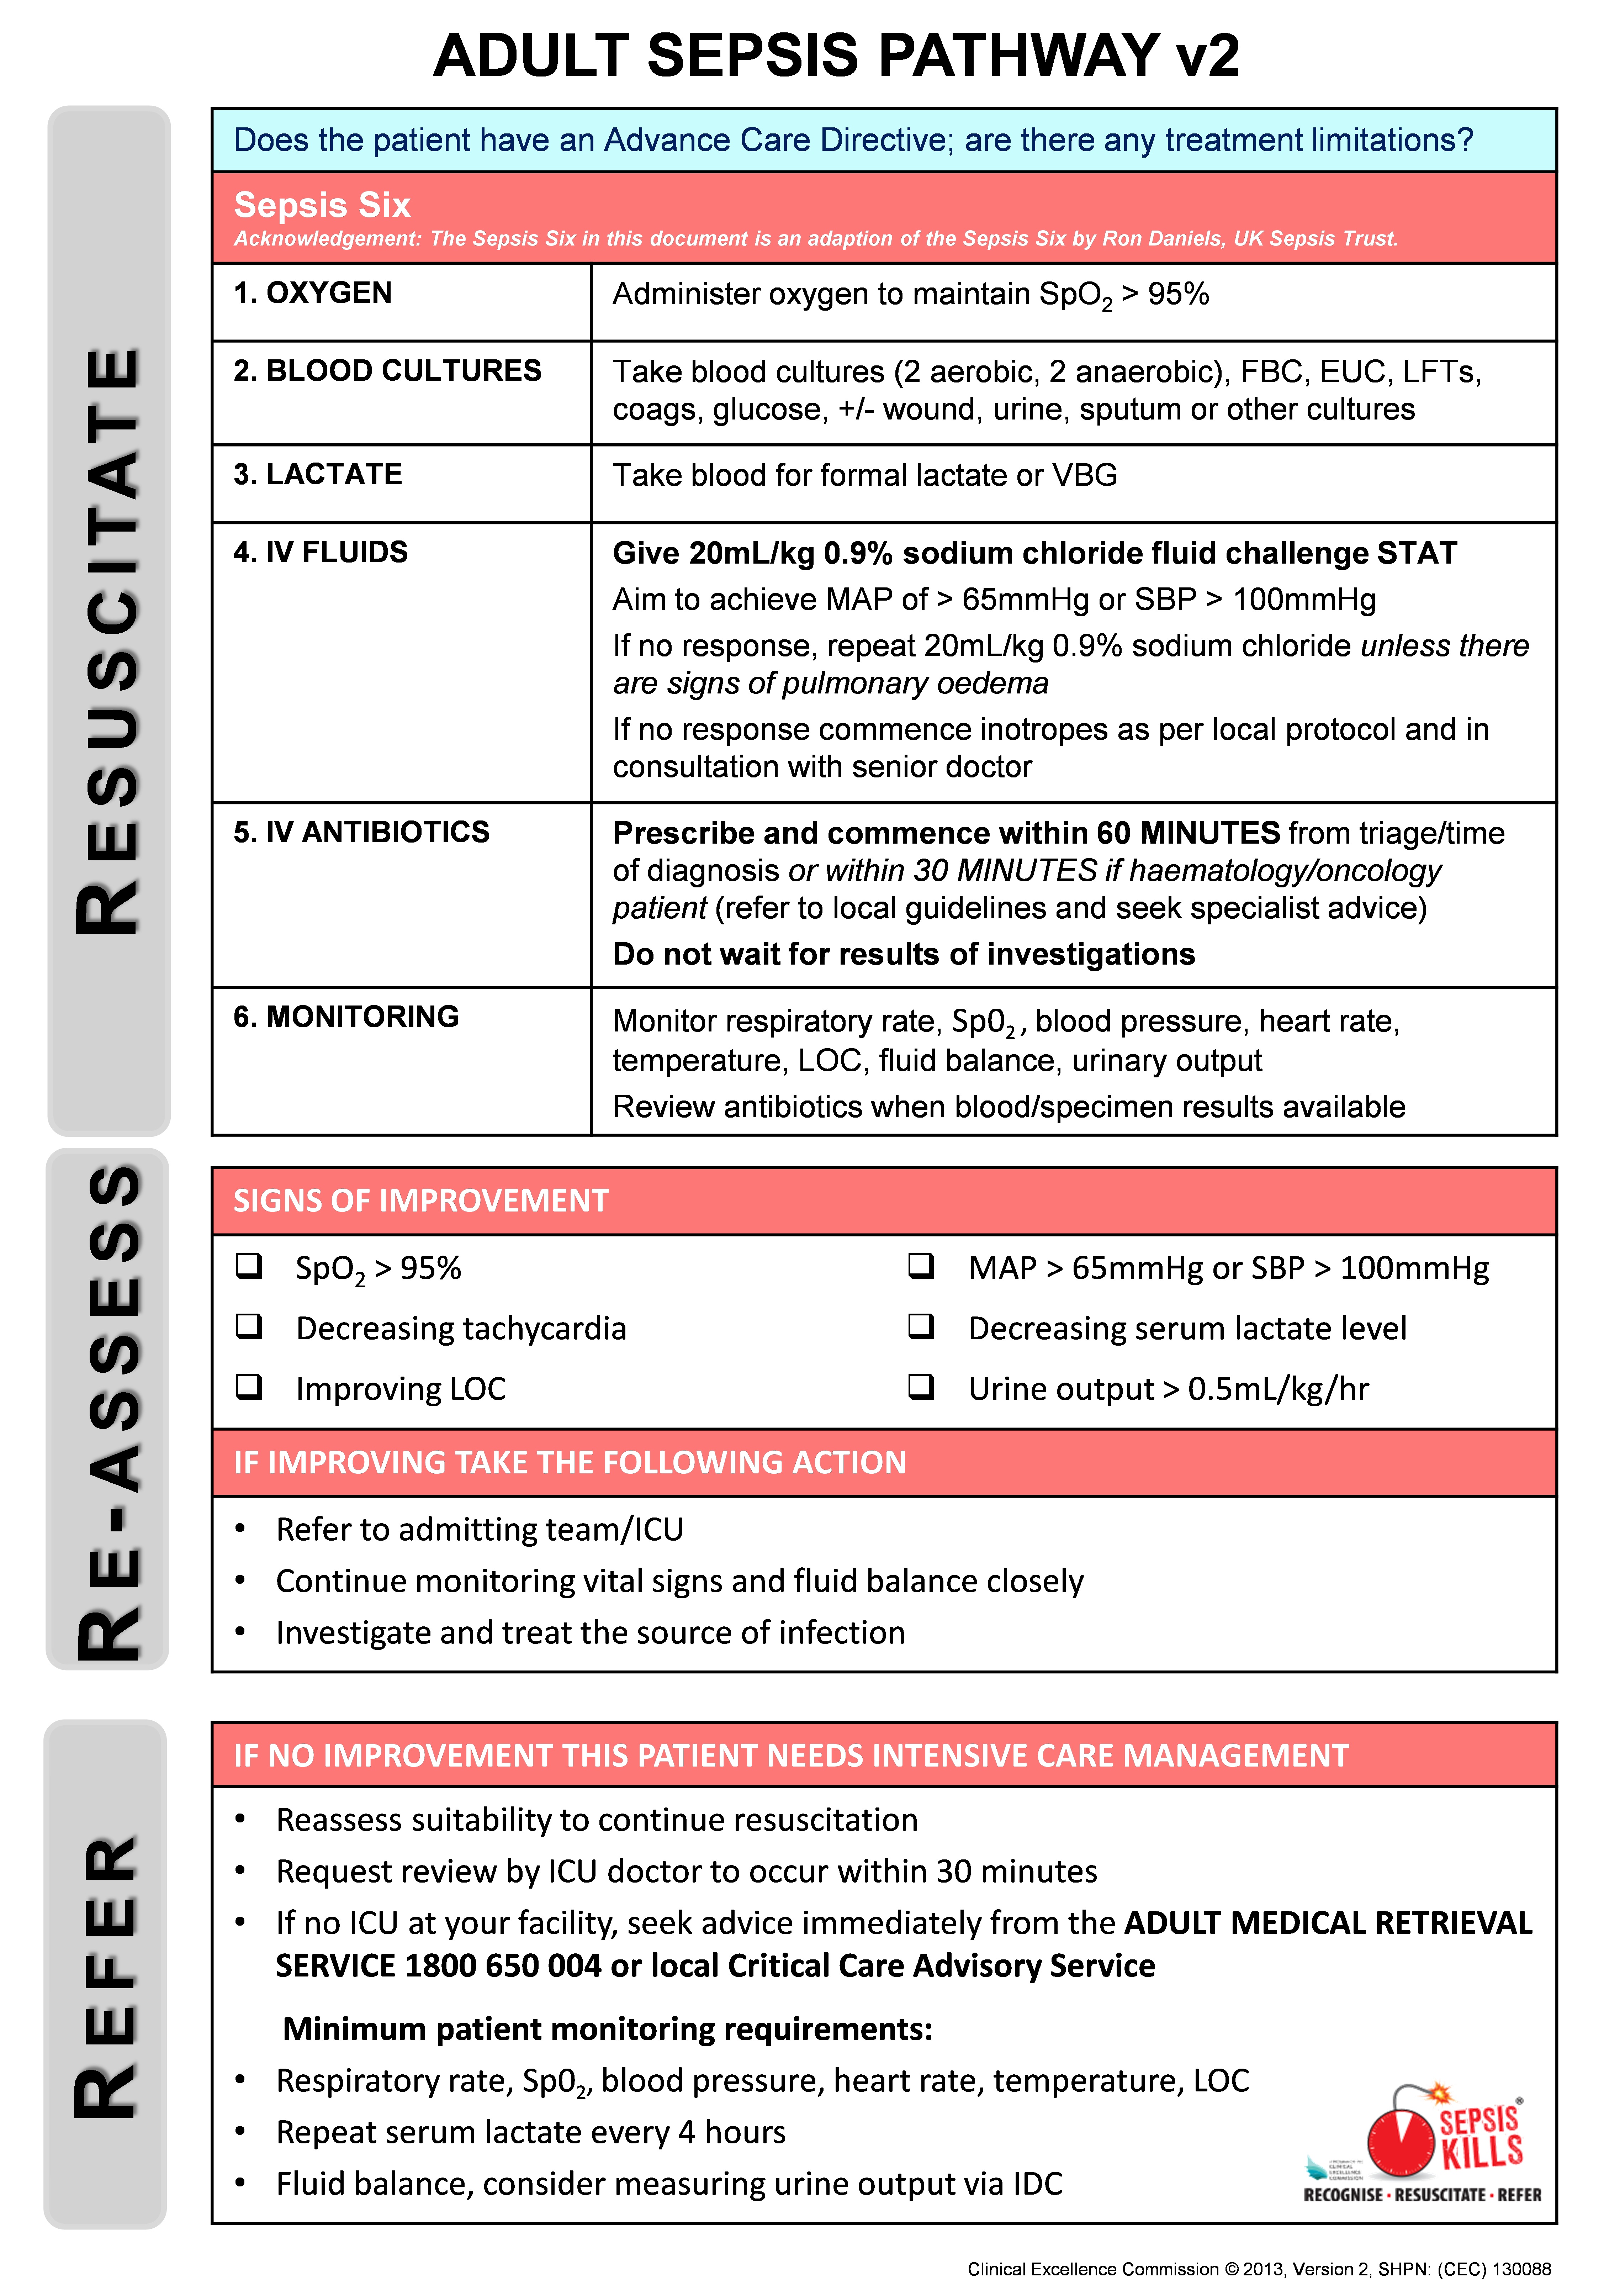
The SEPSIS KILLS pathways promote bundles of care, with the emphasis on early intervention. The adult bundle includes taking blood cultures, measuring serum lactate levels, administering intravenous antibiotics within an hour of triage and recognition, and administering a fluid bolus of 20 mL/kg, followed by another bolus of 20 mL/kg (if necessary) and inotropic drugs if the patient’s condition is not fluid-responsive. If no improvement is observed, senior medical review and admission to intensive care or retrieval to a major centre should be considered (Box 2). The paediatric bundle emphasises the importance of early senior clinical review and decision making. In addition, an empiric antibiotic guideline was developed with advice from expert infectious disease physicians. Emphasis was placed on the first dose of antibiotics, thereby allowing time for further assessment and diagnosis. Because of wide variations in practice, the guideline also contained details on how antibiotics could be administered most expeditiously.

The program was implemented in 2011 with a top-down, bottom-up approach, with strong leadership from medical and nursing clinical leads, and supported by the local health district Clinical Governance Units. Participation was not mandatory, and no extra resources were provided to participating emergency departments who implemented the program. The CEC team supported clinicians by holding a preliminary launch, monthly CEC–hospital teleconferences, executive reports, newsletters, site visits and workshops. A range of online resources was provided, including a Sepsis Toolkit (implementation guide) and various education tools.

Emergency departments were encouraged to collect prospective data on paediatric and adult patients with a provisional diagnosis of sepsis who had received intravenous antibiotics. An online sepsis database (from August 2011) facilitated collection of a minimum dataset for each patient that included their date of birth, triage time and date, triage category, clinical observations (including systolic blood pressure [SBP] and serum lactate levels), time and date of initial intravenous antibiotic treatment and of commencement of the second litre of intravenous fluid, the presumptive source of sepsis, and the disposition of patients following emergency department treatment. Data were collected either prospectively or by retrospective chart review. The database allowed emergency departments to monitor time to antibiotics and fluids in real time, and to compare this with the corresponding local health district and NSW data.

Ethics approval was obtained from the NSW Sepsis Register, which was developed as a public health and disease register under s98 of the Public Health Act 2011. The Sepsis Register is maintained by the CEC.

Data analysis

Analysis of process measures (time to antibiotic, time to intravenous fluid) was based on data from the SEPSIS KILLS database. A total of 13 567 SEPSIS KILLS records were submitted for linkage to the APDC to assess associations between in-hospital mortality and sepsis severity and patient disposition. Patients were classified by emergency department staff according to the Australasian Triage Scale (ATS).9 The cases were further classified as being severe or uncomplicated sepsis according to the serum lactate levels and presenting SBP of the patient.

To assess the population-level impact of the SEPSIS KILLS program, we analysed health outcomes (in-hospital mortality, hours in intensive care, length of stay) for paediatric and adult patients separated from NSW hospitals with ICD-10-AM (International Classification of Diseases, 10th revision, Australian modification) discharge diagnosis codes consistent with sepsis10 recorded in the Admitted Patient, Emergency Department Attendance and Deaths Register. This register was accessed through the NSW Ministry of Health Secure Analytics for Population Health Research and Intelligence (SAPHaRI) system. Linkage was undertaken by the Centre for Health Record Linkage (CHeReL). Only patients admitted to public hospitals with emergency departments were included in the analysis. Trend analysis was performed for the run-in period, August 2009 – December 2011, and for the two following years, 2012 and 2013. Outcomes by sepsis severity could not be analysed at the population level because of the lack of consensus about using ICD-10-AM codes to differentiate between severe and uncomplicated sepsis.

Descriptive and inferential analyses included the calculation of frequencies, odds ratios (ORs) and 95% confidence intervals, and χ2 tests for trends. Trends over time for process and outcome measures were assessed in regression models. Logistic regression was used to analyse in-hospital deaths, while linear regression models were used for time in intensive care and lengths of stay. Models were adjusted as appropriate for covariates (age, year, triage category and severity of sepsis). Statistical significance was defined as P < 0.05.

Results

The SEPSIS KILLS program was implemented as individual emergency departments became ready during 2011. Both retrospective and prospective data were collected by 97 hospitals to 31 December 2013 and entered into the sepsis database. Data were submitted by 13 tertiary, 19 metropolitan and 65 rural hospitals. Because of the low number of paediatric patients, analysis was restricted to data for adult patients.

The provisional sources of sepsis included the lungs (5216 patients, 40.5%), urinary tract (2998, 23.2%), abdomen (1077, 8.4%), skin or soft tissue (975, 7.6%), musculoskeletal system (98, 0.8%), central nervous system (96, 0.7%), vascular device (82, 0.6%), and other systems (973, 7.6%). For 1238 patients (9.6%) the source was unidentified, for 133 (1.0%) no source was recorded.

There were age data in 12 879 records. There was a significant reduction in the mean age of patients between 2009 and 2013, from 67.3 years in 2009–2011 to 64.8 years in 2013 (P < 0.001 for trend; Box 3).

Data for the process indicators from the CEC sepsis database are summarised in Box 3. The proportion of patients who were categorised at triage as ATS 1 (“see immediately”) rose from 2.3% in 2009–2011 to 4.2% in 2013. Those categorised as ATS 2 (“see within 10 minutes”) increased from 40.7% in 2009–2011 to 60.7% in 2013 (P < 0.001). There were small reductions in the proportions of patients classed as ATS 3, 4 or 5.

The proportion of patients who received antibiotics within 60 minutes of triage or recognition increased from 29.3% in 2009–2011 to 52.2% in 2013 (linear trend test, P < 0.001). Similarly, the number of patients who started a second litre of intravenous fluid within one hour rose from 10.6% to 27.5% (linear trend test, P < 0.001).

The analysis of population-based APDC data, which included all separations with emergency department involvement from public hospitals in NSW between January 2009 and December 2013, is presented in Box 4. There were 15 801 sepsis hospital separations during the run-in period of 2009–2011, with a mortality of 19.3%. This rate declined to 17.2% in 2012 and 14.1% in 2013. There was a significant linear decrease over time (P < 0.0001); the OR for death (compared with the run-in period) was 0.87 (95% CI, 0.80–0.94) in 2012, and 0.69 (95% CI, 0.63–0.74) in 2013. Significant linear declines were also observed for time in intensive care and length of stay (for each trend: P < 0.0001).

Linkage of the APDC and sepsis databases showed that the mortality rate for the 1616 patients with severe sepsis (serum lactate ≥ 4 mmol/L or SBP < 90 mmHg) was 19.7%; these patients were significantly more likely to die than patients with uncomplicated sepsis (serum lactate < 4 mmol/L and SBP ≥ 90 mmHg) (OR, 3.7; 95% CI, 3.2–4.4; P < 0.0001). The mortality rate for the 893 patients with hyperlactataemia (a lactate level of 4 mmol/L or more; reference interval, 0.5–2.0 mmol/L) was 24.9%, while that for 637 patients presenting with cryptic shock — hyperlactataemia together with normotension (SBP ≥ 90 mmHg) — was 21.2%. There was no change in mortality for either group over time. For 734 patients who presented with SBP < 90 mmHg and lactate levels < 4 mmol/L, mortality was 13.5%, which declined significantly across the study period (2009–2011, 16.5%; 2012, 16.0%; 2013, 9.8; P = 0.03). The overall mortality rate for uncomplicated sepsis patients increased significantly over time: 3.7% (21/567) in 2009–2011, 6.2% (145/2336) in 2012, and 6.7% (145/2164) in 2013 (P = 0.02).

The mortality rate for the 268 ATS 1 patients was 28.8%. The risk of death for patients over 65 years of age was 3.3 times higher (95% CI, 2.6–4.1) than for patients under 65 years of age (P = 0.001).

The mortality rate for 543 severe sepsis patients admitted to intensive care did not change significantly over time — 23.4% (2009–2011), 19.5% (2012) and 16.0% (2013) (P = 0.145) — nor did the proportion of the 1073 patients with severe sepsis who were admitted to the ward and died — 21.4% (2009–2011), 21.5% (2012) and 18.4% (2013) (P = 0.263). In contrast, the risk of death for 4225 patients with uncomplicated sepsis admitted to the ward increased significantly: 3.2% (15/466) during 2009–2011, 6.0% (115/1914) during 2012, and 6.2% (115/1845) during 2013 (P = 0.047).

Discussion

SEPSIS KILLS is a quality improvement program that aims to reduce preventable harm to patients with sepsis by recognising the condition early and managing it promptly. It is based on the principle that early recognition and aggressive management with antibiotics and fluids will improve outcomes.1113 It is consistent with the 3-hour component of the resuscitation bundle outlined in the international guidelines of the Surviving Sepsis Campaign.3

The program was not planned as a before-and-after project, but was independently implemented by individual emergency departments during 2011. More than 80% of NSW emergency departments (175 of 220) used the sepsis pathways, and 97 emergency departments submitted over 13 000 records. The resulting increase in the number of patients for whom antibiotics were initiated within 60 minutes of recognition and the increased likelihood of the second litre of fluids being started in the first hour indicate that the program was successful. Greater urgency is also apparent from the marked increase in the number of patients classified at triage as ATS 2. We cannot, however, explain the significant age difference between the patients seen in 2012 and 2013.

Reviewing the population-based APDC hospitalisations with an ICD-10-AM code for sepsis showed that there was a steady reduction in mortality over time. Contrary to what we expected, the survival benefit in our patients appears to have been greatest for those with evidence of haemodynamic instability (SBP < 90 mmHg) but normal lactate levels.

The mortality rate of 15%–20% for patients admitted to intensive care with severe sepsis (one-third of the overall sample) is consistent with the overall mortality rate in Australian and New Zealand intensive care units.14,15 In 2013, the crude mortality rate for the patients admitted to wards was higher than that for the intensive care group. We believe the relatively high proportion of ward patients may be the result of an underappreciation of the potential mortality of sepsis, of the significance of elevated lactate levels, and of the time course of the septic process, as well as of failure to recognise cryptic shock16 and the obvious and practical problem of intensive care unit bed availability. We did not assess how many had end-of-life treatment limitations in place.

Managing large numbers of patients with sepsis on the wards has been described elsewhere.17,18 These patients have not been well studied, although a number of studies have identified deficiencies in care.1921 The significant increase in mortality among patients with uncomplicated sepsis admitted to the ward causes concerns that some of our ward patients may have qualified for intensive therapy. An increase in mortality in less severe sepsis has also been documented by other authors.22

The major challenge was managing the prescribing of antibiotics. Despite general acceptance of expert guidelines for prescribing antibiotics, differences in their prescription and administration were observed. This evidence–practice gap is well recognised,23 and the empiric antibiotic guideline was developed to promote appropriate antibiotic prescribing practices and optimal outcomes.24 The empiric guideline was consistent with the principles of antimicrobial stewardship, and, while each site was allowed to modify it according to local opinion and antibiotic resistance patterns, changes were infrequent. Particular anxieties were expressed about prescribing and administering gentamicin. The administration component of the guideline was developed to promote the most expeditious method of administration rather than favouring the slow infusion that had become normal practice. Despite the emphasis on the first dose and timely review, antibiotics were often continued long after they should have been reviewed, following consideration of the results of pathology investigations.

Other challenges beyond our control included educating a high turnover workforce in emergency departments, as well as medical engagement, particularly in rural facilities where governance is difficult and there is no doctor on site, or locum medical staff are more common. There were wide variations in the methods of blood culture collection, and a standardised guideline for blood cultures was subsequently added to the Sepsis Toolkit.

Limitations

This work is subject to the limitations of any quality improvement project at multiple sites. The prolonged run-in period was not ideal. Our approach was not to measure compliance with the care bundle, as undertaken elsewhere, but to use time as a measure for promoting behavioural change among emergency department clinicians. Assessing patient outcomes was the major difficulty. The voluntary nature of data collection resulted in its inconsistent submission, and the lack of strict diagnostic criteria for sepsis resulted in patients with conditions from across the inflammatory condition–sepsis spectrum being included in the SEPSIS KILLS database. Resource limitations also meant that some sites implemented the pathways but did not submit data.

Reviewing the outcomes of patients with an ICD-10-AM code for sepsis in the population-based administrative APDC is an accepted approach. This, however, entails the risk of reviewing the outcomes of a different group of patients, a group for whom the final diagnosis might not be directly related to sepsis or its severity. This is a potential problem when comparing the final diagnosis in the APDC database with the provisional diagnosis in the SEPSIS KILLS data.

Finally, the improved outcomes described in our article may be the result of the SEPSIS KILLS program, but may also be related to other initiatives for improving quality of care.

Implications for clinicians, researchers and policy makers

The observation that patients with severe sepsis are being managed on the wards highlights the need for a shift in the focus of both practice improvement and research from intensive care to ward management. It also raises the problem of sepsis and the deteriorating patient. We informally estimated that around 30% of patients who required a Rapid Response call had sepsis, but this may be an underestimate, with rates possibly as high as 50%–60%.25 Finally, our work confirms the need for continued research into risk stratification tools for sepsis in the emergency department. In the meantime, all patients with lactate levels of 4 mmol/L or greater require intensive care unit review and admission.

The SEPSIS KILLS program promotes early recognition and management of sepsis during the first few hours in NSW emergency departments. By focusing on the principle of “Recognise, Resuscitate, Refer” it is possible to reduce the time before antibiotics are administered and fluid resuscitation initiated. This program could be applied in other jurisdictions and its integration with antimicrobial stewardship requirements should be considered.

Box 1 –
The SEPSIS KILLS pathway for adult patients in hospital emergency departments, page 1

Box 2 –
The SEPSIS KILLS pathway for adult patients in hospital emergency departments, page 2

Box 3 –
Characteristics, and process and outcome indicators of sepsis-related hospital separations before and after the launch of the SEPSIS KILLS program

Characteristics

Run-in period


SEPSIS KILLS program in operation


P for trend

Aug 2009 – Dec 2011

2012

2013


Number of separations

1585

5396

5905

Mean age ± SEM, years

67.3 ± 0.5

67.6 ± 0.3

64.8 ± 0.3

< 0.001

Triage category*

< 0.001

1

37 (2.3%)

176 (3.3%)

242 (4.2%)

2

463 (40.7%)

2765 (51.5%)

3532 (60.7%)

3

683 (43.2%)

2034 (37.9%)

1767 (30.4%)

4

207 (13.1%)

378 (7.0%)

267 (4.6%)

5

10 (0.6%)

16 (0.3%)

12 (0.2%)

Missing data

5

22

83

Antibiotic received within 60 min

464 (29.3%)

2165 (40.2%)

3083 (52.2%)

< 0.001

Second litre of intravenous fluid within 60 min

135 of 1272 patients (10.6%)

521 of 3631 patients (14.3%)

991 of 3609 patients (27.5%)

< 0.001


SEM = standard error of the mean.

Box 4 –
Hospital outcomes prior to and after the launch of the SEPSIS KILLS program, NSW, January 2009 to December 2013

Outcomes

Descriptive statistics

Odds ratio (95% CI)

P for trend


Deaths, numbers (percentage)

< 0.0001

2009–2011

3053/15 801 (19.3%)

1

2012

979/5683 (17.2%)

0.87 (0.80–0.94)

2013

870/6167 (14.1%)

0.69 (0.63–0.74)

Mean time in intensive care (SEM), hours

< 0.0001

2009–2011

32.7 (1.0)

2012

26.6 (1.4)

2013

25.8 (1.3)

Mean length of stay (SEM), days

< 0.0001

2009–2011

13.5 (0.1)

2012

12.2 (0.2)

2013

11.5 (0.2)


SEM = standard error of the mean. Source: Admitted Patient Data Collection, NSW Ministry of Health Secure Analytics for Population Health Research and Intelligence (SAPHaRI). Data extracted on 1 June 2015.

[Comment] Offline: Health—the Chinese dream

China falters. An alarming message transmitted around the world after a period of unprecedented stock market volatility last week. Where does this moment of uncertainty leave prospects for health? Rapid economic growth has delivered the fiscal space to enable China to make astonishing progress in scaling up public access to health services, especially compared with similar middle-income countries, such as India. But close observers are anxious that China’s health reforms have stalled. This week, the Government of China convened a forum of international advisers to discuss urgent challenges facing the country.

Kidnapping leaves big hole in care

Dr Ken Elliot. Picture credit: Global Business Solutions Institute

AMA President Professor Brian Owler has voiced concerns for the safety of an Australian couple kidnapped from a health clinic in Burkina Faso, and raised fears the incident will not only disadvantage the local community but could deter others from undertaking humanitarian work.

Dr Ken Elliot and his wife Jocelyn, who have worked as medical missionaries in the impoverished West African country for more than 40 years, were snatched by suspected Al Qaida-linked militants from their home in Baraboule, near Djibo, about 200 kilometres north of the capital Ouagadougou.

Reports suggest the couple, who are both in their 80s, were taken in the early hours of 16 January, and may have been taken hostage for ransom as part of a fierce struggle between rival militant factions.

They were very well known in the area, where they run a 120-bed hospital. Dr Elliot is the only surgeon, and the clinic they established in 1972 serves a population of two million.

In a video published recently for the Friends of Burkino Faso Medical Clinic by Global Business Solutions Institute, Dr Elliot talked of the “enormous need” for care in the area.

In the video, Dr Elliot said there was a great shortage of surgical care in the region, and their hospital treats everything from hernias and bladder stones to tumours.

“You name it, we do it, because there is nowhere else to do it,” he said. “When you look around and see the need, the need is enormous, [but] the rewards are enormous.”

President Owler told ABC Radio the Elliots were among hundreds of Australian doctors around the world performing humanitarian work, often in isolated areas.

“We sometimes hear their stories, but most of the time the stories are not told and they’re really unsung heroes,” the AMA President said. “We should be very proud of the sort of work that these people are doing. They do, clearly, put themselves in danger.”

Professor Owler said that, in addition to fears for the welfare of the Elliots, he was also concerned about what effect their abduction would have on the local community.

“Clearly, he and his wife have been doing humanitarian work in Africa for most of their lives, devoted their lives to heling the local people and, of course, when this sort of thing happens, it takes away a vital resource from these local people,” he said.

In the wake of the kidnapping, Djibo locals have mobilised to demand the release of the Elliots, amid concern that without them local health services will deteriorate.

A local family friend, Seydou Dicko, told the BBC that “he is not only Australian but he is someone from Burkina Faso, someone from our community, because what he did for our community even the Government itself couldn’t do more than that”.

Professor Owler said the incident could also deter others from following in the path of the Elliots and other Australian doctors providing health services for disadvantaged communities in some of the world’s poorest countries.

“I think it probably deters other people from taking up similar work in the future,” he said.

The Department of Foreign Affairs has said it is working with local authorities to try and locate the couple.

Adrian Rollins


Changes to PIP eHealth initiative

Following stakeholder consultation, the Department of Health has advised the new eligibility criteria for the Practice Incentives Programme (PIP) eHealth Incentive. The changes aim to encourage GP uptake and to increase the meaningful use of the My Health Record system.

Despite advice from the AMA and other members of the PIP Advisory Group that the My Health Record is not yet fit for purpose, the Government has decided to link the incentive to use of the My Health Record. From 1 May, general practices will be required to upload a Shared Health Summary (SHS) to the My Health Record system for 0.5% of the practice’s standardised whole patient equivalent (SWPE) to be eligible for their payment. This contribution equates to about five shared health summaries per full-time equivalent GP per quarter.

Practices will be advised at the start of a quarter of the SWPE count. They will need to keep a tally of shared health summaries uploaded to be certain of meeting their target.

Related: MJA – Why e-health is so hard

To assist general practices to meet the new requirements, there will be online training available nationally from February and on demand face to face training from March/April. PIP participating general practices will be advised of the changes to the eligibility criteria for the ePIP through regular communication channels such as the PIP newsletter, websites and through Primary Health Networks.

Further consultation with the PIP Advisory Group and the broader general practice community will be undertaken in the near future regarding a tiered performance-based incentive arrangement, targeted for possible introduction in the August 2016 quarter. Under this approach, incentive payments would be linked to levels of use, such as numbers of SHSs uploaded.

Andrew Knight: e-Health revolution

Following AMA advice, the Department is considering transitioning existing PIP eHealth recipients to the new PIP eHealth arrangements as an alternative to requiring re-registration. Further advice on this matter will be provided to the PIP Advisory Group in February.

During consultations with the Department, the AMA, along with other stakeholders on the PIP Advisory Group, have repeatedly advised that the introduction of an MBS item and Service Incentive Payment for creating, uploading and updating a SHS would drive greater usage of the My Health Record. This view will be considered as part of the MBS Review.

This article was first published on GP Network News.

Latest news:

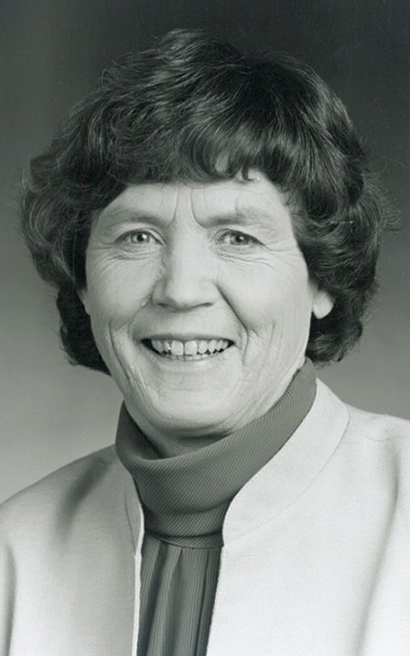
Priscilla Kincaid-Smith

Priscilla Kincaid-Smith (1926–2015) was a towering figure in Australian and international medicine

Priscilla Sheath Kincaid-Smith was born and raised in South Africa. At school, she was more interested in sport than study and proved to be an outstanding athlete. She was national 100 yards freestyle swimming champion and toured Europe with the South African women’s national hockey team. Only World War II prevented her from being an Olympian. At the University of the Witwatersrand, Johannesburg, Priscilla discovered a lifelong love of medicine and medical science. Being a brilliant student and athlete, she tried for a Rhodes Scholarship, only to be told that as a woman she was not eligible.

In 1953, she followed the path of many ambitious young medical graduates from the dominions and moved to London, where she worked at the Royal Postgraduate Medical School at Hammersmith Hospital with Sir John McMichael, whom she later described as her most influential teacher. It was here, while studying the renal lesions of malignant hypertension, that she developed her lifelong fascination with the kidney and its pathology. She spent long hours in the postmortem room, and it was in this rather unlikely setting for romance that she met a young Australian doctor, Ken Fairley. After a brief courtship, they married and set off for Australia.

The sunburnt country was something of a shock to Priscilla. She loved the bush, but the prevailing social attitudes were another matter. She had not experienced the rampant sexism of Melbourne in the 1950s in either Johannesburg or London. Married women at that time were barred from employment in the public service, which meant that most hospitals and universities had never had a female professor. On one occasion, she was asked to be keynote speaker at a meeting of a special society at a Melbourne club. She arrived at the venue to be told that, as a woman, she could not use the front door but must enter via the tradesmen’s entrance.

After arriving in Melbourne, Priscilla worked part-time as a research fellow at the Baker Heart Research Institute, with links to pathology at the Alfred Hospital. Subsequently, she joined the department of medicine at the University of Melbourne as a senior associate at Royal Melbourne Hospital. Here, she founded the renal unit in a surgical ward flower room and developed it to become globally renowned. She became the University of Melbourne’s first female professor in 1975 and, after her very reluctant retirement in 1991, she moved her practice to Epworth Hospital, where she was Director of Nephrology for over a decade.

Priscilla’s initial studies in Australia related to vessel lesions in the kidney, particularly in hypertension. Subsequently, she played a key role in the establishment of both nephrology and hypertension as distinct specialities, as a founding member and later president of the Australian and New Zealand Society of Nephrology and as a founding member of the High Blood Pressure Research Council of Australia.

Her two great passions were first, her family — Ken, children Jacqui, Stephen and Kit, and numerous dogs, horses and cows — and second, her work, most particularly her patients.

Priscilla had great personal charm, but in a professional context, she could appear reserved, even forbidding. At the same time, she was enormously loyal to her staff and above all to her patients. She worked extremely hard, but weekends for family and farm were sacrosanct. With Ken, Priscilla was very hospitable to junior staff, although some of the less robust regarded a weekend on the farm at Apollo Bay as a mixed blessing — straining fences, chopping wood and herding cows not being to everyone’s taste. Distinguished foreign visitors often suffered the same fate.

An abiding characteristic was her determination. If she thought something was important, she would go for it relentlessly and never take no for an answer. More often than not, she succeeded. A journalist once remarked that she was a great media performer because “she looks good, she sounds good, and she has a mind like a steel trap”. Priscilla was very competitive and she loved to win.

Despite her renown as a pathologist, Priscilla was first and foremost a clinician. She was astute, with wonderful powers of observation, and her research and advocacy were always patient focused.

Shortly after her arrival in Australia in 1958, Priscilla observed at autopsy, kidneys with profound tubulointerstitial disease and papillary damage that she had not previously seen, and she was able to identify as necrotic papillae material passed in the urine by some of Ken’s patients. With colleagues, she described the pathological, clinical and epidemiological features of this new condition. In Europe, it was labelled phenacetin nephropathy, but Priscilla and her co-workers showed experimentally that all the minor analgesics were toxic, most particularly in combination. Following the failure of education campaigns and the removal of phenacetin to modify what was the most common cause of renal failure in parts of Australia, she used her formidable advocacy skills to lead the charge for legislation and regulation to remove compound analgesics from corner shops and supermarkets, and put them behind the counter in pharmacies. A disease that was the scourge of thousands and a major cause of end-stage renal disease is now history.

Priscilla made key contributions in virtually all areas of nephrology. She was one of the first to recognise the importance of integration of end-stage renal failure management in an era when dialysis and transplant units often functioned independently, and she had an aggressive approach to management which led to her unit having success rates for cadaveric transplants well above the norm. She was a world leader in the pathology and clinical classification of glomerulonephritis, in pre-eclampsia and renal disease of pregnancy, and in reflux nephropathy.

Over her working life and beyond, Priscilla received numerous honours and awards, including Companion of the Order of Australia and Commander of the Order of the British Empire. She served as president of the Royal Australasian College of Physicians, the World Medical Association and the International Society of Nephrology, chair of the Federal Council of the Australian Medical Association, and founding president of the Asian Pacific Society of Nephrology. She was awarded honorary fellowships and degrees from all around the world, and had numerous prizes, orations and awards named for her.

People trained by her populate senior positions in nephrology and academic medicine worldwide, most particularly in Australia and South-East Asia. Her influence has been, and continues to be, immense. Not only was she instrumental in training future leaders in nephrology, she was an outstanding role model for women, showing not only that they could get to the very top but that they could do it in the context of a happy and successful family life.

Priscilla leaves an extraordinary legacy — in our better understanding of kidney disease, in the training and mentoring of physicians worldwide, as a role model for women and, most importantly, in the patients she helped and the lives she saved.

Compensated transnational surrogacy in Australia: time for a comprehensive review

Reproductive desire, domestic legal restrictions and cost have made transnational surrogacy a lucrative industry.1 Arrangements usually proceed smoothly, but ethical and legal scrutiny of this practice is ongoing. Commissioning parents have allegedly abandoned well2 and unwell3 children born to surrogates overseas. Investigations into transnational surrogacy are numerous, yet we are no closer to an answer as to whether the current status quo is acceptable.

Surrogacy involves a woman (the surrogate) undertaking a pregnancy and giving birth where another individual or couple (the commissioner[s] or intended parent[s]) will parent the child. Where the pregnancy involves the surrogate’s oocyte, it is termed genetic, partial or traditional surrogacy.4 Gestational or full surrogacy occurs when gametes from the intended social parents or a separate donor are used. Surrogacy arrangements that do not result in net financial gain for the surrogate are referred to as altruistic (or non-commercial4), although the distinction between reimbursement and payment is easily blurred. Altruistic surrogacy is rare in Australia, with only 36 live births in 2013.5 Compensated or commercial arrangements involve payment (beyond mere expenses) in exchange for services. This practice is precluded by law or regulation in all Australian jurisdictions.6

All forms of surrogacy give rise to ethical issues.6 Compensated surrogacy is, however, more ethically contentious than altruistic surrogacy, owing to concerns over exploitation and commodification of women, intended parents and children.4 Concerns about socioeconomic disparities exacerbate these issues. This article focuses on the ethics, law and policy of surrogacy as it applies to Australians commissioning a pregnancy in low-income countries for a fee: a practice that can be termed transnational compensated surrogacy.

Regulation of transnational compensated surrogacy in Australia

Surrogacy is not regulated uniformly in Australia,1 and state and territory regimes have been criticised for the complexities that current oversight gives rise to.7

Altruistic surrogacy is permitted in all Australian states and the Australian Capital Territory, albeit with restrictions in some jurisdictions. Commercial surrogacy is prohibited by statute in all states and the ACT, although payment for reasonable expenses is allowed.8 The Northern Territory has no statutes governing surrogacy, although in order to gain accreditation from the Reproductive Technology Accreditation Committee (RTAC), clinics need to adhere to National Health and Medical Research Council (NHMRC) guidelines that veto commercial surrogacy.6 Draft revisions to the NHMRC guidelines say little about transnational surrogacy other than to stipulate practice standards for Australian clinicians.4

Residents in New South Wales, Queensland and the ACT are liable to be charged with an offence if they engage in compensated surrogacy overseas.9 However, this does not appear to act as a deterrent10 and is difficult to enforce.1 Destination countries include Nepal, Mexico and the Ukraine. Thailand has recently restricted compensated surrogacy to heterosexual couples married for more than 3 years; one of the couple also requires Thai nationality (http://www.sbs.com.au/news/article/2015/07/31/new-thai-surrogacy-law-bans-foreigners). India has recently initiated similar legal reforms.11

Transnational surrogacy also has legal complexity for citizenship and legal parentage. Examples of children ending up stateless have been discussed in the literature.12 Obtaining legal parentage following surrogacy can also be complex and there is potential for legal disputes to arise.1,13

The question of exploitation

The NHMRC’s draft revised ethical guidelines on assisted reproductive technology cite concerns over exploitation to condemn commercial surrogacy.4 The concern here is the wrongful or unfair use of a woman to have a child for another for payment.14,15 Focusing on women’s reproductive labour to benefit a commissioning couple may also fail to show appropriate respect,16 particularly given the vulnerability and unequal bargaining power of those who act as surrogates.17

The financial gain from commercial surrogacy could also unjustifiably induce participation, particularly if there is evidence that financial rewards mean poorer women participate when they would not otherwise.17,18 This could also be framed as a concern over “an unfair ‘disparity of value’”15 between the payment made and risks encountered.

A response might be that surrogacy is a contract just like any other, and we only need to ensure the arrangement is entered into autonomously and fairly, including appropriate consent. However, the practicalities of ensuring valid consent in a social context of deprivation and inequality are not simple.14 Further, a contract in which the subject of the exchange is a reproductive service may be ethically distinct from contracts that do not involve this type of exchange. Surrogacy impacts bodily integrity, is a constant commitment for the period of gestation, restricts behaviour, is risky (with potential lasting physical and emotional effects) and leads to the birth of a new individual.

It is also interesting to consider whether exploitation should be objectively or subjectively determined. Whittaker’s work examining surrogacy in Thailand, for example, suggests that women do not see their role as exploitative; surrogacy is “described as a selfless act of Buddhist merit”.19 However, Whittaker also comments that framing commercial surrogacy as meritorious may merely be a new form of exploitation. Any influence that payment has on these attitudes may also be relevant.

Evidence also suggests that there are practices that exploit women acting as surrogates in some overseas countries. Accounts describe unscrupulous operators motivated by profit,20 contracts being worded to exclude surrogate women from decision making,21 and there are concerns about ongoing medical care and advocacy during pregnancy and after the birth.19 There is some evidence of pressure being applied to women to act as surrogates to help provide for their families.21 Around two-thirds of the fees paid for transnational surrogacy goes to agents.22

It therefore seems that at least some current practices of compensated transnational surrogacy have legitimate exploitation concerns, which will render them ethically problematic if not addressed. On the other hand, surrogacy is but one example of wider problems of exploitation in the face of global inequities.14 We need to ask both whether (and if so, how) we can improve equality and women’s status in transnational surrogacy contracts and how we can also improve surrogates’ material circumstances,17 including ensuring the utmost medical care and appropriate action if harm occurs.

The question of commodification

Commodification can be defined as occurring when surrogates, the services they provide or the children who are born through surrogacy are wrongfully treated as commodities (a product that can be bought and sold).15 The draft NHMRC guidelines cite this as the second main ethical justification for condemning compensated surrogacy.4 Commodification questions arise in all paid surrogacy, but are particularly prevalent in transnational surrogacy due to disparities in relative wealth. Two main questions arise. First, is compensated transnational surrogacy “baby selling”? Second, does it commodify women?

Critics of compensated surrogacy often turn to claims based on “buying children”. Article 2a of an Optional Protocol to the United Nations Convention on the Rights of the Child (ratified by Australia) includes any act of child transfer for remuneration in its definition of the sale of children,23 and some have suggested that legal difficulties in separating payment for a child and payment for reproductive services mean that surrogacy has to be a form of child purchase.15 Additionally, surrogacy contracts often include clauses such that less is paid if a live baby is not surrendered to the commissioning couple.

Wilkinson rejects the claim that surrogacy is “baby selling” on numerous grounds.14,15 One is that a surrogate does not own the baby (insofar as anyone can do this); the commissioning parents do. A handover clause also does not make surrogacy baby selling; it makes it a service contract with a success clause.

As to commodification, conceiving and bearing a child is an intimate process.24 Adding a price could mean that women become mere “wombs for rent” by their commissioners. Wilkinson replies that including a fee-paying aspect does not preclude treating surrogate women with respect. It is the inappropriate use of compensated surrogacy that is commodifying, not compensated surrogacy itself.

It might also be claimed that reproductive labour is just one of many processes for which financial exchange often takes place without demeaning outcomes. Placing children into the care of others, for example, is an intimate and valuable parenting activity for which payment is made. Moreover, not all women may value the intimacy of gestation and labour; or, if they do, they are willing to relinquish this value to another.

Welfare concerns and obligations

Concerns exist around parental obligation and child welfare after transnational surrogacy. For example, if an overseas surrogate is found to be carrying twins, should a commissioning couple take both children? What should happen when a commissioning couple separates during the pregnancy and neither wants the child?

The best interests of the child standard might help answer these kinds of questions. However, the standard itself is liable to criticisms, such as it being vague, or setting a standard that is too high, or being too relative to a particular culture — leaving no room for objective assessment.25 It is difficult to define what is in the best interests of a child conceived via transnational compensated surrogacy. And it could also be claimed that meeting basic interests is enough.

An alternative approach might be to focus on parental obligations. These are applicable to those “who assume the role of a parent” or a person “who has a continuing obligation to direct some important aspect (or aspects) of a child’s development”.26 They include duties such as supporting a child’s development, fulfilling the child’s needs, showing respect, providing primary goods, fostering autonomy and providing advocacy.26,27

Commissioning parents would be subject to these parental obligations, as they have assumed a parental role. The obligation could also be said to be continuing, given that their actions have had a direct causal relationship to the child being born. Commissioning parents who have more children than they can look after or who abandon a child arguably have failed to uphold their parental obligations. The only way parental obligations might end is if a commissioning parent makes appropriate and legal arrangements for another to take on the role instead.

Domestic compensated surrogacy?

Proposed revisions to NHMRC guidelines maintain opposition to compensated surrogacy.4 However, Everingham and colleagues have claimed that the resulting exodus of Australians abroad is a failure of domestic policy.10

How might we respond to this? First, it might be claimed that the status quo could be preserved, perhaps with increased visibility of altruistic surrogacy. However, this would mean that Australians continue to travel for surrogacy, with the risks that this entails,28 the ethical problems it results in and the possibility of prosecution.

An alternate option is to better regulate transnational surrogacy. But we know this is not acting as a deterrent and is poorly enforced.1,18 It may also lead to risks through concealing travel if it were enforced and would require complex agreements between nations.

Third, domestic compensated surrogacy could be sanctioned as a harm-minimisation approach.14,18 Supporters point to factors such as payment being just one factor involved in surrogacy and the inherent commercialisation of assisted reproduction in Australia.18 Regulations could be developed to regulate brokering, fair wages and advertising; the latter is already under consideration in NSW.29

A final option is to take a different ethical approach; for example, by promoting national self-sufficiency.24 This is based on ethical principles such as societal responsibility, solidarity and justice and would involve treating surrogacy in a manner similar to organ donation. However, promoting self-sufficiency does not address the existing low numbers of altruistic donors.

In 2015, the NHMRC invited public comment on fixed payment to Australian oocyte donors beyond reasonable expenses.4 The justification was that many Australians are now travelling abroad and are liable to receive risky or poor-quality treatment. This justification could be said to be a similar harm-minimisation approach to that suggested for surrogacy.14,18 We can therefore question why fixed payment is being considered for oocyte donation in Australia, but not surrogacy.

A nationally coordinated approach to surrogacy may now be on the horizon, with the announcement of a Commonwealth inquiry into surrogacy.30 The inclusion of “compensatory payments” in the terms of reference for the inquiry will hopefully facilitate a thorough and in-depth discussion of these issues nationally. The inquiry is due to report by 30 June 2016.

Conclusion

Transnational compensated surrogacy raises significant ethical and legal issues. It involves balancing surrogates’ and children’s welfare with commissioners’ desires to parent. The present status quo in Australia, with its varying regulations, complexity over legal parentage and concerns over welfare, is problematic. Under both present and proposed regulations, compensated transnational surrogacy will likely continue. Australia needs to do more to ensure that transnational surrogacy is not exploitative or commodifying of surrogates, commissioning parents and children. Parental obligations should also be emphasised in debates over this practice.

“Sorry, I’m not a dentist”: perspectives of rural GPs on oral health in the bush

Australians living in rural areas have poorer oral health than city residents.1 They experience higher rates of dental caries2 and are more likely than people in city areas to visit dentists for problems other than check-ups.3 Complicating this situation is the inadequate availability of dental care services in rural areas because of the uneven distribution of dental practitioners across Australia; most dentists and other dental practitioners practise in city areas.4,5 Many small rural towns in Australia do not have the population to support a full-time or resident dentist. Dental services in Australia are largely provided by the private sector (85%);6 public oral health services are provided only for those under 18 years of age and for adults who hold health care concession cards.7

People on low incomes who cannot regularly access dental care and who do not have private insurance are more likely to present to general medical practices and hospital emergency departments with oral health problems for immediate treatment and referral.813 It is concerning that dental conditions accounted for 63 000 avoidable hospital admissions in Australia during 2012–13.14 The admission rates for these conditions were lowest among city residents (2.6 admissions per 1000 population) and highest for very remote residents (3.7 per 1000),15 although the rates in each category vary between jurisdictions.16

When dental services are not available in remote areas, people visit non-dental health providers, including medical staff, for dental care.12 Although rural general practitioners see patients with dental health problems, there has been limited research into their views about oral health. Our study investigated how rural GPs manage presentations by patients with oral health problems, and their perspectives on strategies to improve oral health in rural areas.

Methods

This study forms part of a broader oral health rural workforce research project that is investigating the relationship between dental practitioners and primary care networks. The chief dental officers of Tasmania, Queensland and South Australia were invited to identify rural and remote communities in which oral health care was a significant problem, and where there was at least one general medical practice, a health care facility and a pharmacy, but no resident dentist. Primary care providers in selected communities who had experience in advising patients with oral health problems were invited to participate in semi-structured interviews. Participants were recruited using both purposive and snowball sampling strategies.17

The interview guide was developed on the basis of our review of the relevant literature, and included questions about each participant’s professional background; the frequency and management of oral health presentations, and the level of confidence with which the practitioners managed these patients; and their views on strategies that could improve rural oral health. The interviews were conducted in the participants’ workplaces by one or more members of the research team between October 2013 and October 2014. Recruitment continued until data saturation18 was attained in the concurrent data analyses. Interviews were audio-recorded and later transcribed.

Interview data were subjected to thematic analysis.19 NVivo version 10.0 (QSR International) was used to organise transcripts and codes. All transcripts were verified against audio recordings by two members of the research team, and interview data coded independently for cross-validation. The coding results were compared and discussed at regular meetings involving all researchers until consensus was reached. The consolidated criteria for reporting qualitative research (COREQ)20 were used as a guide for ensuring quality. Quotes from individual GPs are identified in this article only by number (eg, GP 20).

Ethics approval for the study was granted by the Human Research Ethics Committee (Tasmania) Network (reference H0013217).

Results

Characteristics of study sites and participants

Sixteen communities were identified by state dental officers for inclusion in the investigation: three each in Tasmania and South Australia, and ten in Queensland. All but three Queensland communities were found to satisfy the study inclusion criteria (Box 1). In these communities, 101 primary care providers, including 30 GPs, participated in the study. In this article we report on the perspectives of these 30 GPs (18 from Queensland, nine from Tasmania, three from South Australia). Twenty-two were men, eight were women; 15 were 40 years old or younger, 15 were over 40 years old; the median time that the participants had worked in their current practice was one year (range, 0.04–35 years; interquartile range, 0.11–3.88). Nine GPs participated in two group interviews and 21 in individual interviews. Interviews lasted 30 to 60 minutes.

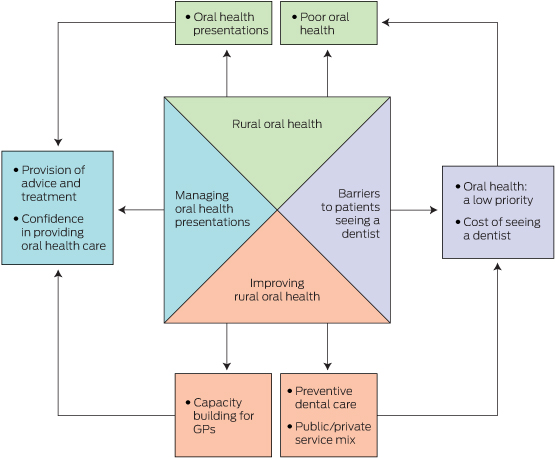
Four themes emerged from the interviews: rural oral health; managing oral health presentations; barriers to patients seeing a dentist; and improving oral health (Box 2).

Rural oral health

Participants reported seeing between one and 20 patients of various ages with oral health problems each month (mean, 12 per month for each community):

… the guy that just walked out and the one before him just walked out with a dental problem and probably three others came in today … four to five per week, close to 20 a month. (GP 10)

The oral health problems they saw ranged from toothaches, abscesses, oral infections and dentures to trauma:

… mostly what we see is dental abscesses, mouth ulcers, sometimes it is dentures … And, of course, extreme pain and tooth abscesses. (GP 8)

Having seen patients with oral health problems, GPs could observe the oral health status of their communities. Nine of 30 GPs commented that it was “so bad”, “very poor”, “never expected”, or even “shocking”:

I mean this town has shocking, shocking dental care … I’ve never seen teeth so badly decayed. (GP 10)

Managing oral health presentations

Most participants provided prescriptions for antibiotics and short-term pain relief, and advised patients to see dentists:

… if I suspect infection I will give antibiotics … As far as pain goes, I will give them a short-term oral pain relief … but I always give advice to go to the dentist. (GP 13)

Some also reported providing education about oral hygiene and preventive dental care:

I mostly provide pain relief, provide antibiotics, provide advice in personal dental care, I’m very hot on that. (GP 10)

Other treatments include dental block injections and tooth extractions:

Occasionally I pull people’s teeth here, but I’d rather not do it. (GP 19)

Eighteen of the GPs were confident, within their scope of practice, about providing oral health care advice and treatment:

Yes, pretty confident with basic dental emergency relief. (GP 4)

However, some acknowledged that they were not always confident, and that they lacked training in the area:

I start off … “sorry, I’m not a dentist”, and all I know is there are supposed to be 32 teeth in the mouth and that is pretty much all I know. I don’t have the training, absolutely not. (GP 6)

Barriers to patients seeing a dentist

Participants expressed concern that, for a number of reasons, patients would often not visit a dentist as advised. Some believed that this was because oral health was a low priority for these patients and this started with the parents:

Dental care is not a priority in rural people’s lives — at all … There are some quite attractive young men and women who’ve got shocking teeth … so just for lack of care … But again, it’s parental priority. When I was a kid, I come from a large family, my memory of school holidays was twice a year mum driving to a dentist. That was in the day with the old dentist drill with the black rubber bands … drilling … terribly slow … but we still used to go, we didn’t have a choice. But it’s my parents drove that, and they didn’t have a lot of money to spare, but they saw it as a priority. (GP 19)

As a consequence, some patients returned to the GP with even worse problems that required hospitalisation:

… the pain goes away and they don’t go to the dentist, and then they come back with chronic infection, and I say, “but I told you to go to the dentist” … lots of repeat clients. (GP 7)

Dental problems become medical problems if not treated and [we] need to admit them to hospitals. (GP 3)

Participants also noted that those on low incomes who did not have health care cards could often not afford to see a dentist regularly:

… the other thing that really is a big hindrance for oral health is the cost of going to the dentist, so a lot of people aren’t really going … [not] willing or are able to do that. I know I haven’t been to a dentist for a long time. (GP 20)

In the absence of a resident dentist or regular visits by mobile dental services, both public and private patients needed to travel to a larger centre to obtain dental care. This was described as “quite hard” and a “dilemma” for rural residents. A very remote GP reported:

I think the major issue for most of our patients is cost issues [involved in] flying off the island … so it’s the dilemma we face as professionals, as practitioners, as well as our patients. (GP 8)

Improving rural oral health

GPs suggested a number of ways to improve oral health in their rural communities. This included additional training in dental care on topics such as “major trauma interventions”, and more “practical advice”:

… we don’t really learn any dentistry at all … it’s still part of the body and doctors just kind of bypass it. (GP 20)

… I suppose we have to do what is best for our patients, and if we can in any way up-skill, upgrade our scope of practice in terms of dental care delivery, I’m happy to consider that. (GP 8)

Being busy clinicians in a small town, most GPs preferred flexible education and training, such as short online courses and workshops.

… the problem is I went to this course, had a great time, bought the kit, came back, never used it and then I’ll forget it! … it has to be regular, annual or semi-annual. (GP 19)

Spending some time at a dental clinic was also regarded as very beneficial:

I spent a day there [at a dental clinic] to have a look at what they did … It was a really helpful day … And because you have a friendly relationship, I can say OK, I am flicking [patients with dental problems] your way. (GP 15)

Twelve participants described the importance of community- and school-based oral health promotion:

Oral health education for the public should be better. Mum and Dad don’t brush their teeth, so the kids don’t do it either. (GP 2)

I really feel that having someone locally doing preventative health advice, especially with the children, checking that the fluoride is enough, a lot of our patients use tank water and they are not getting possibly the fluoride they need. Getting the paste on their teeth on a regular basis I think would make a big difference; just educate them. (GP 7)

Some saw opportunities to provide preventive advice to patients when they came for medical appointments:

I tell people routinely, but it’s part of the whole general holistic approach in general medicine. (GP 19)

Both public and private visiting oral health services were regarded as valuable for the community. A strategy suggested by 12 participants was to have a resident or visiting dentist or dental practitioner who could serve both public and private patients. This model was described by one GP as “half public and half private”:

We’d like an adult dentist please! On a regular basis and not just from the public system. It would be useful if there was someone out here that did private patients, so that people are not more disadvantaged who can’t get to town, and can’t get in if they don’t have a health care card. (GP 12)

GPs were not well informed about visiting dental services.

The private dentist comes when he comes … I don’t know why the hospital and doctors don’t know when the government dentist is coming. (GP 9)

Some GPs expressed concerns about the lack of a clear referral pathway to dentists, describing the communication as “one-way”; “nothing comes back”, “[we] never get feedback”:

There is no follow-up there, most of the time the dentist does not really send you anything back. Usually when I refer patients, you get more feedback, but I don’t get that from dentists. To be honest, the professional interaction coordination between me and most dentists, as a GP and the dentist, is nothing. (GP 11)

Only one GP reported receiving feedback from a dentist to whom he referred patients:

So if I refer someone to a dentist … I’ll write a letter to them and they’ll write back to me. (GP 19)

Discussion

We found that residents of the communities we sampled presented to GPs with oral health problems. Consistent with other reports,9,12,22 management of these problems by GPs typically included short-term pain relief, prescribing of antibiotics, advice that the patient see a dentist, and, if required, hospitalisation. GPs raised concerns about repeatedly seeing patients who did not visit a dentist as advised, and they referred to the relatively low priority given by many patients to oral health, as well as to cost and travel distances as major barriers to patients visiting a dentist. A number of presentations that required hospitalisation could have been averted by following the GPs’ advice. Participating GPs were therefore conscious of the need in their communities for broader oral health education and for promotion measures that would involve a range of health care professionals linking with other stakeholders. These measures include the delivery of regular oral health promotion programs in schools, reinforcement of good oral hygiene practices by parents, and fluoridation of town (or tank) water supplies where this was not currently undertaken.23 As primary care providers, GPs could play a critical role in providing oral health screening and education during their regular interactions with patients.

The interviewed GPs recognised that building their capacity and confidence could help them better care for patients with oral health problems. This might be achieved through regular short workshops on practical skills, training for dental emergencies,24,25 undertaking training modules, and consulting practice guidelines, including those available from the Royal Australian College of General Practitioners, the Australian College of Rural and Remote Medicine and the Royal Flying Doctor Service. These could be included in the induction process for GPs working in more isolated practice settings.

Participants expressed concerns about the lack of information about the dental services that visited their towns and the dearth of feedback from dentists about patients they had referred to them. Changes in professional and medical personnel and to visiting dental services, often attributed to funding cuts, compounded this problem. For the communities sampled in this study, there was clearly a need to establish effective communication and referral pathways between GPs and members of the dental teams.

In the absence of a universal dental health insurance scheme, some GPs recognised the opportunity for developing alternative business models for delivering dental services. For example, a mixed public/private funding model could enable dentists to provide services to both public and private patients in smaller communities in a financially viable and ethical manner. The potential of tele-dentistry to connect the GP with a dentist located elsewhere could also improve care for patients26 and help reduce the costs and burdens to patients of travel to regional centres for dental care.

A limitation of our study was the fact that 14 of the 30 GPs interviewed had worked in their communities for less than a year. This may have affected their answers to some questions, including those about communicating with the dental team. However, their responses were consistent with those of participants who had worked in their communities for longer periods, which suggested that this was a common problem, regardless of time in the current location. Further, we did not specifically recruit GPs from Aboriginal health centres, and our data were not verified against the records of dentists who had worked in the region. Finally, although we achieved data saturation, not all problems experienced by GPs may have been identified; different concerns might perhaps have emerged in other settings and in specific population groups.

Nevertheless, this study was unique in that it included a diverse sample of communities across three states and a relatively large number of GPs. This study contributes to our understanding of the experiences of GPs with respect to oral health in rural communities, and canvassed a number of strategies for improving the situation.

Rural oral health could be improved by a number of approaches, including building the capacity of GPs to assist people with dental health problems, strengthening community and individual engagement with oral health promotion and prevention activities, improving visiting dental services for all remote residents, regardless of whether they hold health care cards, and establishing more effective referral and communication pathways between dentists and GPs.

Box 1 –
Characteristics of the communities including in the study

Town

Population

Nearest dental surgery

Visiting dental service

ASGC-RA


1

< 500

248 km

Public dentist: once every 3 months; school dental van: sporadic visits

RA5

2

< 1000

70 km

No visiting oral health services

RA4

3

< 1000

40 km

School dental van: sporadic visits

RA3

4

< 1000

87 km

Private dentist: once a month

RA4

5

< 1000

179 km

Public dentist: once a year

RA5

6

< 1000

210 km

Private and public dentist visits: once every 3 months; mobile Aboriginal dental van: once a year; school dental van: sporadic visits

RA5

7

> 1000

43 km

No visiting oral health services

RA4

8

> 1000

40 km

No visiting oral health services

RA3

9

> 1500

214 km

Private dentist: once a month for 3 days; school dental van: sporadic visits

RA4

10

> 1500

212 km

Public and private dentists: sporadic visits

RA5

11

> 1500

200 km

Private dentist visits: once a month; school dental van: sporadic visits

RA5

12

> 2000

62 km

Private dentist visits: once a year

RA3

13

> 3000

196 km

Public dentist visits: once a month; mobile Aboriginal van: once a year

RA4


ASGC-RA = Australian Standard Geographical Classification Remoteness Area.21

Box 2 –
Thematic representation of general practitioners’ perspectives on rural oral health

Reporting of health practitioners by their treating practitioner under Australia’s national mandatory reporting law

In 2010, the Australian states and territories adopted a national law requiring health practitioners, employers and education providers to report “notifiable conduct” by health practitioners to the appropriate National Health Practitioner Board through the Australian Health Practitioner Regulation Agency (AHPRA). Notifiable conduct encompasses four behaviours: (1) practising while intoxicated by alcohol or drugs; (2) sexual misconduct during the practice of the profession; (3) placing the public “at risk of substantial harm” because of an impairment; or (3) placing the public at risk because of a “significant departure from accepted professional standards”.1 Details of these rules have been published elsewhere.2,3

The mandatory notification law was received with some concern, particularly by doctors and medical professional bodies.2,4 A particularly controversial aspect was its application to practitioners who, in the course of providing care to another practitioner, form a belief that notifiable conduct has occurred. The versions of the law enacted in Western Australia and Queensland allow certain exemptions for practitioners treating other practitioners, but those in force in the other states do not.3

Critics of extending mandatory reporting to care relationships object to the perceived assault on the time-honoured ethics principle of patient confidentiality; they also worry that it will deter impaired practitioners from seeking assistance.57 Defenders of the rule argue that treating practitioners have a valuable vantage point from which to identify impaired colleagues, and that requiring them to do so protects the public and enhances trust in the health system.8

Our earlier study of 816 mandatory reports received by AHPRA over a 14-month period2 found that around 8% were made by treating practitioners. In recognition of the importance of these “treating practitioner reports” for policy and practice, we collected and analysed additional data on this subset of reports, and the outcomes of their investigation by AHPRA.

Methods

As part of a larger study of mandatory notification,2 we reviewed all reports received between 1 November 2011 and 31 January 2013. Access to the reports was subject to strict conditions guaranteeing privacy and confidentiality, and study team members signed non-disclosure agreements. The study was approved by the Human Research Ethics Committee at the University of Melbourne (reference, HREC 1239183.2).

The examined reports were from all states and territories except New South Wales, and had been lodged with AHPRA either in a notification form available on the AHPRA website or in letter form. The layout and content of the reports have been previously described.2 Although health practitioners in NSW are subject to the same reporting requirements as those in other states, AHPRA has a more limited role in relation to notifications made in NSW.2

The reports were reviewed between April and June 2013 at the AHPRA head offices in Melbourne. Three trained reviewers extracted de-identified information about the statutory grounds for notification, the type of problem reported, and practitioner characteristics and demographics. This information was supplemented with data from the national register of health practitioners, including information on sex, age, practice location, profession, and the specialties of both the reporter and the subject of the report.

All reports lodged by a treating practitioner about a practitioner-patient were flagged for more detailed review; they formed the focus of our analysis.

A senior investigator (MB) examined each flagged report to verify that it had been submitted by a treating practitioner. She also extracted any free text that discussed the health condition treated, the nature of the treatment relationship, the perceived risk, and steps the reporter took before lodging their report.

Using a grounded theory approach,9 two investigators (MB, DS) reviewed a subsample of the extracts and developed a coding scheme for deriving information on six variables from the free text: primary health condition for which the patient was being treated; the reporter–patient relationship; the timing of the risk; impediments to risk reduction; advice sought on reporting obligations; and disclosure to the patient of the intent to report. Using the finalised coding scheme, one investigator and a second, legally trained reviewer independently coded the textual extracts for all reports.

Comparison of the data coding by the two coders found inter-rater reliability that ranged from good to very good, depending on the variable. For example, the kappa (κ) score for the variable “impediments to risk reduction”, which probably involved more implicit judgment than the other variables, was 0.77.

In November 2014, the outcomes of the response by AHPRA to each case were obtained and added to the analytic dataset. This allowed 18 to 36 months to elapse after the report lodgement dates.

Statistical analyses were conducted with Stata 13.1 (StataCorp).

Results

Of 846 mandatory reports made to National Boards through AHPRA during the study period, 64 (8%) were lodged by health practitioners who had a treating relationship with the subject of the report. The others were lodged by non-treating practitioners, managers, employers or educators. All results reported here relate to the treating practitioner reports.

Sample characteristics

A large majority of the reporters (57 of 64) were doctors, and most of the practitioner-patients were nurses (41 of 64) (Box 1). Two-thirds of the reports by doctors were made by psychiatrists (26 of 57) or general practitioners (16 of 57).

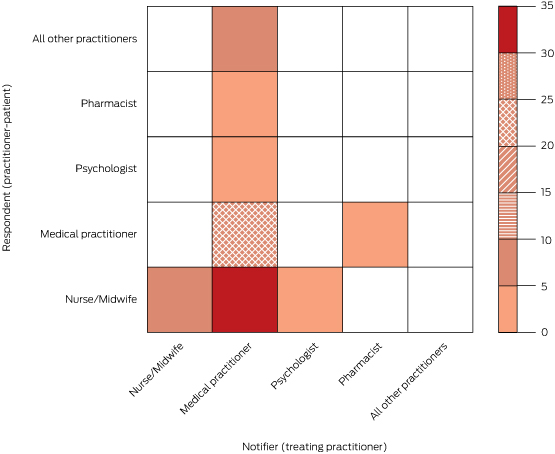
The most common dyads were doctors reporting nurse-patients (35 of 64 cases) and doctors reporting doctor-patients (15 of 64 cases) (Box 2). Nurse reports about nurse-patients were relatively uncommon (5 of 64 cases), although every nurse report involved a nurse-patient.

Grounds for report

Three-quarters of the reports (47 of 64) indicated that the practitioner-patient had placed the public at risk of substantial harm because of an impairment (Box 3). One-fifth of the reports (14 of 64) indicated that the practitioner had practised while intoxicated. Only three reports were triggered by departures from professional standards or sexual misconduct.

Health condition being treated

Practitioner-patients were primarily being treated for mental illnesses (28 of 64), substance misuse disorders (25 of 64) or neurological conditions (9 of 64) (Box 3). The most common forms of mental illness were psychosis, mania and depression. The most commonly misused substances were opiates, benzodiazepines, alcohol and amphetamines.

Nature of treatment relationship

The reporter for one in five reports (14 of 64) was the patient’s regular care provider (Box 4); the others involved treatment encounters with a non-regular care provider. The most common scenario was that the reporter had assumed the role of treating practitioner in the context of an acute presentation to hospital (38 of 64 cases), usually a psychiatric admission (27 of 38 cases). The other scenarios were that the reporter was seeing the patient for the first time (9 of 64 cases) or that the treatment relationship had been established indirectly through an informal corridor consultation (3 of 64 cases).

Other aspects of reports

In most reports (46 of 64 cases), the reporter mentioned discussing the mandatory notification requirement with the patient before the report was lodged. Most reporters (56 of 64) also mentioned that they had sought advice from an indemnity insurer, lawyer, manager or professional peer before making the report.

Twenty-six of the 47 reports of impairment described a risk of harm to the public; 12 of these reports discussed only future risks, six discussed only past risks, and eight discussed both.

Nearly four in five reports (50 of 64) described an impediment to risk reduction. There were four main types of impediment. The most commonly described was that the practitioner-patient lacked insight into the risks posed to patients by conditions such as mania, psychosis, or dementia (29 of 50 cases). A second impediment was deliberate dishonesty with the treating practitioner; this most commonly arose in cases where a practitioner-patient had an addiction and intentionally provided false information to the treating practitioner in an attempt to obtain drugs of misuse (12 of 50 cases). A third impediment was deliberate disregard for treatment advice or patient safety (5 of 50 cases); for example, when a practitioner would not adhere to prescribed medicines or comply with a plan intended to protect patients during the recovery of the treated practitioner. The final impediment to safe management was an ongoing intention to self-harm with medicines that could be obtained in clinical practice (4 of 50 cases).

The 14 reports that did not describe impediments to risk reduction either contained statements indicating that the practitioner-patient had insight into their health condition and was cooperating with treatment (two of these patients had already notified themselves to AHPRA), or there was no relevant information that enabled coding of this variable.

Reponses of reports

By November 2014, National Boards had made a final decision on 86% of the treating practitioner reports (55 of 64). Boards took immediate action in 19 cases. Immediate action is a formal measure that involves placing interim restrictions on practice; it is imposed when this is considered necessary to protect the public pending further investigation.

The final outcomes were: no further regulatory action by a Board (24 of 55 cases); voluntary agreements with the Board and AHPRA regarding appropriate monitoring, treatment or practice restrictions (16 of 54); imposition of formal conditions on the practitioner’s licence (12 of 55); a fine or formal reprimand (2 of 55); and referral to another body for resolution (1 of 55). Although the most common adjudication was to take no further action, it would be erroneous to infer that reports with this outcome were inappropriate or unfounded; steps may have been taken to redress a legitimate concern after the report had been lodged and before the Board’s final decision.

Discussion

Our study of mandatory reports of notifiable conduct by treating practitioners found that 90% were made by doctors, usually psychiatrists or general practitioners, and were typically related to a practitioner-patient who was experiencing mental illness, substance misuse problems or a neurological condition. Relatively few reports were made by regular care providers. Most reports were linked with situations in which the treating practitioner was struggling to safely manage the risk that the practitioner-patient posed, and reporters usually discussed the report with the patient before submitting it.

Australia’s requirement that treating practitioners notify regulators of practitioner-patients with impairments is not unprecedented. New Zealand has required health practitioners to report impaired peers since 2003,10 and several American states have mandatory reporting obligations that extend to treating practitioners.11 However, the Australian legislation is unusually far-reaching in two respects. First, it imposes a duty to report not only health impairments, but also certain concerns about performance. Second, it does not explicitly shield treating practitioners from the obligation to report if the practitioner-patient is participating in an approved program of treatment.

Opponents of mandatory reporting argued that the new requirements would open the floodgates to over-reporting.2 This has not occurred. Mandatory reports are rare events,2 and mandatory reports by treating practitioners are especially infrequent — so infrequent, in fact, that under-reporting is probably a more justifiable concern.

The prevalence of impairment in the health workforce is unknown, but conservative estimates suggest that at least 1000 doctors (about 1% of Australia’s 90 000 registered medical practitioners) are impaired in their ability to practise at some stage in the course of any given year.1214 Our 15-month sample contained reports on only 16 doctors, and only 20% of the reports were made by the practitioner-patient’s usual care provider. Previous research in the United States and New Zealand suggests that under-reporting of impaired colleagues is widespread,15 even in the context of mandatory reporting laws. Barriers are likely to include loyalty to colleagues, concerns about over-reacting to a situation, and uncertainty about the reporting obligation.1618

A second objection to the extension of mandatory reporting into the patient–doctor relationship is that it breaches a cornerstone of medical ethics: patient confidentiality. However, the duty to maintain patient confidentiality is not absolute. It is widely accepted that it should yield to obligations to report serious problems or risks that come to light during treatment, including certain infectious diseases, health conditions that imperil driving, and signs of child abuse.19 Whether impairments that pose risks to safe clinical practice are so different from these accepted forms of reporting is debatable. Addressing this issue is beyond the scope of our study, but several aspects of our findings should inform the debate. In particular, the infrequency of treating practitioner reports and the perceived seriousness of the impairments disclosed make it difficult to distinguish the risks associated with practitioner-patient impairment from those of other accepted categories of mandatory reporting by treating practitioners.

Perhaps the most serious charge levelled at the mandatory reporting of practitioner-patients is that it will discourage medical practitioners from seeking assistance.5 This objection involves an empirical question: do the harms that result from treatment foregone because of the law exceed the harms averted by identifying impaired practitioners who would not otherwise have been recognised? Such counterfactuals are difficult to assess. Anecdotal reports suggest that the Doctors’ Health Advisory Services in some states experienced a decline in referrals after the law was enacted.6 But it is not clear whether there was a net decrease across all relevant health services; the question of causality is even less certain. Further, the deferred treatment argument presumes that impaired practitioners would still seek care in the absence of the possibility that they might be reported, but the available evidence suggests that health practitioners may have been reluctant to do so even before the introduction of the law.17,20

When discussing concerns about seeking help, it is worth noting how the reporting behaviour by treating practitioners observed in our study deviated from the exact requirements of the law. The statutory duty to report refers to a past risk of harm and, unlike mandatory reporting programs elsewhere, there is no safe harbour for cases where a practitioner-patient subsequently seeks care and takes appropriate steps to protect patient safety. The pattern of reporting we observed did not correspond with these legal requirements. When explaining their decision to report, treating practitioners were more likely to refer to a future risk of harm than to a past risk. Further, treating practitioners frequently emphasised factors that reduced their ability to work with the practitioner-patient to mutually manage the risk to the public (eg, the patient’s lack of insight, dishonesty or recklessness). Caution is required when making inferences about notifiable conduct that was not reported on the basis of what was reported, but these aspects of the reports, coupled with the very low overall rate of reporting, clearly suggest that treating practitioners resisted reporting their practitioner-patients in circumstances where their treatment was on an appropriate and promising path.

Our study has three main limitations. First, we were unable to directly measure over- and under-reporting. Second, Australia’s mandatory reporting law was implemented in concert with a variety of other major changes to health practitioner regulation, so it was not feasible to assess changes in the rate or nature of treating practitioner reports before and after the introduction of the new law. Finally, we relied on information provided in the reports for most of the variables of interest. To save time or protect confidentiality, some treating practitioners may have omitted or altered salient details. Consequently, the counts we report, particularly for variables that relied on being mentioned in the reports, should be interpreted as lower bound estimates.

Much of the policy debate on the merits of mandatory reporting by treating practitioners has been based on certain implicit assumptions. The standard narrative involves an impaired patient who recognises their illness and seeks treatment from their usual care provider, who must then reluctantly take the contentious step of reporting their patient. Our findings suggest a different picture. The debate should acknowledge several realities. In particular: treating practitioner reports are rare, very few are made in the context of an established treatment relationship, and they tend to occur in situations where there is an identified impediment to safely managing a future risk of harm within the confines of the treating relationship.

Box 1 –
Characteristics of treating practitioners and practitioner-patients involved in mandatory reports

Practitioner making the notification (treating practitioner)

Practitioner subject to the notification (practitioner-patient)


Total number

64

64

Profession

Medical practitioner

57

16

Nurse

5

41

Pharmacist

1

2

Psychologist

1

1

Other*

0

4

Status

Practitioner

64

59

Student

0

5

Sex

Male

40

20

Female

23

44

Data missing

1

0

Mean age (range), years

46 (24–62)

41 (20–81)


* Dentist, physiotherapist, medical radiation practitioner.

Box 2 –
Frequency of notifications, by professions of treating practitioner and practitioner-patient

Box 3 –
Statutory grounds for reporting, and health conditions mentioned, for 64 mandatory reports by treating practitioners

Statutory grounds for report

Number of reports


Have an impairment

47

Practised while intoxicated

14

Departure from professional standards

2

Sexual misconduct

1

Health condition being treated


Mental illness

28

Psychosis/mania

16

Depression/attempted suicide

10

Eating disorder

1

Obsessive–compulsive disorder

1

Substance misuse

25

Opiates

8

Benzodiazepines

6

Alcohol

5

Amphetamines

5

Other (cannabis, cocaine or LSD)

3

Neurological condition

9

Dementia/cognitive impairment

7

Seizures

2

Unclear

2


Box 4 –
Relationship between treating practitioner and the practitioner-patient for 64 mandatory reports by treating practitioners

Treating relationship of reporting practitioner to practitioner-patient

Number of reports


Regular care provider

14

General practice

9

Psychiatry practice

4

Infectious disease practice

1

Non-regular care provider

50

Acute care provider

38

Psychiatric admission

27

General medical admission

2

Emergency department admission

9

First assessment

8

Psychiatrist

4

Physician

3

Pharmacist

1

Psychologist

1

Informal consultation with colleague

3


Vitamin D testing: new targeted guidelines stem the overtesting tide

Bilinski and Boyages have previously reported that the frequency of vitamin D testing had risen dramatically in Australia between 2000 and 2010.1,2 Further, testing did not translate to improved health outcomes.3 Since that report,1 Medicare Benefits Schedule (MBS) expenditure on vitamin D testing rose from $109.0 million in the 2009–10 financial year to $151.1 million in 2012–13, falling slightly in 2013–14 to $143.1 million.

An MBS review for vitamin D testing in 2014 recommended targeted testing for high-risk groups only, and against population screening.3 High-risk patients include those with osteoporosis, osteomalacia, disorders of calcium and parathyroid hormone, malabsorption, chronic renal disease, patients with darker pigmented skin or reduced sun exposure, those under 16 years of age and patients taking drugs known to reduce vitamin D levels. Five new Medicare item numbers (66833, 66834, 66835, 66836 and 66837) were introduced in November 2014 to replace the two previous numbers (66608 and 66609) and improve quality use of testing. This report analyses data from the Medicare statistical reporting tool for the first 8 months (November 2014 to June 2015) since the introduction of the new MBS numbers and guidelines.

The present study found that there had been a marked reduction in benefits paid for vitamin D testing (Box). In absolute terms, there was a saving of about $39.46 million (an average fall of 42%) compared with the same time period the year before. The greatest fall occurred in the summer month of February 2015 but the trend continued in the winter months. The number of services for vitamin D per 100 000 population fell from 18 140 in 2013–14 to 14 415 in 2014–15. The savings to the end of the 2014–15 financial year equate to about $42 million and, if the trend continues (ie, a reduction of 42%), the annual savings will be close to $64 million, reducing the annual spend to $60 million.

The new policy has almost halved expenditure in a short period of time and, if sustainable, will result in a large amount of funds to be reinvested. Before this intervention there had been an unsustainable growth in vitamin D testing. This report highlights the impact of various strategies including analysis of general practitioner test-ordering patterns and quality use of pathology testing policy based on good clinical practice and evidence-based medicine. The report highlights the value of regular monitoring and publication of all high-cost and high-volume pathology test item numbers, which will allow professional societies as well as individual clinicians to monitor trend data to look for opportunities to reinvest the scarce health dollar. New real-time business intelligence and Big Data tools have made this task easier.4

The study is limited by the nature of the MBS data, which capture only the number and dollar benefit of service. Further, patient-level data analysis could shed light on appropriateness of testing.

Although a large proportion of Australians (between 31% and 58%) are estimated to have vitamin D deficiency (defined as serum 25-hydroxyvitamin D levels < 50 nmol/L5), according to season, moderate to severe deficiency is uncommon and only present in about 4% of people.2,6 The new testing requirements should allow better targeting of those at greatest risk and those who will benefit most.

Box –
Medicare benefits paid for all vitamin D testing in Australia: July 2013–June 2015

2013–14* ($)

2014–15 ($m)

Difference ($)

Difference (%)


July

12 772 332

10 901 057

−1 871 275

−14.7

August

11 713 108

10 840 342

−872 766

−7.5

September

12 958 166

14 157 002

1 198 836

9.3

October

12 306 916

11 422 808

−884 108

−7.2

November

11 661 161

9 744 773

−1 916 388

−16.4

December

12 265 479

7 653 015

−4 612 464

−37.6

January

8 276 481

5 133 015

−3 143 466

−38.0

February

13 777 880

6 294 101

−7 483 779

−54.3

March

12 315 477

7 097 905

−5 217 572

−42.4

April

11 416 530

6 301 455

−5 115 075

−44.8

May

12 454 074

5 954 850

−6 499 224

−52.2

June

11 207 630

5 732 827

−5 474 803

−48.8

Total

143 125 234

101 233 150

−41 892 085

−29.3


* MBS item numbers 66608 and 66609. † MBS item numbers 66833, 66834, 66835, 66836 and 66837 for November 2014 to June 2015, and 66608 and 66609 for July 2014 to October 2014, and then drop effectively to zero in the remaining months.