×

Government faces ballot box pain if no policy shift

The Federal Government could pay a hefty price at the ballot box unless it changes course on health policy, the AMA President Professor Brian Owler has warned.

As senior Ministers thrash out details of the all-important pre-election Budget behind closed doors, Professor Owler cautioned that how the Government responds to the many reviews it has commissioned across health, particularly regarding Medicare, primary health and private health insurance, “may well have a significant electoral impact, especially if key health stakeholders are not properly engaged”.

Professor Owler called for a fundamental shift away from the Government’s current emphasis on cutting spending and offloading the funding burden onto patients and the states and territories.

 “The Government is on a path of funding cuts and shifting costs to patients,” the AMA President said. “This is not good for the Australian health system or the health of Australians.

He urged it to “change tack…before it is too late”, warning the Government its current approach might m.

Professor Owler’s comments framed the AMA’s Pre-Budget Submission, which includes detailed recommendations across 18 areas of health policy, from Medicare indexation and reform of hospital funding to GP infrastructure grants, palliative care, alcohol and tobacco policy and immunisation.

The AMA President said the submission gave the Government a guide on how to recalibrate its policy to end the current retreat from core responsibilities in funding and delivering health services.

“There is an urgent need to put the focus back on the strong foundations of the health system,” Professor Owler said. “We need a strong balance between the public and private system, properly funded public hospitals, strong investment in general practice, and a priority put on prevention.”

There are already signs that Government decisions are having an adverse effect on health services.

The AMA Public Hospital Report Card released in late January showed that improvements in hospital performance have stalled, and in some instances have gone backwards, since the Government’s decision to 2014 to rip hundreds of millions of extra funding out of the system.

Professor Owler said the cuts, combined with a downshift in the indexation of Commonwealth hospital funding from next year, showed the Government’s preoccupation with funding cuts came at the expense of good health policy.

The Government’s response to the mental health review provided more worrying signs of how it might approach other areas of reform, he said.

Under the new approach, Primary Health Networks will be paid by the Commonwealth to provide tailored “integrated care packages” for patients with mental health problems.

Professor Owler said there was no commitment to a key role for GPs in providing care, and the Government had provided scant other detail.

“The worry is that the mental health approach may be a signal for what is to come with the Primary Health Review,” he said, and added that a proposal for hospital funding to be replaced by a Medicare-style “hospital benefit payment” that would follow patients was also a worrying sign.

The AMA President said the Government had actively demonised doctors in its MBS review process, had encouraged private health funds to play a more active role in all areas of health despite concerns over inappropriate behaviour and poor value products, and showed signs of pursuing a US-style managed care system.

He warned that “this is not a health policy platform to take to a Federal election”.

In its 27-page Budget submission, the AMA proposed the Government immediately reinstate indexation of Medicare rebates; increase indexation of public hospital funding to a rate that reflects growth in the cost of health goods and services; recognise the both the Commonwealth and the state and territories all have a role in funding and providing health services; explicitly address the role of the private sector in delivering care; and give patients the right to assign their Medicare benefit direct to the provider.

Professor Owler said the nation needed a health system built on “modern health policies, not outdated economic policies designed only to improve the bottom line”.

Adrian Rollins

Acute heart failure admissions in New South Wales and the Australian Capital Territory: the NSW HF Snapshot Study

Heart failure (HF) is a major burden on the health care system, and much of this burden is associated with the high rates of admission to hospital for managing episodes of acute decompensation. Based on the expected rise in the number of patients with HF as the population ages, it is likely that the use of hospital resources will continue to increase.1 Detailed data on hospital admissions for HF are therefore of considerable interest, including measures of morbidity, case load and costs related to HF.

Despite the importance of national data for quantifying HF and understanding its management and outcomes, such data are not currently available. Lack of funding, difficulties with case definition, and cross-jurisdictional problems have contributed to this failure.2 To facilitate a national approach to understanding HF and improving outcomes, the New South Wales HF Snapshot therefore sought to provide detailed representative data on hospital admissions for acute HF.

Methods

The NSW HF Snapshot was a prospective audit of consecutive patients who presented with acute HF and were admitted to 24 public hospitals (13 metropolitan and 11 rural) in NSW and the Australian Capital Territory during a one-month period. Each hospital had an attending cardiologist who was responsible for confirming the admission diagnosis. The snapshot methodology was based on a similar audit of patients with acute coronary syndrome.3

Data were collected from patient interviews, case note reviews and electronic database review. A two-page paper-based case report form with a standardised completion note captured key demographic and clinical data for each patient. To standardise case and data definitions, two face-to-face meetings with representatives from all participating hospitals were held before conducting the snapshot study.

The snapshot investigation was approved by the St Vincent’s Hospital Human Research Ethics Committee (reference number, LNR/13/SVH/84). All 24 hospitals who participated had received institutional governance approval. An opt-out consent approach was adopted to maximise the likelihood of capturing all patients admitted to the participating hospitals. The ethics approval for the investigation did not include the capture of data from non-participating hospitals, so the admission and discharge data for patients who had been transferred from or discharged to a non-participating hospital were based on the first and last available results at the participating hospital.

Patient eligibility

Patients were eligible to participate in the study if they were admitted to a participating hospital between 9 am on 8 July 2013 and 9 am on 8 August 2013, and had presented with first onset HF or acute decompensation of chronic HF. The admission diagnosis was based on clinical symptoms, signs and investigations consistent with acute HF, as determined by the site investigator.4

Measures

Patient data collected included demographic characteristics, medical history, clinical findings at presentation, clinical management (including pathology and cardiac investigations), acute treatment, admission and discharge medications, length of stay, and outcome of hospitalisation (including in-hospital mortality and clinical status at discharge). Classification as HF with reduced ejection fraction (HFREF) or HF with preserved ejection fraction (HFPEF) was based on the most recent assessment of left ventricular ejection fraction (LVEF), with an LVEF of at least 50% the criterion for HFPEF. Information on specific comorbidities was collected, as were data for the updated Charlson Comorbidity Index.5 Frailty was measured with the Survey of Health, Ageing and Retirement in Europe Frailty Index.6 In addition to patient-level data, all hospitals were asked to complete a survey describing their model of care, clinical service availability, and workforce characteristics. Hospitalisation and mortality outcomes were collected 30 days and 12 months after discharge by telephone follow-up and hospital electronic database review; these data will be reported in a separate article.

Statistical analyses

Dichotomous variables are reported as numbers and percentages, and were compared using either χ2 tests or Fisher exact tests. Continuous variables are reported as means and standard deviations or as medians and interquartile ranges. Between-group analyses (HFPEF v HFREF) tested differences in demographic and clinical characteristics. As the evidence base for pharmacotherapy in HFREF is derived primarily from trials in patients with an LVEF < 40%, we compared the rate of pharmacotherapy in patients with an LVEF ≥ 40% or < 40%. Patients for whom LVEF was not reported were excluded from the between-group comparisons. Further analyses compared de novo HF and decompensated HF patients.

Results

Baseline demographic factors

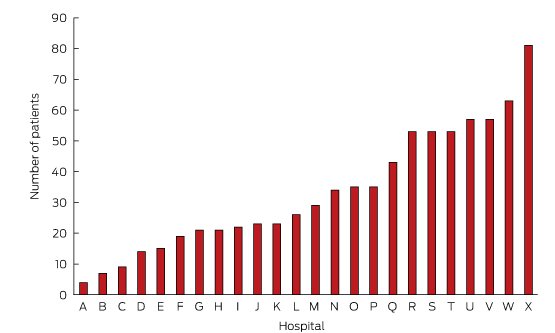
In total, 811 patients were recruited. The average number recruited per site was 34 (range, 4–81; Box 1). Their mean age was 77 ± 13 years; most were men (58%) and born in Australia (59%). The majority (68%) had experienced HF prior to their admission during the study period. Most patients presented with comorbidities, including ischaemic heart disease (56%), renal disease (55%) and diabetes (38%). The median Charlson Comorbidity Index score was 3. The most frequently attributed HF aetiologies were ischaemic heart disease (43%) and hypertension (25%).

Fifty-eight per cent of the patients presented with HFREF, 42% with HFPEF. Patients who presented with HFPEF were on average older, and were more likely than those with HFREF to be female and have hypertension as the antecedent cause for HF (each P < 0.001). The Charlson Comorbidity Index scores were similar in the two groups, but the distribution of comorbidities was different; there were higher rates of pulmonary disease in the HFPEF patients (P = 0.015) and of ischaemic heart disease in HFREF patients (P < 0.001). Seventy patients (9%) had an implantable cardioverter-defibrillator (including 61 patients with HFREF), and 133 (17%) had permanent pacemakers (Box 2).

The most frequently identified precipitants of admission were infection (22%) and non-adherence to medication (5%) or to dietary or fluid restrictions (16%). The first recorded rhythms on admission were sinus rhythm (42%) and atrial fibrillation/flutter (42%). Patients with HFPEF were significantly more likely to be in atrial fibrillation than those with HFREF (48% v 36%; P = 0.047). The mean first recorded blood pressure was 136 ± 33/77 ± 36 mmHg. Those with HFPEF had a significantly higher systolic blood pressure at admission (P < 0.001).

Admission pathway

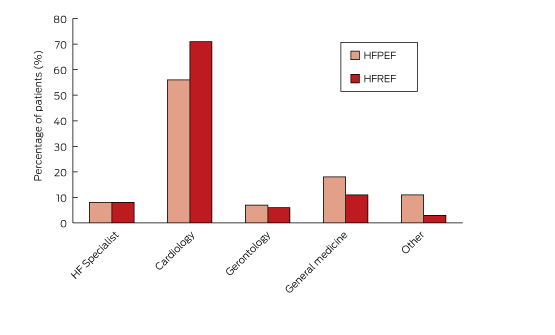
Most patients (93%) were admitted after an emergency department presentation. The breakdown according to admitting specialties is shown in Box 3. Eight per cent of patients were admitted to a dedicated HF service, 62% to a general cardiology unit, 16% to a general medical unit, and 8% to a geriatric service. Patients with HFREF were more likely to be admitted to a cardiology service, whereas HFPEF patients were more likely to be admitted to a general medical unit.

Treatment received during admission

Box 4 summarises the treatments received by patients during their hospital stay. The most common therapies were oxygen therapy (87%) and intravenous diuretics (81%). Intravenous inotropic agents and glyceryl trinitrate were administered to 8% and 7% of patients respectively. Non-invasive ventilation was used for 17% of patients. Apart from oxygen therapy (89% v 83%; P = 0.013) and inotropic infusions (10% v 6%; P = 0.032), there were no statistically significant differences in the treatment received by patients with HFREF and HFPEF.

Pharmacotherapy

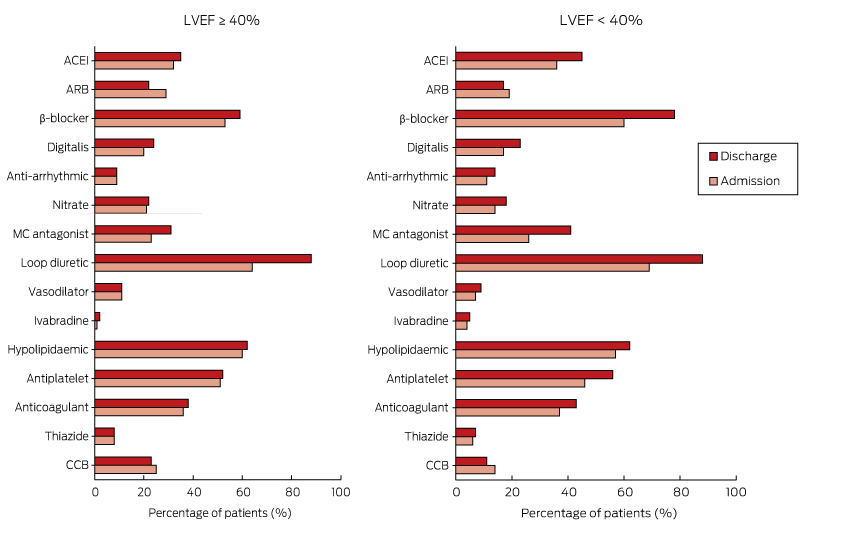
Box 5 shows the proportion of patients receiving cardiovascular pharmacotherapy at admission and discharge for those with an LVEF ≥ 40% or < 40%. With the exception of loop diuretics (64% at admission v 88% on discharge; P < 0.001), there was little or no change in medication use between admission and discharge for those with an LVEF ≥ 40%. There was increased prescription of loop diuretics (69% at admission v 88% on discharge; P < 0.001) and mineralocorticoid antagonists (26% v 45%; P = 0.010) for patients with an LVEF under 40%, and also a non-significant increase in the use of β-blockers (60% v 78%; P = 0.065).

For patients presenting with de novo HF and an LVEF < 40%, there was increased prescription of angiotensin-converting enzyme inhibitors (ACEIs)/angiotensin receptor blockers (ARBs) (42% at admission v 66% on discharge; P = 0.002). However, the prescription of ACEIs/ARBs for those with decompensated HF declined from 58% to 47% (P = 0.010).

For patients with de novo HF, the frequency of combination therapy (ACEIs/ARBs with β-blockers: 24% to 60%) and triple therapy (ACEIs/ARBs, β-blocker and mineralocorticoid antagonist: 4% to 19%) increased between admission and discharge. In patients with decompensated HF, there was no change in the frequency of either double (43% v 45%) or triple therapy (16% v 21%). The total daily diuretic dose (frusemide equivalent) at discharge was 75 ± 72 mg. At discharge, patients were taking an average of 10 ± 4 agents a day, requiring them to swallow 13 ± 7 pills each day.

Pre-discharge clinical status and discharge outcome

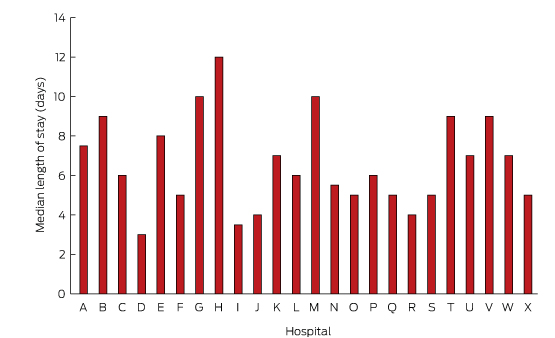
Forty-five patients (6%) died during the index admission. Of 766 patients who survived to discharge, 557 (73%) underwent frailty assessment, of whom a large proportion (71%) were assessed as being frail. On discharge, the condition of most patients (83%) was classified as New York Heart Association class II (mild symptoms) or III (marked limitations of activity) (Box 6). The median length of stay was 6 days for patients who survived to discharge, and 7 days for those who died during admission. As shown in Box 7, the median length of stay ranged between 3 and 12 days for individual hospitals. Most patients (74%) were discharged home. Just over half the patients (59%) were referred to a multidisciplinary HF service.

Discussion

The NSW HF Snapshot provides a unique window onto the characteristics of patients admitted with acute HF to public hospitals in urban and rural NSW and the ACT. The opt-out approach to patient consent enabled consecutive patients to be enrolled, limiting selection bias and providing a real world picture of patients and their care.

The mean age of patients enrolled in the NSW HF Snapshot was greater than that of patients enrolled in other international HF registries,717 although it was comparable with that of patients from Australian sites that participated in the Acute Decompensated Heart Failure Registry — Asia Pacific (ADHERE-AP).18 The patients were also similar in many other key demographic and clinical characteristics to those in ADHERE-AP. It is encouraging that the proportion of patients who had an echocardiogram in our study was much higher than reported in previous Australian studies.18,19

The most common precipitants of acute HF identified were infection and non-adherence to medications or to dietary or fluid restrictions, each of which accounted for about one-fifth of hospitalisations. Similar rates for these precipitants have been reported by other registries.7,20 The high rate of infection-related HF is consistent with the fact that the snapshot was conducted during mid-winter. We did not record immunisation history, but this would be a valuable addition to a future survey. The high rate of non-adherence as a precipitant is disappointing, but underscores the critical need for disease management interventions.21 The prevalence of atrial fibrillation or flutter on admission was higher than recorded by most acute HF registries, and may be partly explained by the older age of patients in the NSW HF Snapshot. Interestingly, although atrial fibrillation/flutter was detected in 42% of patients on admission, it was thought to have been the precipitant of HF in only 15% of patients.

In-hospital pharmacotherapy was similar to that reported by other major international acute HF registries,17,18,22 highlighting the lack of new therapies for acute HF. Intravenous vasodilators and inotropic agents were each administered to less than 10% of patients, consistent with recent international trends finding that use of these therapies is declining.23,24 The frequency of mechanical ventilation support (mainly non-invasive) was about 20%, similar to figures reported by international HF registries.7,9,23

The rate of prescription at admission of ACEIs/ARBs for patients with decompensated HF and an LVEF < 40% was similar to rates reported by other international registries,22 and indicated considerable shortfalls compared with their recommended use.25 We did not ascertain the reasons for which patients were not prescribed particular agents, so we can only speculate as to why there was reduced prescribing of these agents at discharge for patients with decompensated HFREF. This group may have included patients who had not responded to the agents during their admission, or who had experienced adverse events or other signs of real or perceived contraindications. While this may partly explain the underprescribing of evidenced-based HF therapy, our data suggest that the uptake of evidence-based recommendations can be improved.

An innovative aspect of the NSW HF Snapshot was the assessment of frailty prior to discharge. There are several factors that may explain the high prevalence of frailty. HF and frailty may share common pathways, including risk factors and inflammatory processes that can manifest as cachexia, which is also associated with frailty.26 We chose to use a simple measure of frailty, consisting of five questions and a measure of handgrip strength.6 This was, however, developed for primary care settings, so we cannot rule out the possibility that we overestimated the prevalence of frailty. Our data are among the first to report the prevalence of frailty in patients admitted to hospital with HF.

The variation in the length of stay could be explained by a number of factors. The NSW HF Snapshot was conducted across a broad range of institutions, from small rural hospitals to large tertiary referral centres. Variations in patient mix, available resources, and admitting speciality are just some of the factors that may have contributed to the variation. Future analyses will explore the impact of these and other factors on the length of stay.

Disease registries provide a valuable tool for capturing data over time, and allow for the evaluation of the quality of care and outcomes. Ideally, a registry would capture all relevant patients, but for common conditions, such as HF, this is usually not the case. A major criticism of registries is that they are expensive and labour-intensive to run and maintain. The snapshot methodology allows for a comprehensive although brief picture of contemporaneous usual care practice. Simultaneous inclusion of a wide range of acute facilities, ranging from tertiary urban referral centres to small rural and district hospitals, helps to ensure a real world representation of patients with acute decompensated HF.

Although this was the first population-based point prevalence survey of acute HF admissions in Australia, several limitations must be acknowledged. Hospitals were invited to participate, and all sites were teaching hospitals with staff cardiologists, and may therefore not be representative of remote facilities or hospitals without an on-site cardiologist. As the case report form consisted of only two pages, it was not possible to collect detailed information in all fields, such as echocardiography results and the aetiology of HF. As we were unable to collect data from non-participating institutions, the length of stay for patients transferred from or to another facility may have been underestimated. Finally, the NSW HF Snapshot was conducted during a one-month period during the Australian winter; as some risk factors may vary seasonally, our survey may not accurately reflect patterns of admission and care throughout the year.

Conclusion

The NSW HF Snapshot has highlighted the advanced age and multiple comorbidities of patients admitted to NSW and ACT hospitals with acute HF, and the high prevalence of frailty in these patients. The use of evidence-based therapies for patients with decompensated HF, particularly ACEIs and β-blockers, was less than optimal, and there was little evidence that these therapies were introduced during the patients’ stays in hospital. The extent to which patient, institutional and system characteristics contribute to variations in care and outcomes is being explored in further analyses. We anticipate that the results of the NSW HF Snapshot will inform the development of strategies for improving access to multidisciplinary care programs and increasing the uptake of evidence-based therapies.

Box 1 –
Number of patients recruited at each hospital for the NSW Heart Failure Snapshot study*


* Each site was assigned an alphabetic code to preserve anonymity, with the smallest site labelled A and the largest X.

Box 2 –
Baseline demographic characteristics, past medical history, clinical findings at presentation and cardiac investigations for the 811 study participants*

Total sample

HFREF

HFPEF

P


Number of patients

811

433

318

Demographic characteristics

Sex (men)

465 (58%)

295 (69%)

146 (46%)

< 0.001

Age, years (mean ± SD)

77 ± 13

75 ± 14

79 ± 12

< 0.001

Lives alone

272 (35%)

151 (36%)

101 (33%)

0.328

Nursing home resident (at time of admission)

80 (11%)

38 (10%)

33 (11%)

0.501

Born in Australia

472 (59%)

255 (59%)

182 (57%)

0.502

Past medical history

Previous chronic heart failure

540 (68%)

306 (72%)

194 (62%)

0.008

Ischaemic heart disease

445 (56%)

265 (62%)

152 (49%)

< 0.001

Renal disease

433 (55%)

256 (54%)

177 (57%)

0.601

Diabetes

304 (38%)

165 (39%)

120 (39%)

0.211

Pulmonary disease

251 (32%)

117 (29%)

113 (37%)

0.015

Charlson Index score (median [IQR]; range)

3 [2–5]; 0–16

3 [2–5]; 0–16

3 [2–5]; 0–14

0.914

Heart failure aetiology

Hypertension

204 (25%)

85 (20%)

104 (33%)

< 0.001

Ischaemic heart disease

346 (43%)

233 (54%)

90 (28%)

< 0.001

Cardiomyopathy

121 (15%)

93 (22%)

24 (8%)

< 0.001

Other

236 (29%)

87 (20%)

133 (42%)

< 0.001

Implantable cardioverter-defibrillator

70 (9%)

61 (15%)

6 (2%)

< 0.001

Permanent pacemaker

133 (17%)

86 (20%)

40 (13%)

0.008

Echocardiogram

701 (96%)

405 (96%)

296 (96%)

0.781

Clinical findings at presentation

Precipitant for admission

0.047

Ischaemia

98 (13%)

71 (16%)

27 (9%)

Infection

169 (22%)

95 (21%)

74 (25%)

Rhythm abnormality

112 (15%)

63 (14%)

49 (16%)

Non-adherence to medication

41 (5%)

21 (5%)

20 (7%)

Non-adherence to dietary or fluid restrictions

124 (16%)

82 (18%)

42 (14%)

Other

214 (28%)

127 (28%)

87 (29%)

Rhythm on admission

0.004

Sinus rhythm

330 (42%)

183 (44%)

124 (40%)

Atrial fibrillation/flutter

330 (42%)

152 (36%)

149 (48%)

Systolic blood pressure on admission, mmHg (mean ± SD)

136 ± 33

132 ± 33

141 ± 32

< 0.001

Diastolic blood pressure on admission, mmHg (mean ± SD)

77 ± 36

79 ± 43

75 ± 20

0.248


HFREF = heart failure with reduced ejection fraction; HFPEF = HF with preserved ejection fraction; IQR = interquartile range; SD = standard deviation. * Left ventricular ejection fraction was not reported for 60 patients; the data for these patients were included in the total sample analysis, but not in the separate analyses of the HFREF and HFPEF groups. † Investigators were asked to record whether subjects had undergone echocardiography either during the index admission or prior to admission as part of the investigation for clinically diagnosed heart failure.

Box 3 –
The admitting specialties for the 811 study participants


HF = heart failure; HFREF = heart failure with reduced ejection fraction; HFPEF = heart failure with preserved ejection fraction.

Box 4 –
Therapy received by the study participants during their hospital stay*

Total sample

HFREF

HFPEF

P


Number of patients

811

433

318

Intravenous diuretics

643 (81%)

342 (81%)

250 (80%)

0.824

Intravenous glyceryl trinitrate

53 (7%)

26 (6%)

22 (7%)

0.670

Oxygen therapy

673 (87%)

369 (90%)

254 (83%)

0.008

Intravenous inotrope

63 (8%)

42 (10%)

17 (6%)

0.023

Dialysis

16 (2%)

9 (2%)

7 (2%)

0.964

Intra-aortic balloon pump/extracorporeal membrane oxygenation

8 (1%)

7 (2%)

1 (0%)

0.081

Continuous positive airways pressure/bimodal positive airways pressure

133 (17%)

73 (18%)

50 (16%)

0.573

Cardiopulmonary resuscitation

21 (3%)

12 (3%)

7 (2%)

0.578

Mechanical ventilation

29 (4%)

18 (4%)

8 (3%)

0.186

Referred for heart transplant assessment

17 (2%)

13 (3%)

4 (1%)

0.101

Referred to multidisciplinary care team

458 (59%)

261 (63%)

173 (56%)

0.055


HFREF = heart failure with reduced ejection fraction; HFPEF = heart failure with preserved ejection fraction. * Left ventricular ejection fraction was not reported for 60 patients; the data for these patients were included in the total sample analysis, but not in the separate analyses of the HFREF and HFPEF groups.

Box 5 –
Admission and discharge pharmacotherapy for patients with left ventricular ejection fraction (LVEF) ≥ 40% or LVEF < 40%


ACEI = angiotensin-converting enzyme inhibitor; ARB = angiotensin receptor blocker; CCB = calcium channel blocker; MC antagonist = mineralocorticoid receptor antagonist.

Box 6 –
Pre-discharge frailty assessment, New York Heart Association status, and discharge outcome*

Pre-discharge assessment

Total sample

HFREF

HFPEF

P


Frailty (n = 557)

0.038

Not frail

45 (8%)

29 (9%)

13 (6%)

Pre-frail

115 (21%)

76 (24%)

35 (17%)

Frail

397 (71%)

214 (67%)

164 (77%)

New York Heart Association class (n = 706)

0.103

Class I

70 (10%)

26 (7%)

33 (12%)

Class II

368 (52%)

208 (55%)

145 (52%)

Class III

220 (31%)

117 (31%)

86 (31%)

Class IV

48 (7%)

30 (8%)

15 (5%)

Outcome (n = 783)

Discharged home

582 (74%)

352 (75%)

230 (74%)

0.271

Discharged to residential aged care facility

71 (9%)

36 (8%)

35 (11%)

Transferred to another medical facility

85 (11%)

56 (12%)

29 (9%)

Died

45 (6%)

28 (6%)

17 (6%)


HFREF = heart failure with reduced ejection fraction; HFPEF = heart failure with preserved ejection fraction. * Left ventricular ejection fraction was not reported for 60 patients; the data for these patients were included in the total sample analysis, but not in the separate analyses of the HFREF and HFPEF groups. † Reduced numbers are the result of missing data in the case report forms for these data items. New York Heart Association class was recorded only for hospital survivors.

Box 7 –
Median length of hospital stay*


* Each site was assigned an alphabetic code to preserve anonymity, with the smallest site labelled A and the largest X.

Socio-demographic and structural barriers to being tested for chlamydia in general practice

General practice is at the forefront of health care in Australia, with more than 85% of the Australian population consulting a general practitioner each year.1 Preventive health care is an important activity in general practice, and includes the prevention of illness, the early detection of infection or disease, and the promotion and maintenance of health.2 While prevention is key to Australia’s future health, it is also critical in redressing the health disparities experienced by disadvantaged and vulnerable populations.

Chlamydia screening is a key preventive care activity for young Australian adults. Guidelines recommend that sexually active men and women aged 15–29 years have an annual chlamydia test,2 but less than 10% of this age group are screened each year in general practice.3 There are well documented barriers to the uptake of chlamydia screening, from the perspective of both the GP and the patient. For GPs, these barriers include time, lack of awareness or knowledge about chlamydia, lack of support for partner notification, and concern about embarrassing their patient.4,5 For patients, barriers include the cost of the GP consultation and the chlamydia test, availability of transport to the clinic, lack of knowledge about the need for testing, the location of the pathology collection site, embarrassment or unease about providing a specimen, and, for those living in rural and remote areas of Australia, fears about confidentiality, the lack of female GPs, and health care availability.612

The Australian Government funded a chlamydia screening trial in 2009 to determine whether annual chlamydia testing in general practice for 16–29-year-old men and women would reduce the population burden of chlamydia.13 As part of this ongoing trial, clinics in the intervention group have provided a multifaceted intervention designed to facilitate increased chlamydia testing.

We found in an earlier study that not all patients will follow through and have a chlamydia test when a GP requests one.14 Our trial provided the opportunity to investigate factors associated with not having a test after it has been requested by a GP. Further, our findings can be extrapolated to other preventive health activities in general practice where tests are requested.

Methods

Setting

The Australian Chlamydia Control Effectiveness Pilot (ACCEPt) is a cluster randomised controlled trial of a chlamydia testing intervention in general practice that commenced in mid-2010 and will be completed in late 2015. All 134 GP clinics in 54 rural and regional towns in Victoria (18 towns), New South Wales (21), South Australia (four) and Queensland (11) were recruited for the trial. A further eight clinics in metropolitan Melbourne were also recruited, for a total of 142 clinics. To be eligible for inclusion in the trial, towns had to have a minimum population of 500 people aged 16–29 years (2006 census) and fewer than seven clinics. Towns were excluded if a military base, university or mine was nearby, or if it was a tourist town. A list for each state was drawn up, and towns randomly selected until the required sample size was obtained. More than 90% of invited clinics agreed to participate. Towns were randomised to either a chlamydia testing intervention group or to a control group. Clinics in the intervention group were asked to target 16–29-year-old men and women for annual testing; they received a multifactorial intervention that included audit and feedback on their chlamydia testing rates, and incentive payments for each chlamydia test requested. Control clinics were requested to continue usual chlamydia control practices.

Data collection

A data extraction tool (GRHANITE) was installed on computers in 122 of the 142 participating clinics. Reasons for not being able to install the tool included the clinic not having a computer (two clinics), non-compatible medical records software (12 clinics) and refusal by the clinic (six clinics). This tool extracts de-identified patient consultation and chlamydia testing data on a weekly basis from the patient medical records database.15 Compatible medical records software includes Medical Director, Best Practice, GENIE, Zedmed, Medtech 32, Communicare, SHIP and practiX. Data included in the analysis were patient age and sex, clinic postcode, chlamydia test request (yes v no) and chlamydia test result (positive v negative v test not done). Additional clinic-specific data were obtained, such as whether the clinic bulk-billed consultations (a payment option in Australia: the doctor does not charge the patient for the consultation but is instead reimbursed directly by Medicare) and whether pathology or specimen collection was available on site. The socio-economic profile of the geographical location of each clinic was obtained by linking their postcodes with the Australian Bureau of Statistics’ 2011 Socio-Economic Indexes for Area–Index of Relative Socio-economic Disadvantage (SEIFA-IRSD).16 The IRSD scores areas according to relative disadvantage, ranging from 600 (most disadvantaged) to 1200 (least disadvantaged). The geographical location of the clinic was also classified according to rurality according to the 2007 Australian Standard Geographical Classification System–Remoteness Area (ASGC-RA).17 The ASCG-RA categorises areas according to their physical distance from urban centres (ie, access to goods and services). Its categories, in order of increasing remoteness, are major cities, inner regional, outer regional, remote, and very remote. No participating clinic was in the very remote category. For each clinic postcode, the proportion of the population with Aboriginal and/or Torres Strait Islander background was obtained. Chlamydia prevalence is higher among Aboriginal people, and it is important to determine whether there are any barriers to their having a test when requested by a GP.18

Data analysis

All chlamydia test requests were extracted for the period 1 January 2013 – 31 December 2013. The primary outcome for analysis was defined as “no test conducted” following a GP request. Factors associated with this outcome were explored using logistic regression; univariate and multivariate odds ratios (ORs) and 95% confidence intervals (CIs) were calculated. All variables were included in the multivariate analysis. Effect modification was explored by fitting interaction terms to the model. Our main analysis was restricted to clinics participating in the intervention arm of the trial because of the availability of data. A total of 63 of 70 intervention clinics provided data for this analysis. We were able to investigate any potential selection bias by comparing the proportions of no test outcomes for intervention and control clinics. All analyses were performed in Stata 13 (StataCorp) and were adjusted for intracluster correlation at the clinic level. IRSD scores were categorised as quintiles for ease of interpretation and analysed as a linear variable, using the least disadvantaged category as reference. Age was categorised in bands (16–19 years, 20–24 years, 25–29 years).

Ethics approval

ACCEPt received ethics approval from the Royal Australian College of General Practitioners Ethics Committee (NREEC reference number 09/019).

Results

During the study period, the overall annual testing rate of 16–29-year-old men and women in the 63 intervention clinics was 19.2% (95% CI, 16.8–21.8%). A total of 13 225 chlamydia tests were requested; 9712 (73%) were for women. Overall, 29% of chlamydia test requests were for patients aged 16–19 years; 21% were requested by clinics in metropolitan Melbourne, 55% by inner regional clinics, 22% by outer regional clinics, and 2% by clinics in remote locations. About one-third of clinics (31%) provided bulk-billing services for students and young adults; 92% provided on-site specimen collection for pathology (Box).

No test was conducted for 2545 of the requests (19.2%; 95% CI, 16.5–22.3%). Univariate analysis indicated that the odds that no test was conducted were higher for men, those aged 16–19 years, and those living in areas of higher socio-economic disadvantage. Multivariate analysis indicated that the odds of no test being conducted were higher for men (adjusted OR [aOR], 1.4; 95% CI, 1.3–1.6), those aged 16–19 years (aOR, 1.3; 95% CI, 1.1–1.4), those living in areas of greater socio-economic disadvantage (aOR, 1.2; 95% CI, 1.1–1.4 for each additional quintile of Index of Relative Socio-economic Disadvantage), and those attending clinics without on-site pathology collection (aOR, 1.4; 95% CI, 1.0–1.9). The geographical location of the clinic, the availability of bulk-billing services, and the proportion of the population who identified as Aboriginal and/or Torres Strait Islander were not associated with the likelihood of a test not being done. No significant interactions between variables were detected.

Assessment of selection bias

During the study period, the overall annual testing rate in 59 control clinics was 10.9% (95% CI, 9.4–12.8%). A total of 7148 chlamydia tests were requested; no test was conducted in 1219 instances (17.1%; 95% CI, 12.9–22.2%). There was no difference between intervention and control clinics in the proportion of instances where no test was conducted (OR [intervention v control clinics], 1.2; 95% CI, 0.8–1.7; P = 0.42). As for the intervention clinics, univariate analysis indicated that the odds of a test not being conducted were greater for men (OR, 1.2; 95% CI, 1.1–1.4) and those aged 16–19 years (OR, 1.3; 95% CI, 1.1–1.5).

Discussion

We found that about one in five young people for whom chlamydia tests were requested by a GP did not submit a specimen. Men, people aged 16–19 years, those living in areas of greater socio-economic disadvantage, and those attending clinics without on-site pathology collection were less likely to follow through and be tested for chlamydia after a GP request. It is important to note that lower age and socio-economic disadvantage are key risk factors for chlamydia,20 highlighting how vital it is that clinics establish systems which ensure that tests ordered by GPs are actually undertaken.

We found that men were more likely to not undertake a requested test. Qualitative research has provided some insight into possible reasons for this. An evaluation of a peer-led intervention in the United Kingdom that aimed to increase chlamydia screening found that embarrassment was a key issue deterring young men from screening tests, whereas women were more open and accepting.21 Another UK study found that men’s attitudes to chlamydia screening were affected by a lack of knowledge and social embarrassment about chlamydia, a reluctance to seek medical help, a perception that chlamydia was a “women’s disease”, and indifference to health promotion campaigns.22

We found that those aged 16–19 years were less likely to undergo a test requested by a GP. It is possible that concern about confidentiality and privacy in general practice may have deterred some from chlamydia screening.10 Young people are also less likely to undergo annual health checks or to seek health information,23 and they express uncertainty or misconceptions about what the test entails.24 It has been argued that simply raising awareness about the risk of chlamydia may not increase testing rates, and that providing reassurance of non-infection may be more productive.25

We found that the odds of not undertaking a requested test rose with increasing levels of socio-economic disadvantage. This is consistent with an earlier study that found that those living in disadvantaged areas in Australia had lower chlamydia testing rates.26 This is a concern because socio-economic disadvantage is a risk factor for chlamydia infection,18 so it is vital that barriers to chlamydia testing are minimised in these areas. We found that the availability of bulk-billing for the consultation was not an important deterrent. However, we do not have information about whether the cost of the test was also bulk-billed, and it is possible that lack of knowledge about its cost may have deterred some patients from having the test. Qualitative research is needed to examine this possibility.

We found that the odds of not undertaking a test were 40% higher in clinics without on-site pathology collection. Chlamydia testing can be stressful for some patients, and any inconvenience, such as having to leave the clinic to attend an off-site pathology collection centre, will deter patients from following through with a test, especially if the testing centre is not nearby. Most pathology providers in Australia offer a courier service; if patients were able to leave self-collected specimens, such as urine or vaginal swabs, at a clinic, these could be collected by the provider, potentially increasing the uptake of testing.

A number of limitations must be considered when interpreting our results. Firstly, clinics were not randomly sampled for participation in the screening trial; as a result, our results may be subject to selection bias. However, this is unlikely to be important, as more than 90% of clinics agreed to participate, our analysis accounted for intracluster correlation within clinics, and we found no differences in results between intervention and control clinics. Secondly, more than 80% of our clinics were in rural areas, so that it may not be possible to generalise our results to all Australian clinics. Thirdly, data were unavailable for seven of the intervention clinics (10%) because we were unable to install our data extraction tool on a clinic computer. Fourthly, we were unable to assess other barriers to testing, such as the physical layout of the clinic, the location of a toilet, and the availability of local transport. Our analysis was also restricted to summary measures of bulk-billing and pathology collection at the clinic. It is possible that bulk-billing at some clinics may be at the discretion of the doctor, and some doctors may be willing to allow a patient to leave a specimen for collection if on-site pathology services are not available. We were also unable to assess the reason for test requests and whether there was any difference in the failure to test between those who were symptomatic or asymptomatic at the time of the request. Finally, it is possible that there were errors in our data extraction, and that not all chlamydia test requests and results were extracted. However, this problem is unlikely to be significant, because we also collected chlamydia testing data from pathology providers to validate the data extracted for each clinic.

The strengths of our study included its large sample size. Further, more than 90% of clinics agreed to participate, we adjusted our analysis for intracluster correlation within clinics, and we investigated area-level, clinic-level and patient-level factors. We believe our results can be extrapolated to other preventive health activities targeting this age group in general practice.

Conclusions

We found that men, those aged 16–19 years, those living in areas of increasing socio-economic disadvantage and those attending clinics without on-site pathology collection services were less likely to be tested for chlamydia following a GP request. Qualitative research is needed to understand why these individuals are not tested. This is important information for health service delivery in general practice, and highlights the need for clinics to develop systems which ensure that men, younger people and those living in socio-economic disadvantaged areas have a test when requested by their GP.

Box –
Factors associated with a patient not having a test for chlamydia following a request by a general practitioner

Characteristic

No tests done (total test requests)

No tests done as proportion of test requests

Univariate OR (95% CI)

P

Multivariate OR (95% CI)*

P


Total

2545 (13 255)

19.3%

Sex

Women

1738 (9712)

17.9%

1

1

Men

816 (3513)

23.2%

1.4 (1.2–1.6)

< 0.01

1.4 (1.3–1.6)

< 0.01

Age

16–19 years

805 (3807)

21.1%

1.2 (1.1–1.4)

< 0.01

1.3 (1.1–1.4)

< 0.01

20–24 years

1072 (5677)

18.9%

1.1 (0.9–1.2)

0.30

1.1 (0.9–1.2)

0.37

25–29 years

668 (3741)

17.9%

1

1

Clinic location

Major cities

559 (2757)

20.3%

1

1

Inner regional

1349 (7322)

18.4%

0.9 (0.4–1.8)

0.74

0.6 (0.3–1.3)

0.23

Outer regional

572 (2871)

19.9%

1.0 (0.5–2.0)

0.95

0.7 (0.3–1.7)

0.47

Remote

65 (275)

23.6%

1.2 (0.5–3.0)

0.67

0.8 (0.4–1.9)

0.65

Index of Relative Socio-economic Disadvantage

NA

NA

1.2 (1.1–1.3)

< 0.01

1.2 (1.1–1.4)

0.01

Bulk-billing

Yes

1726 (9141)

18.9%

1

1

No

819 (4084)

20.1%

0.9 (0.6–1.5)

0.76

1.2 (0.8–1.8)

0.36

On-site pathology collection

Yes

2292 (1219)2

18.8%

1

1

No

253 (1033)

24.5%

1.4 (1.0–2.0)

0.08

1.4 (1.0–1.9)

0.05

Aboriginal and/or Torres Strait Islander§

< 0.6%

573 (3415)

16.8%

1

1

0.6%–1.1%

940 (4178)

22.5%

1.4 (0.9–2.2)

0.10

1.4 (0.8–2.4)

0.24

1.2%–2.5%

383 (2326)

16.5%

0.9 (0.7–1.4)

0.91

1.1 (0.6–1.8)

0.99

≥ 2.6%

649 (3306)

19.6%

1.2 (0.9–1.6)

0.19

1.1 (0.6–1.8)

0.81


NA = not applicable; OR = odds ratio. * Adjusted for all variables in the table. † Australian Standard Geographical Classification System – Remoteness Area.17 ‡ IRSD score was categorised into quintiles and analysed as a linear variable using the least disadvantaged area as reference. Odds ratio is for the change in the odds of no test being performed for each additional increase in IRSD quintile. § Proportion of population identifying as Aboriginal and/or Torres Strait Islander; based on reference 19.

Lessons from Wales — how to embed sustainability and prevention in health care

Legislation and policy support step change for public services in tackling societal challenges in a sustainable way

Across the globe, United Nations member states are considering the 17 new Sustainable Development Goals, targets and indicators that collectively focus on ending poverty and hunger, improving health and education, making cities more sustainable, and combating climate change.1 Wales is one of the first nations in the world to establish a legislative link to the international Sustainable Development Goals, through the creation of the Well-being of Future Generations (Wales) Act 2015. The ambitious Welsh legislation provides an opportunity for a step change in the way public services tackle some of the main health and other societal challenges that will serve and sustain future generations.

Overall, the health of the Welsh population is improving steadily, but the conditions for good health, on equal terms for the entire population, remain a concern. The reasons for these differences are diverse and have roots deep in the history of the communities concerned. They are linked to poverty, social conditions, geographic location and lifestyles, and these also influence each other.

Legislation is arguably one of the most powerful tools available to governments to direct long-term policy goals. It can be an effective lever for influencing changes in society and provide a platform for directing action for the benefit of whole populations. In the case of the Well-being of Future Generations (Wales) Act, it is the recognition that Welsh public services, through leadership and improved capability, are uniquely placed to support individuals and communities to maintain, improve and sustain their health and wellbeing. To this end, the Act places a new duty on national and local public services, no matter what their specific responsibilities, to maximise their contribution to improving the economic, social, environmental and cultural wellbeing of the country. From April 2016, all public bodies will work towards a legally binding common purpose, set out in s 4 of the Act as seven statutory wellbeing goals (Box 1).

Public bodies will be required to set and work towards wellbeing objectives that will maximise their individual contribution to achieving the goals. They will also be required to work together through newly established public services boards, consisting of the main statutory partners; to collectively assess and publish a report on the state of wellbeing in the area, which in turn will inform the development of their local wellbeing plan.

The Act also defines sustainable development as a way of doing things rather than as an end in itself. It requires public bodies to use sustainable development to shape what they do, how they do it and how it is communicated. The five components of the sustainable development principle are set out in s 5 of the Act. These “ways of working” are familiar to those involved in public health (Box 2).

Monitoring and accountability structures, based on the goals and principles, are built into the legislation. For example, the Auditor General for Wales will seek evidence from public services, including the Welsh Government, in order to demonstrate how public bodies have taken the long term into account, have prevented problems from occurring or getting worse, have taken an integrated approach and worked in a collaborative way, and have involved people in policy making, planning and the delivery of services. A Future Generations Commissioner has been appointed and a consultation launched on measures to assess progress.2

The Act represents a milestone for public health — its definition (physical and mental wellbeing) and parity with other goals — with health and equality goals both integral parts and prerequisites for sustainable development. The “health in all policies” approach — described as “an approach to public policies across sectors that systematically takes into account the health implications of decisions, seeks synergies, and avoids harmful health impacts in order to improve population health and health equity”3 — is embedded. Without good health we cannot enjoy a sense of wellbeing and cannot participate in the economy and contribute to social capital. The Act therefore helps articulate an understanding of the determinants of health, helping us to see good health not only as a result of access to quality health care, but being based on socioeconomic status, early intervention and prevention policies, enabling physical environments, as well as individual genetics and behavioural choices, thus moving towards an ecological approach to health and wellbeing.

Although healthy life expectancy is improving, Wales has about a third of its population living with chronic conditions, many of which are preventable.4 The health care system therefore must also respond to the current need as well as build a more sustainable approach for the future. Further legislation comes into force in April 2016 — the Social Services and Well-being (Wales) Act 2014 will drive a change in the care system towards a more preventive approach, integrated around individual needs.

Alongside this has emerged the concept of prudent health care focused on achieving a sustainable health care system.5 Four prudent health care principles were proposed by the government’s advisory body, the Bevan Commission, and endorsed by the Minister for Health and Social Services (Box 3).6

Sustainability and equity are central to a prudent approach to health care. It is about using resources with careful thought as to what is appropriate to the needs of each individual and not always to do everything that is technically possible, as this cannot always match everyone’s hopes and expectations. The National Health Service needs to introduce new discoveries quickly, where appropriate, while recognising that simpler treatments can be just as good or better for many patients. Many health care systems are adopting similar approaches.7

Prudent health care is based on a robust primary care system that is founded on strong co-production: “an approach to public services which enables citizens and professional to share power and work together in equal partnership”.5 This means shifting the emphasis of care from hospitals to community settings, working closely with other services that can underpin healthier lives, and embracing a wider social model of care rather than a purely medical one.

There are challenges for staff in a prudent health care system that requires a genuinely equal balance in decision making between the service user and the professional. We know that patients do better when they determine their own plan for care. In adult social services, for example, we have seen that adopting the principle and purpose of a prudent approach has resulted in empowered staff and service users, a reduction in staff hours and resource use, and the delivery of a service that people prefer.5

Evidence gathered in recent years suggests that we do more and more to people but their experience and the outcome does not always improve as a result. The idea that often to do less is to do better for people can be difficult to accept in a world where the benefits of every new technology and test are promoted. Prudent health care should achieve better health outcomes, better quality, and better value.6 During 2016, the Well-being of Future Generations (Wales) Act and the Social Services and Well-being (Wales) Act will be implemented. Coupled with the move to embedding prudent health care principles into services, this will help Wales to make progress towards a sustainable health and wellbeing system.

Box 1 –
Seven statutory wellbeing goals for Wales*

  • A prosperous Wales is an innovative, productive, low-carbon economy generating wealth and employment for a skilled and well educated population.
  • A resilient Wales is a biodiverse environment with healthy functioning ecosystems that support social, economic and ecological resilience.
  • A healthier Wales is a society in which physical and mental wellbeing is maximised and in which choices and behaviours that benefit health are understood.
  • A more equal Wales is a society that enables people to fulfil their potential, regardless of background or circumstances.
  • A Wales of cohesive communities is attractive, viable, safe and well connected.
  • A Wales of vibrant culture and thriving Welsh language is a society that promotes and protects culture and heritage, encouraging participation in the arts and sport.
  • A globally responsible Wales is a nation which, when doing anything to improve well-being in Wales, takes into account making a positive contribution to global wellbeing.

*Well-being of Future Generations (Wales) Act 2015

Box 2 –
Five sustainable development components*

  • Looking to the long term so that we do not compromise the ability of future generations to meet their own needs.
  • Taking an integrated approach so that public bodies look at all the wellbeing goals in deciding their priorities.
  • Involving a diversity of the population in the decisions that affect them.
  • Working with others in a collaborative way to find shared sustainable solutions.
  • Understanding the root causes of issues to prevent them from occurring.

*Well-being of Future Generations (Wales) Act 2015.

Box 3 –
Four prudent health care principles, proposed by the Bevan Commission6

  • Achieve health and well-being with the public, patients and professionals as equal partners through co-production.
  • Care for those with the greatest health need first, making the most effective use of all skills and resources.
  • Do only what is needed, no more, no less; and do no harm.
  • Reduce inappropriate variation using evidence based practices consistently and transparently.

The value of consultant-led ward rounds for patient safety

Recent studies show that regular consultant-led ward rounds can enhance patient safety and improve outcomes

In 2008, the Special Commission of Inquiry into Acute Care Services in New South Wales public hospitals, which focused on patient safety and quality of care, led to the recommendation, in the Garling report, that “Daily multi-disciplinary ward rounds should be introduced at which accurate and complete notes are taken which are approved by the supervising doctor within a specified time frame”.1 Subsequently, the NSW Department of Health published a document aimed at helping hospitals and clinical units implement the recommendations in the Garling report.2 Despite the recommendations and this response, it is widely asserted that the frequency of, breadth of staff participation in and significance of ward rounds for patient management have diminished in many public teaching hospitals in NSW over the past few years. However, we have been unable to find evidence supporting this contention. Paradoxically, there is broad agreement on the educational value of rounds in disseminating information and in professional mentorship at both the undergraduate and postgraduate levels.

Following publication of the Garling report, the question of whether there was adequate evidence that its proposals would achieve the desired outcomes in quality of care, patient safety and avoiding “bed block” was raised.3 To answer this question, we searched PubMed for recent objective studies on the topic, using search terms including but not limited to: ward rounds, patient care, patient treatment, patient management, patient safety, patient outcomes, treatment planning, medications, length of stay, hospital costs and bed block, and also searched the references in articles that we identified.

We did not find specific evidence of declining importance of ward rounds. On the contrary, the literature abounds with statements such as, “The importance of the post-take ward round to both patient safety and medical education cannot be overemphasised”.4 Further, many studies show that ward rounds, accompanied by research to improve their effectiveness, remain an integral part of patient care in other Australian jurisdictions and elsewhere. For example, the Royal College of Physicians (RCP) and Royal College of Nursing (RCN) in the United Kingdom have jointly published an overview of principles for best practice in medical ward rounds.5

Despite the importance accorded to ward rounds in the Garling report, the RCP/RCN review and other recent publications, we found very few studies that provide objective evidence of ward rounds being a mechanism that guarantees or improves patient safety. One such study, which introduced twice-daily consultant-led rounds in a UK hospital’s medical wards in an attempt to reduce length of stay, yielded dramatic results.6 The mean number of discharges per month increased from 68.6 to 116.1, the mean length of stay declined from 10.4 to 5.3 days, and the bed occupancy rate fell from 95.3% to 87.5% without any change in re-admission or mortality rates. Further, these improvements were sustained over a 12-month period.

In a similar study, consultant-led gastroenterology ward rounds at the Royal Bolton Hospital were conducted twice a week before 2010. Subsequently, once-daily clinical rounds were scheduled from 09:15 to 11:45, Monday to Friday, and were followed each day by a patient-centred multidisciplinary team meeting involving input from all relevant health care professionals, with the predicted date of discharge for each patient reviewed daily.7 A comparison of the 12-month periods before and after the change showed a marked decline in length of stay (from 11.5 days to 8.9 days) and a concomitant increase in number of admitted patients (from 827 to 1072). The number of inpatient deaths declined from 88 (11% of admissions) in 2009 to 62 (6%) in 2010 and the 30-day mortality fell from 121 (15%) to 87 (8%); both these differences were statistically significant. The proportion of patients being transferred to another ward fell from 20% to 8.5%. It was also noted that the resulting continuity of care improved communication among staff and with patients and their relatives.

In 2011, twice-daily consultant-led ward rounds were introduced in the acute admissions unit (AAU) at the Stirling Royal Infirmary and subsequently at the Forth Valley Royal Hospital as one component in a program of interventions aimed at early identification and rescue of patients with a deteriorating condition.8 Compared with a baseline period, the program resulted in a 71% reduction in the rate of cardiac arrests, a 73% reduction in 2222 calls to summon the cardiac arrest team and a relative reduction of 24% in the 30-day mortality for patients admitted to the AAU.

Since the 2009 landmark study on surgical safety checklists,9 there have been several reports on checklists aimed at ensuring systematic, safe and complete patient review during ward rounds. Although most covered the introductory phase only, two were carried through to an objective assessment that showed improved patient safety after the introductory phase.10,11

Although few in number, these studies demonstrate the value of ward rounds for patient care, patient safety and length of hospital stay. Ward rounds were once regarded as essential for good patient care and a necessary part of teaching and training in NSW public hospitals. They were usually conducted at the bedside at a regular time and led by a senior consultant. Emphasis was placed on orderly consideration of clinical data pertinent to the patient’s progress. The team usually included nursing staff, junior doctors and medical students. This was an era when there was considerably less constraint on medical resources, staffing and conditions of appointment. Many conditions have changed since then, leading to factors that could act directly against the recommendations of the Garling report.

Despite the dearth of literature providing a contemporary evidence base, we believe that medicine’s long and profitable experience with ward rounds justifies their retention in modern hospitals. In our opinion, they should be conducted daily, and led by senior medical staff capable of making informed decisions in the patients’ best interests; they should involve nurses and other relevant health professionals; and they should be adequately funded.

Non-reimbursement for preventable health care-acquired conditions

Managing health care risk must be evidence based and not harm patients or the common good

The decision by Australia’s largest private health insurer Medibank to not reimburse hospitals for 165 hospital-acquired complications that it deems preventable has the stated objective of improving patient care and thereby containing costs.1 As with all health care claims, this requires assessment of potential efficacy as well as possible perverse or harmful outcomes.

Medibank’s policy appears to be an expansion of the 2008 decision of Medicare and Medicaid in the United States to improve hospitalised patient safety by refusing to pay for selected potentially preventable hospital-acquired conditions. These included care-related infections, pressure ulcers, retained surgical objects, and deep vein thrombosis or pulmonary embolism associated with total knee and hip replacement procedures.

It assumed that most of the adverse events might be prevented by widespread adoption of achievable practices; that the events could be measured accurately; that the events resulted in clinically significant patient harm; and that present-on-admission determination was feasible.2 Although the policy was seen as potentially effective, there was also recognition of the potential for unfairness, gaming and unforeseen consequences. Accordingly, the initial implementation was considered a bold experiment requiring careful monitoring.

A 2012 study found no evidence that financial disincentives reduced infection rates and no situations where patients appeared to benefit from the implementation of this policy.3 Instead, the authors concluded that careful evaluation is needed to determine when these programs work, when they have unintended consequences, and what might be done to improve patient outcomes. The article further reviewed the effectiveness of health insurers paying for performance and observed that evidence on improved patient outcomes is mixed, with concerns that any intended beneficial effect may be mitigated by providers avoiding the most seriously ill patients. Additional detriment may be caused by the pressure to inappropriately over-investigate and over-treat, such as the use of prophylactic antibiotics.4

Broader experience with the use of financial incentives to deliver health policy outcomes indicates that in many cases, such interventions have failed to deliver anticipated benefits. The lack of solid evidence has not deterred attempts to use them as levers for change, thus urgently requiring knowledge of how and why such schemes are implemented, as well as studies that go beyond black-box and control–resistance frameworks.5 Black-box situations are those where the output from a given input is apparent but knowledge of the actual and often complex determinants is opaque, thus risking erroneous inferences about cause and effect. Control–resistance is the dynamic between change and opposition to such change. Although resistance by medical professionals may be ascribed to self-interest, case studies do not support this.6 Instead, resistance may relate to a lack of policy fairness and legitimacy. Overall, there is currently no clear evidence to recommend widespread implementation of financial levers to drive health care quality improvements, and doing so may simply incur unintended and dysfunctional consequences. Genuine commitment to patients will involve applying health care initiatives that reliably improve quality and safety, while undertaking research that adds to a solid evidence base.

Current best practice is to proactively produce a health care environment in which controllable factors, such as inevitable errors and systematic failures, do not reach patients. This is achieved through adoption of a culture of safety, careful implementation of health information technology, robust process improvement, and clinical simulation.7 These measures should be instituted with the understanding that clinicians and support staff are already striving to provide patients with high-quality care, and the inability to meet performance measures is an opportunity for growth of the system rather than punishment of providers.8 Engineering principles and human factors analysis influence the design of these systems to ensure that they are safe and reliable. There are self-evidently also humanitarian and professional reasons that drive clinicians to deliver optimal patient outcomes, and powerful deterrents against harm such as suffering, reputational damage, legal liability, as well as potential professional and regulatory sanctions. These would seem to be of far greater concern to most practitioners than non-reimbursement.

This literature review suggests that Medibank’s policy to not reimburse selected hospital-acquired complications is unlikely to significantly contribute to the stated objective of patient safety. Instead, there are proven methods for addressing that goal, as well as established and powerful professional obligations to do so. The literature also identifies the need to consider additional consequences of such a policy, such as unfairness and unforeseen outcomes.

Medibank’s non-reimbursement policy targets conditions such as falls resulting in fractures or intracranial injury, health care-associated infections and surgical complications such as venous thromboembolism. Such events are more prevalent in older hospitalised patients, associated with the multimorbidity seen with longevity.9 These intrinsic age and frailty risks cannot be eliminated, even with the best culture and systems. For example, venous thromboembolism is one of the leading causes of post-operative morbidity and mortality in patients with hip fracture. Extensive knowledge and application of current evidence helps to reduce but cannot eliminate the risks of bleeding or thrombosis. Hospitalised older patients are also at an increased risk of infections, ulcers, delirium, refracturing and readmission, among other complications. Best-practice guidelines assist clinicians with their decision making and systems but cannot eliminate the risks from clinical and biological complexity and imperfections.10 Mobilisation following hip repair is equally fraught, with complications such as premorbid balance problems, cognitive and sensory impairments and medication side effects requiring complex benefit–risk decisions. Clinical teams working with older patients know that the risk of adverse events is a constant factor that must be recognised, managed and reasonably minimised, but it is inherent and therefore present in practically every therapeutic intervention.

Currently, patients or their surrogate decision makers consent to stated clinical risks in return for anticipated benefit. The intrusion of unrealistic and unavoidable non-reimbursement risk could oblige providers to make an economically rational decision to avoid interventions associated with this imposed financial risk, irrespective of patient clinical need or risk acceptance. In practice, this will disadvantage policy holders most at risk of non-reimbursable events, such as elderly, obese or seriously ill patients. Non-reimbursement could also be perceived as a statement of negligence, exposing the provider to malpractice claims and effectively further discouraging acceptance of high-risk patients. Even if individual clinicians were prepared to risk non-reimbursement, this is unlikely to be sustainable for private and not-for-profit hospitals with significant overheads.

Indirectly restricting access to health care insurance policies maintained over many years in anticipation of later life or critical need is an issue for the Australian government, which must ensure equity and fairness for particularly older policy holders, especially those who have invested in lifetime cover. Further, the legislated principle of community rating prevents private health insurers from directly or indirectly discriminating between people on the basis of their health or for any other reason. Taxpayers should also be concerned if high-risk Medibank patients are restricted through application of this policy to accessing public hospitals as public patients, thus effectively shifting significant costs from Medibank to predominantly state and territory governments.

It will be apparent that this policy has been introduced following the public listing of Medibank Private on 25 November 2014. This has brought with it pressure to deliver on share market expectations. Although a non-reimbursement policy might deliver short-term gains, in the longer term informed consumers are likely to avoid health insurance policies that do not offer sustained customer value.

The long-term interests of both Medibank’s shareholders and policy holders would arguably be better served by evidence-based initiatives that are also likely to be ethical and socially responsible. This requires constructive engagement with health care providers, supporting proven proactive quality practices that acknowledge inherent and unavoidable clinical risk. Like other payers in the health care system, the private health insurance sector has an important role in engaging ethically with the health professions and industry to ensure a positive health care return on finite investment in our nation’s health.

Therapeutic advances and risk factor management: our best chance to tackle dementia?

An update on research advances in this field that may help tackle this growing challenge more effectively

Increasing life expectancy has fuelled the growth in the prevalence of dementia. In 2015, there were an estimated 47 million people with dementia worldwide (including 343 000 in Australia), a number that will double every 20 years to 131 million by 2050 (900 000 in Australia).1 The global cost of dementia in 2015 was estimated to be US$818 billion.1 Low-to-middle income countries will experience the greatest rate of population ageing, and the disproportionate growth in dementia cases in these nations will be exacerbated by a relative lack of resources.

The diagnostic criteria for dementia (relabelled “major neurocognitive disorder”) of the American Diagnostic and Statistical Manual of Mental Disorders, fifth edition (DSM-5)2 include a significant decline in one or more cognitive domains that is clinically evident, that interferes with independence in everyday activities, and is not caused by delirium or other mental illness. Whether the new diagnostic label catches on remains to be seen. The most common type of dementia is Alzheimer’s disease (AD) (50–70% of patients with dementia), followed by vascular dementia (10–20%), dementia with Lewy bodies (10%) and fronto-temporal dementia (4%).3 These percentages are imprecise, as patients often present with mixed pathology.

Our discussion will focus on AD because it receives significant research attention as the most common cause of dementia. The two hallmark pathological changes associated with neuronal death in AD are deposition of β-amyloid plaques, and tau protein neurofibrillary tangles. Understanding this process has been enhanced by prospective cohort studies, such as the Australian Imaging Biomarkers and Lifestyle (AIBL) study.4 As shown in the Box, the results of this research indicate that the degree of β-amyloid deposition exceeds a predefined threshold about 17 years before the symptoms of dementia are detectable. In the absence of an alternative model, the amyloid cascade remains the most compelling hypothesis for the pathogenesis of AD. This is supported by the fact that early onset familial AD is caused by mutations in chromosome 21 that result in the production of abnormal amyloid precursor protein (APP), or by mutations in chromosomes 1 or 14 that result in abnormal presenilin, each of which increase amyloid deposition. The extra copy of chromosome 21 in Down syndrome also leads to faster amyloid deposition and the earlier onset of AD. Further, the symptoms of AD are correlated with imaging of amyloid in the living brain and with cerebrospinal fluid biomarkers that are now included in new diagnostic criteria for AD and which will enable suitable participants to be selected for trials of drugs that may prevent or modify the disease,2 in particular to determine whether anti-amyloid agents are useful for delaying or treating AD.

At present, cholinesterase inhibitors (donepezil, galantamine and rivastigmine) and the N-methyl-D-aspartate (NMDA) receptor antagonist memantine are licensed for treating AD dementia, and produce modest but measurable benefits for some patients. These medications are thought to work by increasing cholinergic signalling and reducing glutamatergic activity respectively, partially redressing neurochemical abnormalities caused by the amyloid cascade.5 More than 200 other drugs advanced to at least Phase II development between 1984 and 2014, but none has yet entered routine clinical use.6 Lack of efficacy in clinical trials may be the result of their being introduced at a rather late stage of the disease process; hippocampal damage is so profound by the time individuals present with AD dementia that attempting to slow their decline with an anti-amyloid agent may be analogous to starting statins in patients on a heart transplantation waiting list. As it provides the most compelling hypothesis for AD, the amyloid cascade remains the main target for developments in treatment. Treatment trials in people with preclinical or prodromal AD will in due course determine its validity.

Recent developments include promising results for treating prodromal AD with passive vaccines containing monoclonal antibodies directed against β-amyloid, such as solanezumab and aducanumab. This may point the way to treatments in the next decade that delay the onset of dementia in people with developing AD pathology.7,8

The identification of risk factors for AD may lead to risk reduction strategies. Recent randomised controlled trials of multidomain interventions, such as the Finnish Geriatric Intervention Study to Prevent Cognitive Impairment and Disability (FINGER) study (a 2-year program including dietary, exercise, cognitive training and vascular risk monitoring components), show that such interventions could improve or maintain cognition in at-risk older people in the general population.9 Greater risk reduction might be attained by intervening 10 to 20 years before the first clinical signs of cognitive impairment are presented. A recent review of 25 risk and protective factors associated with AD concluded that “the evidence is now strong enough to support personalized recommendations for risk reduction by increasing levels of education in young adulthood, increasing physical, cognitive and social activity throughout adulthood, reducing cardiovascular risk factors including diabetes in middle-age, through lifestyle and medication, treating depression, adopting a healthy diet and physical activity, avoiding pesticides and heavy air pollution and teaching avoidance of all potential dangers to brain health while enhancing potential protective factors”.10 These risk factors, and particularly vascular risk factors, are implicated in neurodegeneration pathology in a number of dementia processes.

While the search for effective preventive strategies and access to evidence-based pharmacological treatments and psychosocial interventions are critical, there are still delays in diagnosis and a failure to utilise existing available resources.1,3 The introduction of the federal government-funded, state-based Dementia Behaviour Management Advisory Services (DBMAS), the initiation of severe behaviour response teams, and increased funding for research should be applauded, but there needs to be greater coordination of service delivery systems for patients and carers at every stage, from prevention through to end-of-life care, and the medical profession needs to do more to ensure that all existing and trainee practitioners are well informed about what we can do for people with dementia right now.

Box –
Relationship of ß-amyloid deposition with other parameters in Alzheimer disease


Aß-amyloid = ß-amyloid; CDR = Clinical Dementia Rating. Reproduced with permission from Villemagne et al (2004).4

[Editorial] Smouldering progress in tobacco control

The State of Tobacco Control 2016, the report of progress towards tobacco control in the USA published by the American Lung Association last week, showed a mixed picture. The report, which tracks yearly progress on key tobacco control policies, found that only one state, Minnesota, scored an A for access to smoking cessation services. Apart from the notable exceptions of North Dakota and Alaska, spending on programmes to prevent and reduce tobacco use was poor throughout the USA. Although substantial progress has been made in reductions in cigarette smoking in young people—rates of smoking in high school students fell by almost 42% since 2011—almost a quarter of high school students reported using at least one tobacco product, and 50% of these used two or more.

Govt actions unhelpful, MBS Review head admits

The hand-picked head of the Commonwealth’s Medicare Benefits Schedule Review has taken a veiled swipe at the Government over its handling of plans to axe 23 MBS items.

Confirming medical profession fears about the potential politicisation of the process, Professor Bruce Robinson told an AMA-hosted forum on the MBS Review that the taskforce co-ordinating the review had been given no say over a 28 December announcement by Health Minister Sussan Ley that an initial batch of 23 items had been recommended for removal from the MBS.

Professor Robinson told the forum, which was attended by representatives from almost 50 specialist colleges and societies, that the announcement was “something we did not have control over”.

In her announcement, Ms Ley said the items were obsolete and no longer consistent with clinical best-practice. The Government suggested axing them would save around $6.8 million a year.

But Professor Robinson cast doubt on the scale of savings from the measure, and lamented that the Government’s handling of the issue had tarnished medical profession support for the MBS review.

“The announcement was unfortunate, because it is one of those things that has caused criticism of the review process,” Professor Robinson said, adding that “those items to be deleted are not going to save much money; it’s a tidying up exercise.”

AMA President Professor Brian Owler told the forum, the second organised by the AMA, that the medical profession had taken part in the review with enthusiasm and goodwill, but that had been put at risk by the Minister’s post-Christmas announcement, as well as the Government’s unilateral action to unveil cuts to bulk billing incentives for pathology and diagnostic imaging services in the Mid-Year Economic and Fiscal Outlook (MYEFO).

“There’s a lot of goodwill within the medical profession to work with Professor Robinson and the Taskforce to improve the MBS. We all want a more modern MBS that reflects modern medical practice that is going to benefit patients,” Professor Owler said. “[But] if you engage the profession on that basis and then come out with an announcement in MYEFO, without any consultation or discussions…of course people are going to be upset.”

Dr Michael Harrison, from the Royal College of Pathologists of Australia, told Professor Robinson that the Government’s decision to axe bulk billing incentives for pathology services, taken without consultation, had “undermined the credibility of the [MBS] review”.

“Our confidence in the review has been severely affected,” he warned.

Much of the medical profession’s concern about the Medicare review has centred on doubts about its over-riding purpose.

Professor Robinson told the forum the focus was to modernise the MBS and align it with current clinical practice.

“My task is not to save money”, Professor Robinson said, and added that the taskforce did not have a savings target.

But the Government is intent on using the exercise to achieve savings, much of which will be used to help cut the Budget deficit. Ms Ley has indicated only half of any funds freed up as a result of the review will be re-invested in health.

Professor Owler acknowledged the review was like to deliver some savings (though probably not as many as the Government hoped), but warned the profession’s goodwill and support was contingent on any savings made were “held within health, to provide better services to patients”.

Adrian Rollins

Latest news:

Mind the gap

The head of the Federal Government’s MBS Review Taskforce has admitted there is “a bit of a risk” of a gap developing between the deletion of old Medicare items and the listing of up-to-date replacements.

In a frank assessment of the difficulties of modernising the MBS, Professor Bruce Robinson admitted there existed a tension between his taskforce and the Medical Services Advisory Committee (MSAC) over their respective roles in deleting and adding items to the Schedule.

The taskforce head said that while many of the clinicians who had volunteered to take part in the MBS review were impatient for change, the “extraordinarily rigorous” process used by MSAC in approving the listing of new services and procedures raised the prospect of a lengthy delay between the axing of an old item and its replacement by a new or updated one.

The issue was highlighted by AMA President Professor Brian Owler in his opening remarks to a forum on the MBS Review organised by the peak medical organisation.

Professor Owler warned of the risk that the Medicare review initiated by the Federal Government could result in an incomplete MBS unless the process to add new items to the schedule could be expedited.

“The concern is the ability of the MSAC process to deal with the number of recommendations that are going to be made – clearly there’s going to be quite a number to come out of this process – and the time it takes through that process before procedures are put on,” he said. “That means that you do have the potential for items to be taken away, and a potential gap before new items are put on.”

The source of concern is two-fold: that the meticulous MSAC approval process will result in lengthy delays in the listing of new items; and that the Health Minister, keen to hold down spending, will be reluctant to approve new items.

On the former, Professor Robinson questioned whether MSAC itself was becoming an obstacle to reform of the MBS, and needed an overhaul, or at least a significant change in approach.

“Is the MSAC process so rigorous that it is becoming an impediment to progress?” he asked.

The Minister has indicated that “no-brainer” changes that require a simple re-write should be expedited, but Professor Owler said consideration also needed to be given to fast-tracking clarifications or improvements that do not require a major MSAC review – an idea endorsed by Professor Robinson.

The MBS review taskforce head also sounded an optimistic note on the Government’s openness to listing new items.

Professor Robinson told the AMA forum that Health Minister Sussan Ley was now “more open to new MBS items than she was a few months ago”.

Adrian Rollins