×

The Burns Registry of Australia and New Zealand: progressing the evidence base for burn care

Burn injuries are associated with high personal and financial costs,1 and acute care costs for severely injured burn patients may represent as little as 20% of the long term financial burden of burn injury.2 Despite the devastating consequences of burn injuries and the complexity and resource-intensive nature of burn care, the evidence base for burn management practice is severely inadequate. A study in 2009,3 reporting on the number and quality of trials in burn care, found only 257 randomised control trials in the burns literature over a 58-year period. Further, the quality of reporting in this small number of trials was poor, and it was noted that the heterogeneity of patients, injuries, interventions and outcome measures were significant impediments to conducting trials in burns patients.

The profound evidence gap resulting from the difficulty of designing and conducting randomised control trials in burn care, and the rapid emergence of new technologies for wound management and critical care have each contributed to a strong worldwide interest in developing burn injury databases to inform prevention strategies and to benchmark the quality of care. The National Burn Repository of the American Burn Association4 and the United Kingdom National Burn Injury Database5 are two examples. The Burns Registry of Australia and New Zealand (BRANZ) was launched in 2009 with the primary aim of improving the quality of burn care in the two countries. The BRANZ is a collaboration between the peak body for Australian and New Zealand burn clinicians, the Australian and New Zealand Burn Association (ANZBA), and the Department of Epidemiology and Preventive Medicine at Monash University.

The aim of our study was to provide a summary and analysis of the first 4 years of data collected by the BRANZ, and to highlight specific areas of practice where there is variation between units that may affect the efficiency and efficacy of treatment. We examined four basic features of burn care in Australia and New Zealand after examination of the raw data had suggested specialist units differed on these features: two management items, rates of admission to intensive care units (ICUs) and rates of skin grafting; and two outcome measures, length of hospital stay and mortality.

Methods

Setting

ANZBA is the multidisciplinary peak body for health care professionals delivering care to burn patients in Australia and New Zealand, where burn care is highly centralised, with a coordinated approach to care. Australian states have designated adult and paediatric burn centres, and the New Zealand National Severe Burn Injury Service also designates hospitals for treating burn-injured patients. In total, 17 hospitals in Australia and New Zealand have dedicated units for treating significant burn injuries. This centralised organisational structure for delivering acute burn care provides an opportunity to collect standardised burn-specific data from the relatively low number of sites that treat almost all patients with major burn injury (percentage of total body surface area burned [%TBSA] > 20%) in Australia and New Zealand, as well as for many with less extensive burns.6

Intervention

In 2008, ANZBA submitted a successful tender to the Australian Commission on Safety and Quality in Health Care (ACSQHC) to test and validate the draft operating principles and technical standards for Australian clinical quality. This provided project funding for establishing the Bi-National Burn Registry of Australia and New Zealand as a clinical quality registry.7 The registry was subsequently renamed the BRANZ. Patients admitted to Australian and New Zealand burn units within 28 days of an acute burn are eligible for inclusion in the registry. Nineteen quality indicators (structural, process and outcome measures) were developed by a multidisciplinary working party of paediatric and adult burn clinicians in accordance with ACSQHC guidelines and are embedded in the registry. As detailed in previous reports, these measures were chosen according to best available evidence and were based on an extensive review of the literature.8

Data were retrieved from clinical notes and hospital information systems and entered into a web-based database. International Classification of Diseases, 10th revision, Australian modification (ICD-10-AM) codes for diagnoses and procedures were electronically extracted and uploaded. Data were submitted quarterly. Formalised governance structures for managing and overseeing the registry were established in accordance with operating principles published by the ACSQHC and endorsed by the Australian Health Ministers’ Conference.9

Participants

Data for all adult patients (16 years and over) registered by BRANZ with a date of admission between July 2010 and June 2014 were extracted for analysis. Ten contributing sites managed adult cases and contributed data: the Alfred, Royal Perth Hospital, Royal North Shore Hospital, Concord Hospital, Royal Darwin Hospital, Royal Adelaide Hospital, Royal Hobart Hospital, Middlemore Hospital, Christchurch Hospital, and Hutt Hospital. One burn unit providing statewide service for adults, at the Royal Brisbane Hospital in Queensland, did not contribute data to the BRANZ, but has now commenced the process necessary for participation. As Waikato Hospital in New Zealand only commenced contributing data in 2012–13, its data were excluded from our analysis.

Data management and analysis

Demographic, burn cause, burn severity, management and in-hospital outcome data were extracted for eligible cases. The %TBSA was the primary measure of severity. Summary statistics were used to describe the included cases: frequencies and percentages for categorical variables, and means and standard deviations (SDs) or medians and interquartile ranges (IQRs) for continuous variables. Data were presented by %TBSA group and by burn unit. Differences between burn units in casemix and outcomes were assessed using χ2 tests for categorical variables, Kruskal–Wallis tests for continuous variables not conforming to a normal distribution, and analysis of variance (ANOVA) for continuous variables conforming to a normal distribution.

Variation in practice between the burn units was assessed with multivariable, mixed effects linear and logistic regression modelling. The burn unit was treated as a random effect to account for correlation between cases within each unit, and the fixed effects were the covariates describing the difference in casemix between the burn units known to affect the outcomes of interest: %TBSA, age, sex, presence of an inhalation injury, and the cause of the burn injury. Mixed effects logistic regression was used for the outcomes of in-hospital death, ICU admission, and skin grafting. From these models, the estimated probability and corresponding 95% confidence intervals (CIs) for each outcome were calculated for each burn unit. Hospital length of stay (LOS) was analysed in a mixed effects linear regression model, with LOS log-transformed for the analysis and the estimated mean LOS (with 95% CI) for each burn unit calculated after back-transformation. P < 0.05 was defined as statistically significant; all analyses were performed in Stata 13 (StataCorp).

Ethics approval

Ethics approval was obtained for all participating sites: Monash University (reference CF08/2431–2008001248); the Royal Adelaide (no reference number); the Alfred (243/09); the Royal Perth (EC 2009/065); the Severe Burn Injury Service (HREC/08/CIPHS/53); the Royal North Shore (SSA/09/HARBR/8); Concord (HREC/08/CIPHS/53; site-specific assessment: 009/CRGH/1); the Royal Hobart (H0010538); the Royal Darwin (HoMER01/09); and the participating New Zealand hospitals (CEN/10/EXP/21). Monash University and the registry employ an opt-out process for consent at all sites except one, where written informed consent is obtained. Opt-out consent is associated with higher rates of participation than an opt-in approach,10 and is the recommended type of consent for participating units.

Results

From July 2010 to June 2014, there were 7184 adult admissions to adult burn units in Australia and New Zealand, for 6955 of which (96.8%) a valid %TBSA was recorded; 70% were men (Box 1). Most injuries (79%) involved less than 10% of TBSA. Inhalation injury was described in 7% of patients. Transfer via a non-BRANZ hospital occurred in 50.6% of cases, and 22.7% were transferred to a BRANZ hospital directly from the scene of the incident. During admission, 14.5% were admitted to an ICU. Blood cultures were taken from 1723 patients, of which 132 (1.9%) were positive; 35 of these patients had sepsis caused by multiply resistant organisms. The median LOS was 5.6 days, and 106 patients (1.5%) died. The in-hospital mortality rate was 1.3% (65 of 5074) for men and 2.0% (41 of 2101) for women.

Unit profile

The profile of admissions by unit is shown in Box 2. There were differences between the ten contributing units in the numbers of patients admitted and the severity of burn injuries treated; five units admitted more than 1000 patients during the reporting period, while five admitted fewer than 480.

ICU admission

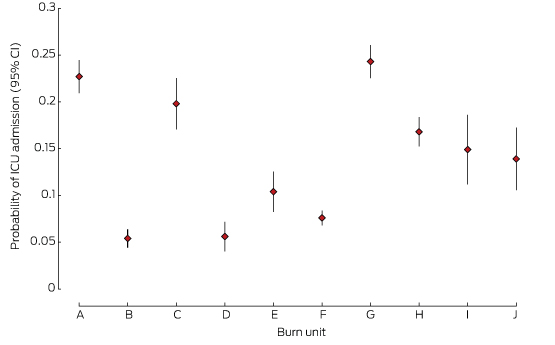
There were differences in the proportions of patients admitted to the ICU by different units (Box 2, Box 3). One low volume (D) and two high volume units (B, F) had the lowest rates of ICU admission.

Skin grafting

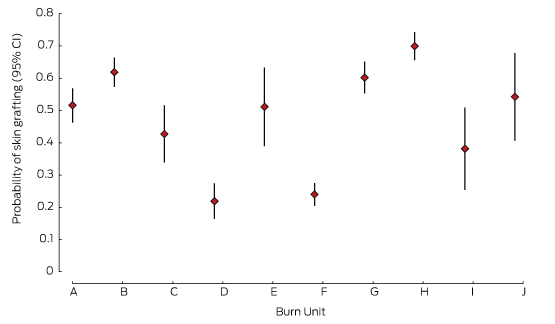
Nearly three-quarters of patients (74%) underwent at least one surgical procedure. There were marked differences in skin grafting rates between units (Box 2, Box 4); one high volume (F) and one low volume unit (D) reported the lowest rates of skin grafting.

Length of stay

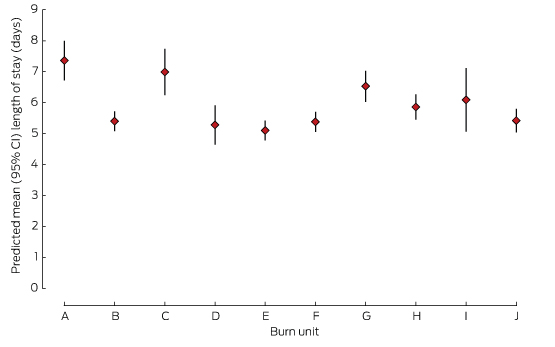
For survivors, LOS increased exponentially with %TBSA. The mean adjusted hospital LOS differed by more than 2 days between the hospitals with the shortest and longest LOS (Box 2, Box 5).

Mortality

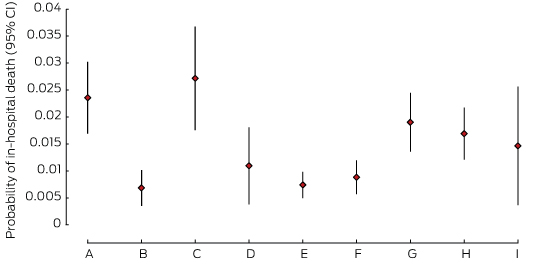
There were differences between units in the adjusted odds of mortality, with three units reporting significantly lower estimated probabilities of death (B, E, F) than the two units with the highest estimates (A, C), despite large CIs (Box 2, Box 6). There were no deaths in unit J, which was therefore excluded from this analysis.

Discussion

This report highlights the significant differences in practice and outcomes that exist between specialist burn units that treat a well defined group of patients in Australia and New Zealand. The LOS and mortality rates in burn units in Australia and New Zealand are comparable with those reported internationally.11,12 However, our analysis of 4 years of BRANZ data identified considerable variation in practice in areas fundamental to the treatment of burn injury, and also provides evidence of significant variations in outcomes that are not explained by simple differences in casemix alone.

Scarring and its associated symptoms, functional deficits and deformity, are inevitable outcomes of burn injury, and they determine the capacity for successful rehabilitation and social re-integration. Surgical treatment is one of the few techniques for influencing scarring and other outcomes,13 and our data indicate that the rates of grafting differ between units. The relationship of these differences in surgical management with long term outcomes remains to be determined. The introduction of grafting protocols based on objective determination of the depth of burn injury is required to address variation in this fundamental aspect of burn care, and to provide evidence that supports such protocols. There were also considerable differences in the rates of admission to ICUs in the higher volume statewide services, and in the rates of diagnosis of inhalation injury. The rates of ICU admission differed between hospitals despite our adjusting for inhalation injury. While it might be hypothesised that diagnosis of inhalation injury that increases the risk of airway obstruction drives pre-hospital intubation and subsequent ICU admission, this does not appear to be the case in our study. We suggest that specific transfer protocols in certain jurisdictions can affect rates of intubation as patients are stabilised for early transfer. Demonstrated differences in practice are not insignificant in terms of resource requirements and interventions that are not without risk. Further investigation of pre-burn hospital management practices and diagnostic methods for inhalation injury will inform improvements in protocols for care delivered to patients suspected of having sustained an inhalation injury.14

The hospital stay caused by burn injury is longer than for other kinds of trauma, and is the most significant contributor to the cost of acute burn treatment.1 Attention to variables that influence LOS is particularly important for ensuring that care is delivered efficiently. BRANZ data indicate significant variation in LOS between units. Time to surgery has been reported to influence several aspects of burn care outcomes, including LOS;13 however, other factors could also affect this outcome, such as mobilisation protocols and social and geographical constraints on discharge from hospital. The variation we identified constitutes a flag that signals the need to examine possible contributors at the hospital level that may be amenable to changes that will improve care.

The differences in mortality between units found in this study have also been reported for burn patients in Australian and New Zealand ICUs,15 so that further investigation of practice is necessary. On the basis of our analysis, one burn unit is assessing policies on withholding active treatment for patients with acute burn injury. More detailed analysis of other BRANZ data that may relate to mortality will be undertaken, but is beyond the scope of this article.

The management of burn injury is a relatively small area of clinical practice, conducted in only a few centres. Benchmarking of practice across states and countries is paramount for ensuring best practice and for developing evidence-based practice for burn care. Accuracy and completeness of data, together with robust risk adjustment and analysis methods, are fundamental prerequisites for clinicians’ confidence in the improvement process. While variation is not necessarily in itself a sign of inferior treatments, it does signal the need for further investigation, especially where outcome indicators are also found to vary. For example, it may be that variations in LOS reflect differing rehabilitation protocols rather than delay in treatment. Examination at the hospital level will be required to determine cause and effects. The introduction of protocols based on the best available evidence will assist this endeavour. Protocols should not be interpreted as binding directives, but the identification of key factors that determine long term outcomes, in particular, is assisted by documentation that records instances of deviations from the protocol and the reasons for these deviations.

In response to the findings reported here, ANZBA launched the Burns Quality Improvement Program (BQIP) in 2013. This program will use data generated by BRANZ to develop evidence-based standards of care (few of which are currently available for burn care) and to provide a framework that drives change. Ongoing data collection and analysis will provide information that will link quality indicators with outcomes and thus validate them as meaningful indicators, as few currently used indicators are based on high quality evidence. It will also support establishing standards for compliance. Analysis of the quality indicators embedded in the dataset is currently underway in order to establish their validity for benchmarking purposes. Participation in BQIP will become a fundamental component of the burn unit accreditation process administered by ANZBA. BRANZ has contributed to increased cooperation and collegiality among burn care clinicians, as evidenced by the broadly representative membership of the BRANZ steering and reference committees, and the creation of a BRANZ/BQIP position on the ANZBA board. There is significant international interest in the processes and indicators developed by BRANZ, and in sharing this information to support the introduction of globally consistent indicators that will facilitate international benchmarking.

Conclusions

A clinical quality registry for burn care has been established in Australia and New Zealand. Our results demonstrate the feasibility of collecting data, as well as the need for such data, given the evidence of variations in practice and outcomes that we identified. The information provided by BRANZ provides a unique opportunity for significantly improving the quality of care for burns patients in Australia and New Zealand.

Box 1 –
Profile of cases by total body surface area burned

Population descriptor

Total body surface area burned (%TBSA)


< 10%

10–19%

20–29%

30–39%

40–49%

≥ 50%


Number of admissions (% of all cases)

5472 (78.7%)

925 (13.3%)

274 (3.9%)

125 (1.8%)

54 (0.8%)

105 (1.5%)

Mean age (SD), years

41.2 (18.2)

40.1 (18.6)

40.9 (18.7)

39.5 (17.4)

40.7 (16.7)

39.9 (16.2)

Age group, number (%)

16–19 years

465 (8.5%)

91 (9.8%)

29 (10.6%)

12 (9.6%)

5 (9.3%)

8 (7.6%)

20–29 years

1387 (25.3%)

250 (27.0%)

69 (25.2%)

30 (24.0%)

15 (27.8%)

26 (24.8%)

30–39 years

984 (18.0%)

174 (18.8%)

51 (18.6%)

30 (24.0%)

9 (16.7%)

26 (24.8%)

40–49 years

945 (17.3%)

160 (17.3%)

41 (15.0%)

20 (16.0%)

7 (13.0%)

13 (12.4%)

50–59 years

750 (13.7%)

91 (9.8%)

31 (11.3%)

14 (11.2%)

11 (20.4%)

15 (14.3%)

60–69 years

457 (8.3%)

78 (8.4%)

31 (11.3%)

12 (9.6%)

3 (5.6%)

12 (11.4%)

≥ 70 years

484 (8.8%)

81 (7.9%)

22 (8.0%)

7 (5.6%)

4 (7.4%)

4 (4.8%)

Sex, number (%)

Male

3794 (69.5%)

702 (75.9%)

216 (78.8%)

96 (76.8%)

39 (72.2%)

76 (72.4%)

Female

1669 (30.5%)

223 (24.1%)

58 (21.2%)

29 (23.2%)

15 (27.8%)

29 (27.6%)

Cause, number (%)

Flame

2006 (36.7%)

677 (73.2%)

224 (81.7%)

102 (81.6%)

45 (83.3%)

95 (90.5%)

Scald

1715 (31.3%)

184 (19.9%)

38 (13.9%)

13 (10.4%)

2 (3.7%)

3 (2.9%)

Contact

898 (16.4%)

24 (1.5%)

2 (0.7%)

1 (0.8%)

0

0

Other

853 (15.6%)

50 (5.4%)

10 (3.7%)

9 (7.2%)

7 (13.0%)

7 (6.7%)

Median time from injury to admission (IQR), hours

26 (5–123)

6 (2–15)

5 (2–9)

6 (2–10)

5 (1–13)

5 (2–10)

In-hospital mortality rate, deaths (%)

18 (0.3%)

13 (1.4%)

8 (2.9%)

7 (5.6%)

7 (13.0%)

50 (47.6%)

Treatment withdrawn, number

10

10

5

3

6

32

ICU admission rate, number (%)

378 (6.9%)

255 (27.6%)

149 (54.8%)

91 (72.8%)

45 (83.3%)

94 (90.4%)

Median ICU length of stay (IQR), hours

43 (12–82)

55 (29–110)

89 (43–233)

142 (48–307)

194 (101–348)

223 (19–480)

Median time ventilated in ICU (IQR), hours

14 (0–37)

26 (8–72)

40 (10–130)

76 (22–212)

137 (33–251)

118 (14–300)

Median length of stay (IQR), hours

All cases

4.5 (1.9–8.8)

11.7 (6.9–18.6)

20.6 (13.8–30.5)

29.0 (18.5–43.6)

30.6 (17.4–54.1)

13.6 (0.7–62.2)

Survivors

4.4 (1.8–8.8)

11.7 (6.9–18.7)

20.7 (14.5–30.7)

29.2 (19.0–43.6)

37.9 (22.3–55.7)

60.3 (31.8–84.0)

Surgical management

4022 (73.7%)

754 (81.6%)

243 (88.7%)

119 (95.2%)

47 (87.0%)

72 (68.6%)

Debridement and grafting

2632 (65.5%)

489 (64.9%)

194 (79.8%)

104 (87.4%)

36 (76.6%)

52 (72.2%)

Debridement only

838 (20.8%)

160 (21.2%)

70 (28.8%)

34 (28.6%)

14 (29.8%)

32 (44.4%)

Debridement and skin closure

805 (20.0%)

280 (37.1%)

91 (37.5%)

57 (47.9%)

27 (57.5%)

43 (59.7%)

Debridement and skin cell product

422 (10.5%)

77 (10.2%)

28 (11.5%)

18 (15.1%)

7 (14.9%)

8 (11.1%)

Median time from injury to grafting (IQR), days

6.7 (3.7–10.6)

4.6 (2.5–7.8)

4.9 (2.5–7.5)

4.3 (2.6–6.5)

4.4 (2.4–9.5)

5.3 (2.9–12.4)


ICU = intensive care unit; IQR = interquartile range; SD = standard deviation.

Box 2 –
Profile of adult cases managed at each burn unit

Population descriptor

Burn unit


A

B

C

D

E

F

G

H

I

J


Number of admissions

1108

1056

475

429

243

1378

1052

1070

194

179

Mean age (SD), years

42.2 (18.8)

38.8 (16.8)

40.1 (17.7)

37.7 (16.3)

44.5 (19.2)

42.4 (18.5)

42.3 (18.4)

40.2 (18.6)

40.9 (18.5)

41.3 (18.4)

Sex, males (%)

807 (72.8%)

749 (70.9%)

329 (69.6%)

295 (69.7%)

156 (64.2%)

949 (68.9%)

753 (71.7%)

770 (72.0%)

137 (70.6%)

129 (72.1%)

Cause, number (%)

Flame

633 (57.2%)

509 (48.2%)

222 (46.7%)

117 (27.3%)

82 (33.7%)

544 (39.5%)

474 (45.1%)

472 (44.1%)

84 (43.3%)

76 (42.4%)

Scald

253 (22.8%)

272 (25.8%)

134 (28.2%)

85 (19.8%)

63 (25.9%)

498 (36.1%)

307 (29.2%)

295 (27.6%)

45 (23.2%)

61 (34.1%)

Contact

81 (7.3%)

166 (15.7%)

81 (17.1%)

55 (12.8%)

56 (23.1%)

162 (11.8%)

131 (12.4%)

164 (15.3%)

37 (19.1%)

27 (15.1%)

Other

141 (12.7%)

109 (10.3%)

38 (8.0%)

172 (40.1%)

42 (17.3%)

174 (12.6%)

1400 (13.3%)

139 (13.0%)

28 (14.4%)

15 (18.4%)

Mean %TBSA (SD)

9.4 (13.1)

6.1 (9.3)

10.2 (15.1)

5.7 (9.1)

4.3 (6.1)

5.0 (8.2)

8.0 (11.9)

6.7 (10.0)

7.6 (10.7)

7.1 (6.3)

%TBSA < 10%

749 (68.8%)

865 (82.2%)

292 (70.2%)

352 (88.0%)

194 (87.4%)

1178 (88.4%)

773 (74.0%)

828 (77.5%)

139 (72.8%)

27 (16.6%)

%TBSA, 10–19%

217 (19.9%)

112 (10.6%)

56 (13.5%)

30 (7.5%)

18 (8.1%)

94 (7.0%)

164 (15.7%)

170 (15.9%)

37 (19.4%)

27 (16.6%)

%TBSA ≥ 20%

123 (11.3%)

76 (7.2%)

68 (16.3%)

18 (4.5%)

10 (4.5%)

61 (4.6%)

107 (10.3%)

71 (6.6%)

15 (7.8%)

9 (6.5%)

Inhalation injury, number (%)

157 (14.2%)

31 (2.9%)

24 (5.1%)

13 (3.0%)

8 (3.3%)

41 (3.0%)

106 (10.1%)

96 (9.0%)

18 (9.3%)

8 (4.5%)

In-hospital deaths, number (%)

27 (2.4%)

5 (0.5%)

15 (3.2%)

2 (0.5%)

2 (0.8%)

11 (0.8%)

20 (1.9%)

20 (1.9%)

4 (2.1%)

0

ICU admission, number (%)

261 (23.6%)

53 (5.0%)

85 (17.9%)

21 (4.9%)

27 (11.1%)

104 (7.6%)

259 (24.6%)

180 (16.8%)

27 (14.1%)

21 (11.7%)

Median length of stay (IQR), days

8.1 (3.1–15.0)

6.8 (3.9–11.4)

5.1 (2.3–11.1)

7.8 (3.2–14.1)

5.2 (2.1–12.1)

4.7 (2.8–7.9)

5.1 (1.0–14.9)

3.5 (0.4–10.2)

4.1 (2.0–10.1)

4.0 (2.2–8.9)

Grafting procedure performed, number (%)

573 (51.7%)

665 (63.0%)

194 (40.8%)

93 (21.7%)

121 (49.8%)

336 (24.4%)

644 (61.2%)

462 (71.2%)

75 (38.7%)

96 (53.6%)

Median time to grafting from injury (IQR), days

4.6 (2.6–8.2)

5.7 (3.8–8.9)

8.2 (4.0–14.2)

8.7 (5.0–12.6)

11.0 (8.3–15.2)

3.6 (1.1–8.1)

6.5 (3.7–10.4)

6.3 (3.7–10.4)

6.8 (3.5–10.5)

7.7 (3.7–12.5)


ICU = intensive care unit; IQR = interquartile range; SD = standard deviation; %TBSA = total body surface area burned.

Box 3 –
Probability of admission of patients to the intensive care unit (ICU) of the ten hospital burn units

Box 4 –
Probability of skin grafting for patients at the ten hospital burn units

Box 5 –
Predicted hospital length of stay for patients at the ten hospital burn units

Box 6 –
Probability of in-hospital death for patients at the ten hospital burn units

Teledermatology and clinical photography: safeguarding patient privacy and mitigating medico-legal risk

Teledermatology is an innovative model of health care that has the potential to deliver significant benefits for both patients and medical practitioners. These include increased access to specialist services and reductions in travel times, waiting times and costs for patients, and reduced professional isolation and improved access to professional education for doctors.

“Store-and-forward” is a popular form of teledermatology. It involves capturing a still clinical image that is forwarded to a specialist, who later responds with an opinion on diagnosis and management. Teledermatology at the Princess Alexandra Hospital is a successful example of this model of care.1,2

As dermatology is a visually oriented specialty, using digital images for diagnosis is a natural fit. Numerous studies have already shown the diagnostic accuracy and reliability of store-and-forward teledermatology. More rapid diagnosis and initiation of treatment coupled with improved patient outcomes have also been demonstrated.1,3,4

The growth of store-and-forward services coincides with the increasing use of email, faster Internet speeds, the development of electronic health records and the advent of smartphones. Importantly, smartphones provide an accessible mode of capturing and transmitting patient images.

To date, at least two studies have surveyed the use of clinical photography in two separate Australian tertiary hospitals.5,6 Both showed that the use of personal smart phones for capturing clinical images was widespread. However, both studies also revealed inadequate privacy practices, including inconsistencies in the consent process, inappropriate disclosure of images to third parties and poor security practices when personal devices were used.

Mitigating the risks

In Australia, medical indemnity insurers have identified privacy as an emerging medico-legal risk for the profession.7 Breaches of privacy may result in legal action against and reputational damage for individuals and institutions.8,9 Individuals also risk being the subject of a complaint to the Australian Health Practitioner Regulation Agency (AHPRA), a health complaints entity, or an internal hospital investigation.7

In 2014, the Australian Medical Association (AMA) in conjunction with the Medical Indemnity Industry Association of Australia (MIIAA) released a guide for medical students and doctors for the use of clinical imaging and personal mobile devices.7 Its main recommendations include:

  • ensuring the patient understands the reasons for taking the image, how it will be used, and with whom it will be shared;

  • obtaining informed consent before taking a clinical image;

  • documenting the consent process in the patient record;

  • having controls on mobile devices to prevent unauthorised access; and

  • deleting clinical images from mobile devices after saving them to patients’ health records.7

These recommendations highlight key privacy practices for practitioners. However, the AMA and MIIAA advise that the guide should always be read in conjunction with any relevant legislation, and hospital policies and contracts related to clinical images and the use of personal mobile devices.7

Mitigating the risk of breaches of patients’ privacy by health practitioners begins with an awareness of their privacy obligations under the law, together with the privacy protocols of their employer organisations and professional indemnity insurers. Apart from explaining to the patients why an image is necessary, how it will be used, and who will see it when obtaining consent, the law also requires that health practitioners take reasonable steps to protect patient information (including images) from loss, disclosure, unauthorised access or misuse.8,9 Consider the following case scenario:

An elderly man presents to the emergency department of a regional base hospital with a new onset rash. The attending resident is not confident to make a diagnosis, but knows of a teledermatology service provided by a tertiary hospital in the nearest capital city. She asks the patient if she can “take some photos of the rash”. The patient agrees. She takes several photos of the patient with her personal smartphone and emails them, from her personal email address, to the on-call dermatology registrar at the tertiary hospital, requesting an opinion. The dermatology registrar reviews the images together with the patient’s history, and replies 2 hours later with a diagnosis of discoid eczema and a recommendation for management. Meanwhile, the dermatology registrar decides to use the patient images for a teaching session for the interns at the tertiary hospital.

Two weeks later the resident’s mobile phone is stolen. The phone had no security features enabled. The thief finds the patient’s images stored on the phone and uploads them to a public website. The thief also peruses the resident’s emails and finds details of the patient, and these are also shared publicly.

In the first instance, the resident should have made it clear to the patient that the purpose of taking the photo was to email the image to a specialist at another hospital to obtain an expert opinion on diagnosis and management. Further, notwithstanding the absence of a direct relationship with the patient, the teledermatology provider does not have consent to use the images for teaching, as the treating doctor did not obtain consent to use the images for this purpose.

Consent may be obtained orally or in writing, although practitioners should follow their institution’s guidelines. When consent is obtained orally, the consent process should be documented in the patient notes. Written consent must still be accompanied by a proper verbal explanation of the procedure.9

After the theft of her mobile phone in this case, the resident would be liable for a breach of privacy and confidentiality. She may also be in breach of the privacy and confidentiality obligations of her employment contract, as well as the conditions of her professional indemnity insurance. As a consequence, the resident could face disciplinary action from her employer or the Medical Board. The hospital may also be vicariously liable for the breach.9 Serious and repeated privacy breaches can attract substantial civil penalties for individuals and organisations under privacy legislation.

Technological precautions

The case above illustrates how easily a simple photograph can result in a costly legal dispute, not to mention untold harm to the patient. This situation could have been avoided if a number of simple precautions had been adopted.

An unlocked phone with patient photographs stored on it is a breach of privacy waiting to happen. Best practice dictates that patient images should be deleted from personal devices as soon as they are added to patients’ health records.7

As best practice may be overlooked during busy periods, security controls on personal smart phone devices, such as passcode locks, should be enabled to prevent unauthorised access. Installing remote locking or data wiping software to personal devices is recommended, as it will allow practitioners to delete data from their devices in the event of theft or loss.

Device settings should be adjusted so that clinical images on devices are not auto-uploaded to social media or back-up sites.7 Once a photo makes its way into the public domain via social media, it is very difficult to limit further sharing of that image.

The process of transmitting a patient image during the teledermatology consultation introduces an additional risk of a breach of privacy. Images should be transmitted via secure methods. Transmitting images through personal email or text messages is not considered secure by some sources, as such methods are typically not encrypted or password protected.10 Despite these concerns, the practice of emailing images is common in many hospitals. Practitioners should be familiar with the policies and systems of their institution or health service in relation to transmitting clinical images.

If a practitioner is required to send images by email or a text message to a colleague or specialist, they should send a test message first to ensure they have the correct email address or phone number for the intended recipient.7,10 Sending patient information or images to incorrect email addresses or phone numbers constitutes an automatic breach of privacy. Once sent, a practitioner has limited control over what the recipient does with that information. Ideally, one should encrypt or password-protect any images before transmitting them, although some may see this extra precaution as an inconvenience.

Like images, email or text messages that were part of the teledermatology consultation should be deleted from personal email accounts and devices after they have been uploaded to the patient record, as these may contain sensitive patient information that is still accessible if a device is lost or stolen. This includes emails saved in the “sent” folder. Automatic forwarding of emails to another email account should be disabled.

Practitioners should also consider the security of other devices that they use for sending emails. Computers and tablets with email management systems that allow email to be accessed on the desktop without logging in are a potential privacy risk. They should avoid sending patient images from an email address that is connected to an email management system. Practitioners should also implement automatic log off on computers and laptops at home and at work that are used to capture and store patient images, and change computer passwords regularly.

Where videoconferencing is being used, the room should be adequately sound-proofed and access should be restricted to those permitted according to the patient’s consent. Any videorecording of the consultation needs to be securely stored.

When consent for using an image for teaching or research purposes is appropriately obtained, best practice dictates that the image should be de-identified where possible, and must comply with relevant research or ethical guidelines.7 Identifying features such as birthmarks, tattoos, metadata, or even the condition itself, if it is rare, should be removed for such purposes.

Practitioner liability

Health care practitioners are personally responsible for patient information they choose to capture and transmit on their personal devices. Practitioners can limit their legal liability in the event of a breach of privacy by demonstrating that reasonable measures were taken to protect patient information. If a privacy breach does occur, clinicians should adopt an open disclosure approach, whereby the breach is notified and acted on. In these circumstances, practitioners should seek advice from hospital management and their medical defence organisations. Once appropriate legal advice has been sought, it may be necessary to inform the patient of the breach, and to explain and apologise.

Conclusions

It remains to be seen how health institutions and policy makers will tackle the issue of patient privacy in the new era of smart phones and teledermatology services. Fear of legal action should not preclude doctors from embracing novel approaches to health care that benefit patients and doctors. Rather, practitioners should take a few sensible precautions to reduce the likelihood of sensitive patient information falling into the hands of malicious third parties.

Before taking that next clinical photograph, individual practitioners should take a moment to review their own privacy practices and make any necessary adjustments. By doing so, practitioners can avoid the financial and emotional cost of a potential lawsuit in the future.

Barriers to reforming low-value care

In their article in the MJA discussing low-value care, Scott and Duckett noted that “some physicians are establishing programs in their areas of practice that identify and remove low-value care”.1

However, a major barrier to reforming low-value care is that we have a rigid and only slowly moving mechanism for funding new initiatives, which prevents us from implementing new evidence-based care pathways.

An example with which I am well acquainted is low-value colonoscopy, performed in people who are extremely unlikely to have relevant colonic pathology, because patients, general practitioners and specialists fear missed pathology. We know that most young people with gastrointestinal symptoms without alarm features will have a normal colonoscopy2 and do not need this costly and invasive test to diagnose irritable bowel syndrome. We also know from data now widely published and endorsed by the National Institute for Health and Care Excellence in the United Kingdom (https://www.nice.org.uk/guidance/dg11) that using faecal calprotectin to screen this group would better target colonoscopy resources, as it has a high negative predictive value for organic disease and thus provides great reassurance to patients and doctors that colonoscopy is not required.

Yet, despite this and the huge number of colonoscopies performed annually, we do not yet have access to faecal calprotectin testing on the Medicare Benefits Schedule, with the submission on this matter having now been under consideration for over four years (the initial Medical Services Advisory Committee discussion occurred in August 2011). If physicians are being entreated to fix the system, we need our regulatory agencies to partner us in this by being sufficiently nimble to assess the tools we need to drive these changes proactively and promptly.

HPV vaccine impact in Australian women: ready for an HPV-based screening program

In 2017, Australia is moving to a new state-of-the-art, evidence-based cervical screening program using primary human papillomavirus (HPV) DNA testing for all women, whether they have received HPV vaccination or not. Commencing HPV screening at 25 years of age is only possible in the context of a decrease in high-risk HPV prevalence in young women. This is because in an unvaccinated population of young women, infection with HPV (particularly the most oncogenic types, HPV 16 and 18) is common and would result in over-referral of women who test positive for HPV 16 or 18 to colposcopy for infections never destined to persist or cause disease. Since the implementation of the quadrivalent HPV vaccination program in Australia between 2007 and 2009, when over half of all women aged 12–26 years were fully vaccinated, the prevalence of HPV 16 and 18 in young women has declined dramatically.1,2

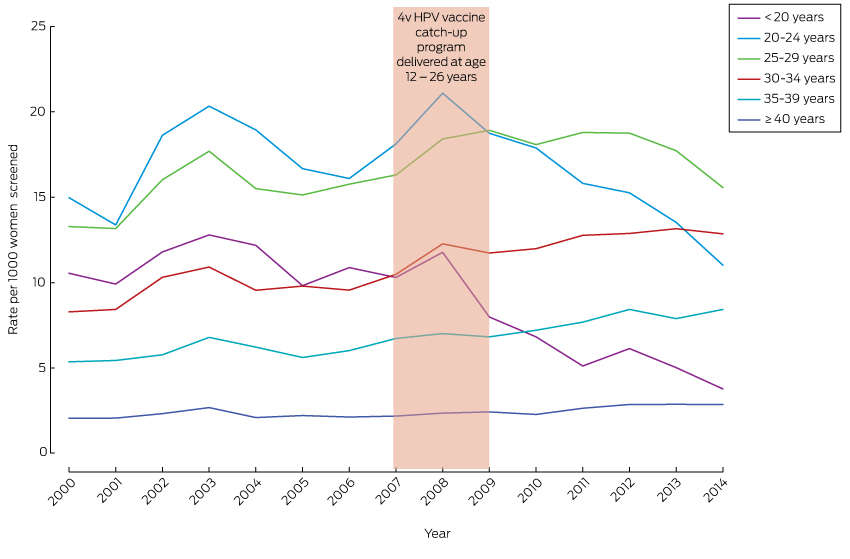
Using Victorian Cervical Cytology Registry data, including those from 2014, we present for the first time evidence that strongly suggests that the impact of the vaccination program on histologically confirmed cervical pre-cancerous lesions now extends to women aged 25–29 years (a 17% decline in the past 2 years from 18.8/1000 to 15.6/1000 [χ2 = 18.6; P < 0.0001]) (Box). We also note the first sign of a decline in the underlying rising rates of high-grade lesions in 30–34-year-olds as vaccinated cohorts reach this age range. Women in these age groups were aged 18–26 years at vaccination; therefore, although many were sexually active before vaccination, the benefits of vaccination are now measurable, as incident HPV 16 and 18 infections that would otherwise have been acquired in the years since vaccination, and their consequent high-grade lesions, are prevented.3 Initial declines (from 2009) occurred in the youngest women (< 20 years), with increases in prevalence observed in older women through the vaccination period. These increases appear to be a continuation of the underlying trend over the past decade of increasing rates of abnormality, exacerbated by the increased screening of higher-risk women (under-screened and never-screened) documented around the time of the vaccination program relating to prominent media messaging and campaigns regarding HPV and cervical screening.4 HPV vaccine cannot treat pre-existing infection or disease. It is possible that the illness and eventual death in 2009 of the young reality television star, Jade Goody, from cervical cancer in the United Kingdom also influenced screening behaviour, as seen in contemporaneous UK screening program data that noted similar increases in disease detection.5

These new findings of continuing and extending declines in the prevalence of cervical disease are in line with modelling studies underpinning the new screening program6 and indicate that the promise of HPV vaccines is coming to fruition in disease prevention. In combination with the new cervical screening program, Australian women will have protection against cervical cancer that is highly effective and evidence based.

Box –
Trends in prevalence rates of high-grade histologically confirmed cervical abnormalities∗ diagnosed in Victorian women, by age group, 2000–2014


4v HPV = quadrivalent human papillomavirus. ∗ Using Australian Institute of Health and Welfare indicator 4.2, which includes high-grade squamous abnormality, cervical intraepithelial neoplasia (CIN) grade 2, CIN grade 3 or CIN not otherwise specified; high-grade endocervical abnormality, endocervical dysplasia; and high-grade endocervical abnormality, adenocarcinoma in situ (http://www.aihw.gov.au/publication-detail/?id=60129550871).

Identifying low-value care: the Royal Australasian College of Physicians’ EVOLVE initiative

Challenges and lessons arising from early adoption of a new approach towards determining what is good clinical practice

In March 2015, 41 medical specialties of the Royal Australasian College of Physicians (RACP) came together as part of the College’s EVOLVE initiative. The main aim of EVOLVE is to drive safer, higher-quality patient care through identifying and reducing low-value medical practices.1 In EVOLVE, “low-value” practices are defined as tests, procedures or interventions that are overused, inappropriate or of limited effectiveness (and, in extreme cases, potentially harmful). The name of the initiative reflects the dynamic and evolving nature of evidence-based medicine. EVOLVE is modelled on the Choosing Wisely initiative in the United States and similar initiatives underway in Canada, Italy and the United Kingdom.2

In EVOLVE’s first year, more than 20 specialties have completed or commenced work on lists of “top-five” low-value clinical practices in their respective fields. Here, we examine the approaches of three early adopter EVOLVE specialties — geriatric medicine, palliative medicine and rheumatology. We also share insights that have arisen so far that are relevant to the Medicare Benefits Schedule (MBS) Review Taskforce.

The EVOLVE approach

EVOLVE recognises the breadth of physicians’ practice, uniting specialties through their commitment to reducing low-value care. It is a partnership between specialty societies and the RACP. EVOLVE is clinician-led, with each specialty responsible for developing lists, engaging with its members and providing feedback to the RACP on systemic barriers to adoption of each list’s recommendations. The RACP is the umbrella body, developing common frameworks and a robust methodology, coordinating across and between specialties, connecting EVOLVE with associated initiatives such as Choosing Wisely Australia, and communicating about and advocating for high-value care.

To avoid the early mistakes of Choosing Wisely in the US, where some participating specialties identified “low-impact” practices on their lists and singled out clinical practices performed by other specialties,3 EVOLVE’s participating specialties agreed to robust principles and methods. These included:

  • Practices under consideration by each specialty should be “within or significantly impact their domain of practice”. This can be interpreted as including practices involving shared decision making with other health care specialties and those that are the subject of referral to and from other specialties. Specialties also have broad discretion to consider practices that they consider can “make a difference” in reducing low-value care (eg, rheumatologists and geriatric medicine specialists examined practices that affected people with conditions they commonly treated).

  • Practices under consideration should be either growing in use or currently commonly used. Some specialties interpreted “commonly used” as encompassing cost, not just volume (eg, rheumatologists excluded from consideration practices that were not very costly to the health care system).

  • Use of the Delphi method4 as the overarching methodology for identifying a top-five list.

The three specialties reviewed the US and Canadian Choosing Wisely lists as part of their development process, but this was not a substitute for formulating their own lists, as not every international practice is relevant to Australia. For example, performing whole-body bone scans (eg, scintigraphy) for diagnostic screening for peripheral and axial arthritis is included in the Canadian rheumatology list but is not material to Australia.

Three Delphi method case studies

EVOLVE recommends use of the Delphi method for identifying low-value care practices, in keeping with initiatives elsewhere.5 This survey-based approach derives consensus based on purposive sampling of experts in the field of interest, panellist anonymity and iterative questionnaire presentation.4

There were three subtle differences in the way the method was applied by the specialties:

  • Both geriatric medicine and palliative medicine working groups consulted their memberships early in the process to seek comment on provisionally identified practices and suggest new ones. Only after processing membership feedback and refinement of the provisional list was an evidence review conducted.

  • Both geriatric medicine and palliative medicine working groups shortlisted their identified practices by requiring respondents to assign scores to each practice based on multiple criteria. Geriatric medicine used seven criteria, while palliative medicine used three. “Strength of evidence”, “significance” and “opportunity to make a difference” were criteria common to both.

  • Rheumatology recruited additional members (including three trainees) into the working group so they could invest effort in building on the RACP’s initial evidence review. With this larger working group, they could break into smaller teams and assign to each team a practice for further research. The evidence was summarised in an online survey distributed to the broader membership, with links to a full discussion of the evidence embedded in the survey questions.

Remaining challenges

Notwithstanding EVOLVE’s established principles and methods, some challenges remain.

First, without a requirement for compulsory participation, there is an element of self-selection in participation in specialty working groups and surveys. It is unclear whether this will lead to bias in the list of practices compiled for investigation and final shortlisting.

Second, there may be a risk of limited buy-in by specialty members if survey participation rates are low or if consensus cannot be reached, potentially reducing the impact of EVOLVE lists on clinician behaviour. The rheumatology working group aims to overcome this by encouraging high survey participation and by requiring that each top-five list practice be selected by at least 70% of survey respondents, in the hope that this represents a sufficiently high threshold for buy-in.

Third, ensuring that practices being considered are commonly used or increasing in use is difficult. For some practices, regularly collected publicly available data are incomplete (eg, MBS data that do not cover all hospital-provided services or do not provide sufficiently detailed breakdowns by indication). In other cases, the judgement of survey respondents or working group members (most of whom are in active clinical practice) was relied upon to remove practices considered irrelevant because of low levels of use.

Fourth, due to the clinical expertise required to formulate EVOLVE lists, the process is specialist-dominated. Nevertheless, achieving buy-in from consumers and non-RACP clinicians is critical, as sustaining changes in clinical practice requires cooperation from these groups. This task will benefit from support from Choosing Wisely Australia, led by NPS MedicineWise, to which EVOLVE is a contributor.

Finally, implementation of the EVOLVE recommendations into practice will be the greatest challenge. A recent study of the Choosing Wisely campaign in the US found significant declines being achieved in only two of seven low-value services identified by the campaign.6 Translating the EVOLVE recommendations into clinical practice requires both consumer and clinician education and a systemic cultural shift towards high-value care. This might be achievable if there is a systematic and coordinated approach, but a substantial investment in time and support may be required to ensure that the aims of EVOLVE are achieved and are sustainable over time.

Insights relevant to the MBS Review Taskforce

The MBS Review Taskforce’s early work has focused on identifying “obsolete” MBS items.7 EVOLVE’s focus is on reducing low-value care. Use of the 23 obsolete items identified by the Taskforce will, by definition, be declining, so aiming to reduce their use will have minimal impact. By contrast, one of the EVOLVE criteria is that the practice examined is commonly used or growing in usage.

A critical EVOLVE insight is that few practices are unambiguously low value for all clinical indications, and low-value care is contextual. Hence, there will be few genuinely low-value clinical practices that could be reduced by deleting particular MBS items.

Clinical practice is more likely to be improved by ensuring tests and treatments are targeted at people with appropriate clinical indications. The following low-value practices identified by the three specialties illustrate the importance of this:

  • use of ultrasound imaging to guide glucocorticoid injections into the shoulder or lateral hip compared with non-image-guided injections (rheumatology)

  • use of antipsychotics as the first choice to treat behavioural and psychological symptoms of dementia (geriatric medicine)

  • use of oxygen therapy to treat non-hypoxic dyspnoea in the absence of anxiety and as routine treatment at the end of life (palliative medicine).

Although these three practices identify low-value applications of ultrasound imaging, antipsychotics and oxygen therapy for specific indications or groups, this does not justify withdrawing subsidies entirely from these tests and treatments, as they are valuable in other clinical contexts.

While some clinical change can be induced by restricting conditions under which particular MBS items are covered, our examples also illustrate the limits of this approach. First, there are tests and treatments that are at risk of being misused but are not funded by the MBS. Second, imposing additional restrictions on the use of MBS items does not guarantee adherence unless proof of correct indication is required.

Financial incentives have been found to have limited effectiveness in driving sustained changes in clinical practice.8 Thus, it is likely that a systems-based approach employing multiple complementary strategies is needed. Initiatives like EVOLVE, that create endorsed and recognised peer judgements on what is good clinical practice, combined with other strategies such as the current MBS Review and mechanisms to improve clinician and consumer understanding of what constitutes low-value care, are needed. Working together, such strategies may shift clinician behaviour and consumer preference towards opting for the most appropriate evidence-based tests and treatments.

A warning against heart disease complacency in 2016

Although death from heart disease in Australia continues to decrease, we cannot rest on our laurels. The greatest barrier to reducing the social and economic toll of heart disease has been complacency. As a nation, we have dropped the ball. It’s time to think again.

Heart disease continues to result in more Australian deaths than any other single cause, and remains the leading cause of death for Aboriginal and Torres Strait Islander peoples. It continues to place a heavy burden on our already stretched health system, demanding the highest expenditure for any individual disease group at $7.7 billion in 2008–09 (http://www.aihw.gov.au/australias-health/2014/health-system).

Most Australians are either sedentary or engage in low levels of physical activity. Obesity among adults has almost tripled in the last two decades (http://www.aihw.gov.au/WorkArea/DownloadAsset.aspx?id=6442459497). Our ageing community, and the success in treating previously fatal heart conditions, means more people are living with heart diseases.

The devastating impact of inaction will see the number of adults with obesity double to 41% by 2031–32, and cardiovascular disease and type 2 diabetes are estimated to cost the government $58 billion if recent trends continue (http://heartfoundation.org.au/about-us/what-we-do/heart-disease-in-australia/australian-heart-disease-statistics).

The Heart Foundation has driven great change, but we can only do so much alone. The government has ignored the facts for too long and heart disease remains a national priority in name only. We now need a nationally funded action plan to improve prevention, treatment and research. Investment will pay big dividends and has the potential to save countless lives, improve national productivity and ease the pressure on hospitals.

Our strategy will continue to target inequalities, develop a heart attack survivor initiative, and tackle the causes of heart disease through funding innovative research. However, we need to see strong government, industry and community leadership resulting in lasting change that can help all Australians lead long, healthy lives.

News briefs

UK experts want ban on tackling in school rugby

More than 70 UK doctors and health experts have written an open letter addressed to government ministers, chief medical officers and children’s commissioners, calling for a ban on tackling in school rugby games, The Guardian reports. “The majority of all injuries occur during contact or collision, such as the tackle and the scrum,” the letter says. “These injuries, which include fractures, ligamentous tears, dislocated shoulders, spinal injuries and head injuries, can have short-term, life-long and life-ending consequences for children.” Rugby is a compulsory part of the UK physical education curriculum from the age of 11 in many boys’ schools, particularly in the independent sector, The Guardian says. The letter’s authors urged schools to move to touch and non-contact versions of the game. “Repeat concussions have been found to have a link to cognitive impairment, and an association with problems such as depression, memory loss and diminished verbal abilities. Children also took longer to recover to normal levels on measures of memory, reaction speed and post-concussive symptoms.” The Rugby Football Union said it took player safety “extremely seriously” and that recent changes meant young players underwent a “gradual and managed” introduction to the contact version of the game.

PLOS ONE paper provokes social media backlash

Retraction Watch reports that a paper on the biomechanics of the hand published in PLOS ONE has provoked a social media backlash for using apparently religious language in the abstract, introduction and conclusion. “In conclusion, our study can improve the understanding of the human hand and confirm that the mechanical architecture is the proper design by the Creator for dexterous performance of numerous functions following the evolutionary remodeling of the ancestral hand for millions of years.” Some commentators on Twitter described the publication of the paper as “an absolute joke” and “a big problem”. A spokesperson for PLOS was quoted by Retraction Watch as saying: “PLOS has just been made aware of this issue and we are looking into it in depth. Our internal editors are reviewing the manuscript and will decide what course of action to take. PLOS’ publishing team is also assessing its processes.” The corresponding author is listed as Cai-Hua Xiong, based at Huazhong University of Science and Technology in China.

Australian health system “underprepared” for heatwaves

A Climate Council report has found Australia’s health system is underprepared to deal with longer, hotter and more intense heatwaves, the ABC reports. “The Climate Council report … found nursing homes and medical centres across the country may not be equipped with necessary back-up energy and water supplies in extreme heat. The council noted several states had upgraded heat and health warning systems since the deadly heatwaves in 2009, but the lack of a streamlined response system was putting lives at risk. The report found heatwaves put pressure on health services, with emergency call-outs jumping almost 50 per cent and heart attacks almost tripling in the heatwaves of January and February 2009. By 2030, Australia’s annual average temperature is predicted to rise by 0.6 to 1.3 per cent, with the globe continuing to heat up to the end of the century, the report said. The report highlights the global problem of heatwaves, pointing to 55 700 deaths during the Russian heatwave in 2010, and 3700 killed in India and Pakistan in May 2015.”

Astronaut Scott Kelly and his twin a boon to science

Commander Scott Kelly has returned to Earth after 340 days on board the International Space Station (ISS) and a raft of scientists and doctors can’t wait to get their hands on him, Forbes reports. Any astronaut coming home is scrutinised, but Cmdr Kelly’s return was particularly anticipated because he has a twin brother. Retired astronaut Mark Kelly has spent the past year on Earth, providing scientists conducting NASA’s Twins Study with the chance to conduct the ultimate “controlled experiment”. Weightlessness can lengthen the spine and body by up to 3%, can cause loss of muscle — most notably in the heart — and bone mass; cause the head to swell; and cause dizziness and fainting on return to Earth. There are also issues of radiation exposure without the shield of the Earth’s atmosphere.

Turnbull’s hospital pass

Prime Minister Malcolm Turnbull has indicated financial relief for the nation’s beleaguered public hospitals will depend on finding additional sources of revenue, delivering a blow to hopes of averting a multi-billion dollar funding crisis set to hit the system from next year.

Mr Turnbull told a meeting of the AMA Federal Council that hospital funding was “a big issue”, and he fuelled speculation of a pre-election spending boost after revealing he was “in discussions” with premiers and chief ministers on the matter.

But the Prime Minister gave no sign his Government was contemplating a major change in the policy course set by the Coalition in 2014 when it announced funding changes that would rip $57 billion out of the public hospital system between 2017 and 2025.

Instead, he reinforced the need for more effective health spending, signalling there would be no let-up in the pressure on doctors, nurses and other health professionals to deliver greater efficiencies.

“Hospital funding is a big issue,” Mr Turnbull said. “It is something I am in discussions with chief ministers and state premiers [about], and we have COAG before not very long, where we will seek to take that issue forward.”

“[But], the big issue is where additional funding will come from.”

Several premiers, most notably Mike Baird in NSW and Jay Weatherill in South Australia, had proposed an increase in the GST – partially offset by other tax changes – to increase the health budget, but the Prime Minister reiterated his Government would not contemplate an increase in tax revenue.

“We have to recognise that Australians already pay high taxes,” Mr Turnbull said. “This is not a low-tax country, so getting better value [for health spending] is vital.”

Instead, while praising advances in the quality and effectiveness of health care, he exhorted health service providers to greater efficiency.

The Prime Minister said rising health expenditure was “often seen as an admission of failure, [but] the reality is that we are getting a lot more for it”, in terms of longer and healthier lives.

However, funding constraints meant that “the pressure is to get better and more effective outcomes” for the same outlay.

Q&A at AMA House

Following one-on-one talks with AMA President Professor Brian Owler, Mr Turnbull was joined by Health Minister Sussan Ley in meeting with AMA Federal Councillors, who grilled the pair on significant aspects of Federal Government health policy including public hospital funding, the Medicare rebate freeze, pathology and diagnostic imaging bulk billing incentives, medical workforce training and emergency department performance targets.

Several AMA Federal Councillors including Dr Tim Greenaway, Dr Saxon Smith and Dr David Mountain challenged the PM and Health Minister on the scale of the Federal Government’s cuts to hospital funding, pointing out the sharp growth in demand for hospital services occurring around the country.

Mr Turnbull questioned why there was a sharp rise in the number of patients showing up at hospital emergency departments, speculating that some of it may be due to a failure in primary care.

But Dr Mountain and Dr Smith explained that as people lived longer, they developed multiple health problems that could compound one another and quickly escalate, requiring expensive and complex emergency care.

Questioned on the Medicare rebate freeze, Ms Ley said on-going Budget deficits meant the Government was not in a position to restore rebate indexation, and was instead examining new models of primary care arising out of the recent review.

Addressing the cut to bulk billing incentives, the Health Minister said it was “not healthy” that the pathology sector was dominated by two providers, and said the major issue raised by pathologists she consulted with was not the incentive cut, but rents charged to co-locate with medical practices.

Ms Ley added that bulk billing incentives for concession card radiology patients had not been touched, supporting their access to care.

On medical training, Ms Ley said she was concerned to find ways to get more “generalist” practitioners into rural areas. The Minister said she did not believe in using Medicare provider numbers and other methods to bond doctors to work in particular areas, but the problem of luring more doctors into rural practice was one that “we do have to collectively solve”.

The Minister said the Government understood concerns around the establishment of a third medical school in Perth, but expressed doubts that the decision could be “unravelled”.

Adrian Rollins


Shine a light on murky insurance deals: AMA

Health insurance premiums are being inflated by commissions and many consumers are being lured into unnecessarily switching cover because of murky arrangements between health funds and insurance comparison websites, the AMA has warned.

Releasing its inaugural Private Health Insurance Report Card, the nation’s peak medical organisation has urged greater Government scrutiny of health insurance industry practices which is says may be distorting the market and undermining the value of private health insurance cover.

As consumer anger over looming premium price hikes builds, the AMA has developed the Report Card to help consumers understand how the market operates and enable them to make better informed choices regarding their health cover.

Launching the Report Card, AMA President Professor Brian Owler said it was common for patients coming to hospital for surgery shocked to discover they were not covered, forcing them to cancel or defer treatment or facing unexpected out-of-pocket costs.

“The AMA wants every person who has private health insurance to know what their policy covers them for, and to review it every year to make sure it continues to meet their needs,” Professor Owler said.

The Report Card addresses two of the biggest gripes of policyholders – gaps and shortcomings in cover, and out-of-pocket fees.

It sets out the level of cover each of the nation’s 35 insurers provides and it details differences in the benefits paid by eight funds for 22 common procedures, including birth, hip and knee replacement, cataract surgery, coronary bypass, vasectomy, haemorrhoid treatment and breast biopsy.

The AMA said there were four main levels of cover, from top private hospital through to public hospital-only policies that President Owler said were junk and should be banned.

He said often policies had misleading names that implied they would provide a much higher level of cover than they actually did, creating the risk that consumers would be caught out when they were most in need.

“There are a lot of policies on offer that provide public hospital-only cover. These are better known as ‘junk’ policies, because they do not support patient choice of doctor or timing for health services or procedures,” Professor Owler said. “It is the AMA’s view that junk policies should be banned outright.”

Even where a treatment is covered by insurance, patients may still be left with out-of-pocket expenses if the benefit paid by the insurer falls short.

For privately insured patients, Medicare pays 75 per cent of the MBS fee, and health funds 25 per cent or more. The bulk of services are provided by doctors with no gap, when Medicare and the health fund between them cover the full total cost of treatment. Sometimes, there is a ‘known gap’, where practitioners charge a fee a set amount above the benefit.

But the Report Card shows that the benefits paid by insurers vary considerably, and the AMA “strongly recommends” that patients seek an estimate from their doctor, including the cost of any implant, and then talk with their insurer prior to treatment.

The AMA has released its Report Card amid concerns that premium increases set to come into effect from 1 April will spur thousands to consider downgrading their cover.

Earlier this month, Health Minster Sussan Ley claimed a victory of sorts after convincing 20 of the nation’s 35 private health funds to lower planned premium increases, a move she said had saved consumers $125 million.

But the average 5.59 per cent increase is virtually treble the inflation rate, and is expected to feed consumer dissatisfaction with the value of private health insurance.

Professor Owler said it was important that consumers were fully informed and aware about the consequences of taking out cheaper cover, which would usually entail more restrictions and exclusions, as well as higher excess.

He said it was particularly worrying that people looking to hold their premium costs down would be duped into taking out junk policies.

“If people have one of the junk policies, the AMA urges them to consider carefully what cover they really need,” the AMA President said.

In addition to the quality of cover on offer, the AMA has raised concerns about the operations of websites that compare health insurance policies.

Professor Owler said these ‘free’ comparator sites earned often exorbitant commissions from insurers, either a fixed percentage of a premium or a fixed fee per sale, which could act as an incentive to get consumers to switch policies.

Either way, the fees could make up a sizeable proportion of the total insurance premium, he said, urging a greater level of transparency and Government scrutiny.

The Australian Competition and Consumer Commission last year issued a report highly critical of the quality and accuracy of information provided by the health funds.

Echoing AMA concerns, the watchdog warned that comparator websites often included only a selection of insurers or policies on offer, and added “they may have commercial relationships with, or receive financial inducements from, listed businesses”.

Ms Ley has launched a review into the private health insurance industry to examine regulation of the sector, including the setting of premiums, as well as other issues including the industry’s push into primary health care; a possible relaxation of community rating principles; and a proposal to replace health insurance rebates with Medicare-style payments for hospital care.

Adrian Rollins


[Comment] Offline: Uncivil society

What can be bad about non-governmental organisations (NGOs)? They are essential voices in a discordant global health conversation often dominated by risk-averse multilaterals, corrupt governments, and neo-colonial donors. NGOs democratise global health by rebalancing the dialogue towards those who have little or no voice. They advocate for issues too sensitive for others to mention. They are instruments for accountability. And increasingly, they deliver services that weak governments simply cannot provide.