Professor Aileen Plant (1948–2007) was a renowned medical epidemiologist and an outstanding global public health leader
In mid-March 2003, hurrying through Perth Airport on her way to a World Health Organization assignment, Professor Aileen Plant paused to write out her will. She asked the airline staff to witness it before boarding a plane for Hanoi. Her task was to lead a team trying to bring Vietnam out of its sudden nightmare of the deadly disease of severe acute respiratory syndrome (SARS), an illness that no one knew the cause of, nor how it spread. The person she was replacing, Dr Carlo Urbani — who had identified the new syndrome — lay sickened by it in a hospital in Bangkok.
Aileen knew that speed was essential. The effectiveness of the tasks of early detection and prevention of transmission would require a cohesive and willing team, which in turn would require the trust of the Vietnamese Ministry and the Vietnamese health care workers. This, she achieved.
On 29 March, Dr Carlo Urbani died. Dr Katrin Leitmeyer, virologist, recalls how Aileen rallied everyone, “gluing extreme characters from all around the world together under difficult psychological circumstances”.
The 3-week mission became 11 weeks. Vietnam had 69 cases of SARS and five deaths, mostly in staff and patients of the Hanoi French Hospital. During this time, Aileen’s sister, Kaye, became gravely ill in Perth. Aileen was desperate to be with her but knew that, even if she did return to Australia, she would not be allowed into any hospital.
Under her leadership, the Hanoi team characterised the clinical features of the disease, its incubation period and possible routes of transmission, and made important observations about the effectiveness of case isolation and infection control in halting transmission. On 28 April, Vietnam was declared SARS-free, the first country to eradicate the disease. The Vietnamese government awarded Professor Plant its highest award, the National Medal of Honour.
Aileen said of her experience that two things stood out. The first was that the Vietnamese government agreed that external help should be sought — an extraordinary admission in communist Vietnam at that time. The second was the dedication of the Vietnamese staff, who quarantined themselves in the hospital and worked with little in the way of modern technology or resources. Aileen thought they should have been awarded the Medal, rather than her. Her own keen sense of family no doubt contributed to her great respect for the grief and isolation of any individual. Finally, in June, Aileen was able to return home to her recovering sister.
Other WHO assignments in which Aileen was involved included investigating an HIV outbreak in children in Libya, childhood dermal fibromatosis in Vietnam, yellow fever outbreaks in Africa, tuberculosis trends in Indonesia and the emergence of avian influenza in Asia. She also began seminal work with the WHO on the International Health Regulations (IHR), to frame the relationship between countries and the WHO in regard to preparation and response for public health events of international concern, and continued work on the Global Outbreak and Alert Response Network (GOARN), which she had helped establish in 2000. Both are key tools in global biosecurity today.
Aileen came from a large family and left school at the age of 15 to work on her parents’ farm in Denmark, Western Australia. She became interested in infectious diseases, telling her father that an animal had died of eastern equine encephalitis. This became a family joke, as the animal in question was a cow. She took up work as a bank teller for 5 years but became determined to study medicine, putting herself though technical school and gaining entrance to the University of Western Australia.
Her early years as a resident doctor in the Northern Territory sparked her interest in Aboriginal health. She became firm in her belief that it was essential for the overall health of humanity to understand and care for vulnerable populations. Already evident to her colleagues by this time were her razor-sharp “bullshit detector”, her interest in all matters and her keen sense of humour.
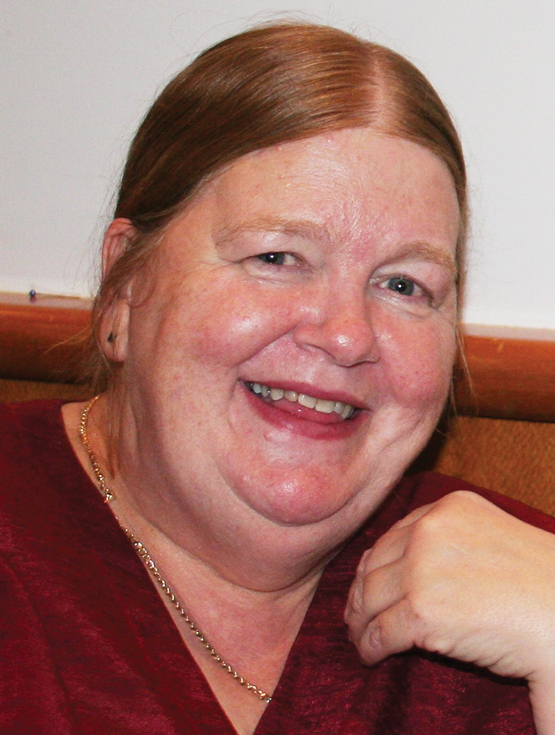
Professor Aileen Plant with Professor Lance Jennings on a World Health Organization mission to investigate a cluster of H5N1 influenza cases in Vietnam in 2005.
Aileen went on to study at the London School of Hygiene and Tropical Medicine. On returning to Australia, she obtained a Master of Public Health at the University of Sydney, eventually joining the faculty as a lecturer, while also working with the New South Wales Department of Health.
In 1989, Aileen took up the position of Chief Health Officer in the NT. Although frustrated by politics, she kept her focus on Aboriginal health, pointing out the flaws in census methods and analysing a decade of data demonstrating health trends and causes of premature mortality in Aboriginal communities.1,2 Her 1995 report called for a whole-of-community and government approach to the poor health trends in Aboriginal and Torres Strait Islander populations.1
Among Aileen’s gifts was the ability to see the truth, or the way to the truth, in science, diplomacy and politics. Science was her bedrock, and diplomacy she saw as an everyday necessity from which wonderful friendships could grow. Bad science and politics tired her, perhaps due to the famous bullshit detector constantly being triggered.
In 1992, Aileen took up the position of Director of the Master of Applied Epidemiology (MAE) Program at the Australian National University, a program she had played a key role in initiating and developing. During her 3 years there, she completed her own PhD, guided many masters and doctoral students, and worked with her colleagues to develop a program on Indigenous health and in attracting Indigenous students. She convinced a colleague in the NT, Dr Mahomed Patel, to join her, developing pathways for international students and obtaining overseas placements for Australian trainees, including deployments with the WHO and establishing MAE-like programs in India, China, Malaysia and Vietnam.
The MAE Program has served the world exceedingly well, with many of its students, staff and graduates contributing to the control of SARS, avian influenza and other public health emergencies. Many of Aileen’s students are now leaders in public health, nationally and internationally.
In 1995, Aileen moved back to Perth to be with her much loved extended family. She worked initially as a senior lecturer at the University of Western Australia before becoming professor of international health at Curtin University in 2000. Together with Professor John Mackenzie, a world-renowned virologist, she compiled an ambitious bid to establish a cooperative research centre (CRC) with a focus on emerging infectious diseases. After two arduous attempts, their bid was successful. The Australian Biosecurity CRC for Emerging Infectious Disease was established in 2003, bringing animal, human and environmental disciplines together in research. Over 7 years, the CRC had many high-impact achievements, including extensive research into the ecology of disease emergence, the development and application of diagnostic tools and systems, and important work on Hendra virus, coronaviruses and influenza viruses. Translational research — taking research into action and policy — was a centrepiece. The CRC awarded over 60 postgraduate scholarships to students in Australia and South-East Asia.
During this time, Aileen continued to assist the Australian Government Department of Health and Ageing, including in emergencies such as the Asian tsunami, where her ability to see the path forward encompassed areas beyond public health. In 2008, the Department named its new crisis response centre the Aileen Plant National Incident Room.
Aileen’s comments usually went to the heart of the matter. Radio host Phillip Adams, interviewing Aileen on ABC RN Late Night Live, asked her whether authoritarian or democratic governments would be better at handling outbreaks. She replied that it depended on the characteristics of the disease and its transmission mode. Diseases like SARS, she noted, are shown to be well handled by authoritarian governments if backed up by a good public health system, but something like HIV–AIDS, which requires behavioural change, is better handled by democracies. She repeated the point, “Wherever they are, infectious diseases always make poor people poorer”.3
Aileen continued to work with the WHO on finalising the IHR, which were endorsed in 2005 and are now signed by over 190 countries. Many of the articles of the IHR reflect the cooperation and information exchange exemplified by Aileen’s time in Vietnam.
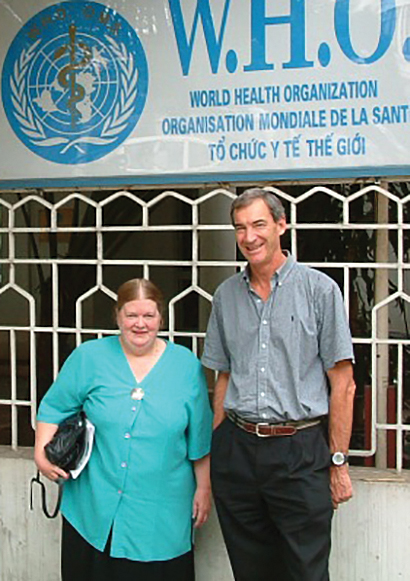
Professor Aileen Plant with Professors John Mackenzie (Curtin University), Mal Nairn (Charles Darwin University) and Charles Watson (Curtin University) at the opening of the Queensland node of the Australian Biosecurity Cooperative Research Centre in 2004.
In addition to 90 scientific articles and numerous book contributions, Aileen co-authored a book on the impact of SARS and another on the approach to communicable diseases.4,5 Aileen’s delight was to do projects with her friends and family, and their interests were hers, be they research projects, scientific books, teaching friends’ children to swim, writing creative fiction or designing tree farms.
Aileen died suddenly at Jakarta Airport on 27 March 2007, while travelling home from a WHO meeting, where she had helped to bring about consensus on the issues of sharing avian influenza viruses and access to influenza vaccine for developing countries.
Her spirit and values live on in her colleagues and her students. The Australian Science Communicators honoured Professor Plant as the 2007 Unsung Hero of Australian Science. The University of NSW introduced the yearly Aileen Plant Memorial Prize in Infectious Diseases Epidemiology, an honour for emerging researchers. The Public Health Association of Australia, together with three other peak public health bodies, awards the Aileen Plant Medal for Contributions to Population Health at every Population Health Congress (4-yearly), and Curtin University grants Aileen Plant Memorial Scholarships for Indigenous students and conducts an annual oration, the Aileen Plant Memorial Lecture.
Aileen’s sister Teen, arriving at Jakarta Airport in 2007, remarked, “This is where Aileen died”. Another sister, Caro, replied, “No, she was in departures”. Even in their deep sorrow, they both laughed, as they realised how much Aileen would have liked that quip.
Editor’s note: We hope you are enjoying our series on remarkable and talented Australian medical women. We would love to hear your suggestions about subjects for future articles. Please email your ideas to us at mja@mja.com.au.