×

Diabetes affects almost one in 10

Diabetes is rapidly emerging as one of the world’s most serious public health problems, affecting almost 500 million adults and contributing to the deaths of close to four million people a year.

An alarming report from the World Health Organization has found that incidence of diabetes, once mainly confined to high income countries, is rapidly spreading, and by 2014 422 million adults were living with the disease – almost one in every 10 adults worldwide. In 1980, its prevalence among adults was less than 5 per cent.

WHO Director-General Dr Margaret Chan said the disease’s emergence in low- and middle-income countries was particularly problematic because they often lacked the resources to adequately diagnose and manage the disease, resulting in needless complications and premature deaths.

According to the WHO’s Global Report on Diabetes, the condition  was directly responsible for 1.5 million deaths in 2012 and contributed to a further 2.2 million fatalities by increasing the risk of cardiovascular and other diseases.

Diabetes takes a relatively heavy toll of younger people, particularly in less wealthy countries. Of the 3.7 million deaths linked to diabetes in 2012, 43 per cent occurred in people younger than 70 years of age, and the proportion was even higher in low- and middle-income countries.

The rise in diabetes has coincided with an increase in associated risk factors, most particularly a jump in global rates of overweight and obesity. Currently, 10.8 per cent of men and 14.9 per cent of women worldwide are considered to be obese, and on current trends that will increase to 18 per cent of men and 21 per cent of women by 2025.

While rates of obesity and diabetes are continuing to climb in rich countries, the WHO said this is being outstripped in other parts of the world, particularly middle-income nations.

The relative lack of resources to prevent, diagnose and manage diabetes in less wealthy countries is exacerbating its spread and impact.

Programs and policies to encourage physical activity, promote health diets, avoid smoking and controlling blood pressure and lipids are generally better funded in rich countries, where GPs and other frontline health services are better equipped to detect diabetes early and patients generally have good access to insulin and other treatments.

The WHO said that even though most countries have national diabetes policies in place, often they lack for funding and implementation.

“In general, primary health care practitioners in low-income countries do not have access to the basic technologies needed to help people with diabetes properly manage their disease,” the agency said. “Only one in three low- and middle-income countries report that the most basic technologies for diabetes diagnosis and management are generally available in primary health care facilities.”

In particular, it highlighted serious problems with access to treatments.

“The lack of access to affordable insulin remains a key impediment to successful treatment and results in needless complications and premature deaths,” the WHO report said. “Insulin and oral hypoglycaemic agents are reported as generally available in only a minority of low-income countries. Moreover, essential medicines critical to gaining control of diabetes, such as agents to lower blood pressure and lipid levels, are frequently unavailable in low- and middle-income countries.”

Diabetes has been identified as one of four priority non communicable diseases targeted under the 2030 Agenda for Sustainable Development, but Dr Chan said the WHO report showed there was “an enormous task at hand”.

“From the analysis it is clear we need stronger responses not only from different sectors of government, but also from civil society and people with diabetes themselves, and also producers of food and manufacturers of medicines and medical technologies,” the WHO leader said.

Adrian Rollins

Value co-creation driving Australian primary care reform

Harnessing our collective capability could enable effective, ongoing reform

For over 20 years, the composition, delivery and importance of primary care have been the subject of quickening international reform. In 1993, the United Kingdom government announced a “primary care-led” National Health Service, underpinned by primary care commissioning and general practitioner fundholding, both vehicles to allow local primary care clinicians to influence government purchasing of health services for their community.1 In 2001, New Zealand introduced its primary health organisations, delivering comprehensive primary health services to enrolled populations either directly or through provider members.2 In 2007, the United States described the patient-centered medical home3 — an approach now linked with provider accountability, care analytics, and a focus on population health and the Affordable Care Act, often referred to as ObamaCare. This was signed into US law in March 2010 and aims to expand the affordability, quality and availability of private and public health insurance through consumer protections, regulations, insurance exchanges and other reform.

In Australia, primary care reform has been more timid, with general practice accreditation to support quality improvement, Divisions of General Practice and Medicare Locals tasked with specific local health system improvements, and an open-ended Medicare system expanded to support team care.4

International health care delivery is now challenged and enabled by the changing epidemiology of health and disease (eg, the recent emergence of the Zika virus), the exciting but confronting reality of disruptive technology (technology that displaces or challenges an established technology), rapidly increasing health care costs, and societies that are increasingly experiencing and celebrating the power of the individual. This suggests future health care systems that will be digitally accessible, appropriately responsive, mindful of costs and benefits, and appreciative of the centrality of patient choice and engagement. Our national health reviews of primary care,5 Medicare,6 private health insurance7 and eHealth8 have recently been completed, and 2016 will usher in their policy impact. The need for change is now undeniable. A value co-creation process, where stakeholders and end users share, combine and leverage each other’s resources and abilities from design to implementation, would provide the collaborative, ongoing impetus required for success.9,10

History has taught us that health care reform is not a finite deliverable. It is, ideally, an ongoing, relationship-based team pursuit of excellence in the community delivery and utilisation of health care — a descriptor not often ascribed to current arrangements. Value, like beauty, is often in the eye of the beholder. Communities value affordability, accessibility, personalisation and quality; service deliverers seek quality, patient satisfaction, professional reward and remuneration; and governments merit quality, safety and cost–benefit return.

Understanding and engaging stakeholders, collectively, in creating value is immensely challenging and time consuming, requiring skilled facilitation and focus. It also requires new platforms of engagement, which allow appropriate input, shared vision and governance arrangements that acknowledge, and positively leverage, inevitable reform tension. Alliance contracting — one such platform used in Canterbury, NZ — has delivered significant and ongoing benefits in health and social care. This involves collaboration between community and acute care providers in a region to address complex health and social care problems by taking a “whole-of-system approach to planning and decision making based on what is best for the patient and health system”.11 As this model becomes a NZ-wide approach to regional co-creation, the future focus will be on achieving agreed outcomes that benefit whole communities, rather than the traditional siloed planning, budgeting and delivery. This approach to value creation could provide a useful reform template for Australia.

Consumers of care will be important co-creators of new care models. With about half of health care service and spend estimated to be related to unhealthy lifestyle choice, consumer buy-in has never been so important in delivering care that makes a difference.

While much easier said than done, the experiences of consumers via individuals, organisations or representative groups should be respected and valued at all phases of reform design, testing, implementation and review. Encouraging, supporting and incentivising patients’ engagement in their own care is also fundamental.

Leaders and champions will be essential for success. It is easy to frighten communities regarding the unknown; the more challenging option is to harness change to confront, address and improve the realities of the future. The future for health, as with education and banking, involves the reality of disruptive change that will enable new approaches that build capacity and access, resulting in a shift in traditional methodology. A rapidly reduced national gross domestic product is a current powerful imperative for primary care’s chief funder to require a focus on achieving more with less. A co-creation approach, involving providers and end users as active partners in addressing and responding to this reform driver, would be highly beneficial. Initiatives such as Choosing Wisely12 and the Medicare Benefits Schedule Review6 could benefit from this methodology. But critical to the success of ongoing reform are leaders and champions who understand the reality and complexity of clinical care, can communicate clearly the change drivers, see the opportunity as well as potential difficulty, and lead their organisations and communities as important co-creators in future health care delivery.

Important new stakeholders and influences will arise from public, private and social sectors, as building the value and outputs of care for health consumers becomes the central target. Technology partners are increasingly important, as are those who assist in measuring the impact of health endeavours. Data collection, sharing, meaningful review and quality improvement are just beginning at a systems level, yet partnerships which embrace and enhance these can grow significant value.

Growing experience and confidence with the techniques and benefits of value co-creation will enable a “win more, win more” result, as partners in successful co-creation ventures enlist a growing circle of interested parties, including volunteer groups, local government, the health-focused business community, and social care organisations.

Peering into the primary health care system of the future may be frightening for some, but it can also be exciting for many. Technological advances will allow rural, aged, time-poor and disabled Australians to step beyond the tyranny of distance and engage more actively in their health. Point-of-care testing and community care models will reduce the cost and inconvenience of care. The “burning platform” of the health care budget may even unlock collective innovation and a willingness to change. Health care reform is not linear — there will be unexpected outcomes (both good and bad) and many learning opportunities. Most of all, there may be the opportunity to collectively unite over time to extract maximum value from our health care system for all of us who are so dependent on it.

Creating health care value together: a means to an important end

Using a value co-creation approach to build closer integration between researchers and the “business” of health care can deliver effective health care reform

Australia’s outgoing Chief Scientist Ian Chubb issued a researcher “call to arms” in November 2015, when he identified Australia as the Organisation for Economic Co-operation and Development (OECD) country in which the research and business communities were least likely to engage with each other: “[given] the rhetorical tailwinds blowing over decades … you would have to conclude that we have a very big anchor (our culture) or no sails (our collective will)”.1 This Supplement supports the importance of this link and argues that the mismatch in a nation that does well in research but poorly on translation can be overcome — but only with our collective focus, new approaches to engagement, and a willingness to capitalise on a governmental direction now firmly rooted in innovation.

In 2013, the Strategic Review of Health and Medical Research (the McKeon Review) made 21 recommendations for improving Australia’s research quality and productivity.2 Among them was the bringing together of hospital and community care networks, universities and research organisations “to embed research within the health care system” and “facilitate best-practice translation of research into healthcare practice”.2

Nearly 3 years later, we are yet to see real evidence of more productive researcher and end user partnerships. Unlike in the United Kingdom, where evidence of the impact of community research is a key requirement for funding success, our national research metrics continue to be heavily weighted to international publication performance and nationally competitive grant processes, which disadvantage non-academic chief investigators. Similarly, health services rarely invite relevant academics or end users to bring their evidence or experience to inform and “grow value” around significant service innovation.

Concurrently, the broader community is witnessing significant change in the way value is conceived and created. This includes a shift from the value-chain model, where value is added by different suppliers in a sequential process, to the constellation model, where value is co-produced by different actors in a non-linear set of interactions — as exemplified by the value co-creation concept.3 Value co-creation occurs when organisations, stakeholders, and end users share, combine and renew each other’s resources and abilities throughout the entire journey from design and production to implementation and continuous development.4,5

Value is subjective and varies as a function of the co-creation experiences of consumers and stakeholders.5 Therefore, value goes beyond optimising health outcomes, and can be achieved in different forms — for example, as organisational improvement, as personal achievements and experiences, via satisfied consumers and stakeholders, or by economic or societal gains.6

The value co-creation approach has been successfully demonstrated within many industries, including tourism and commerce (think Expedia, eBay and Amazon), where design processes have been “disrupted” in order to better understand end user expectations, facilitate meaningful dialogue and improve value for all.5 The application of value co-creation in health care involves a paradigm shift across the entire system — incentivising researchers, clinicians, policy makers, consumers, health care organisations and other stakeholders to jointly explore and create better value in health policy, system design and service delivery.7,8

Key stakeholders in health care include government departments, whose job it is to provide frank, impartial, evidence-based advice to government on policies that will improve community outcomes. Consultation and “real” engagement between the policy and research sectors is critical to maximise value, and much current reform policy is concerned with initiatives that emphasise cooperation between different sectors, such as the primary and secondary care sectors, the public and private sectors, and Commonwealth and state funded sectors. Approaches such as integrated care initiatives seek to link different sectors together in a seamless manner. An example is the “beacon” outpatient substitution model, which brings the strengths of hospital and community care delivery together via partnership between general practitioners with special interests and consultants to increase care quality and reduce cost for patients with complex chronic disease.9,10

In undertaking this work, governments bring together key policy levers around funding, legislation and regulation to encourage and drive improvement. All of these rely on healthy cooperation and engagement between different sectors and ideally should operate in an environment of co-creation, including where appropriate, the relevant research community.

Better use of existing health data is also an increasingly recognised area for value creation. Although impressive efforts have already been made, in the form of reports and peer-reviewed articles from the National Health Performance Authority (NHPA), the Australian Commission on Safety and Quality in Health Care (ACSQHC) and the New South Wales Bureau of Health Information, there remains much untapped potential for these data to be used to build value in health service improvement at all levels. Innovative partnerships between consumers, health professionals, policy makers, researchers and data organisations have demonstrated how new knowledge, using techniques to mine big data, reveals where investments to improve care in Australia will yield the highest return. The NHPA has publicly named postcode areas where improvements in immunisation rates would almost certainly prevent sickness, hospitalisation or premature death;11 local areas where avoidable hospitalisations for the treatment of chronic health conditions are at least 10 times higher than in other similar communities;12 and hospitals with the highest rates of serious yet preventable infections.13 The ACSQHC recently identified local communities where rates of antibiotic dispensing were over 11 times higher than in other similar areas, and local areas where 33 000 knee arthroscopies are performed despite evidence the procedure is of limited value for people with osteoarthritis.14 End user partnerships also offer insights into the information needs of consumers of health as they navigate complex systems. To create value, however, information mined from big data must also create a call to action and inform audiences about where the biggest opportunities lie, allowing them collectively to take informed action to change health systems and services.

In 2014, in the MJA Supplement “Building a culture of co-creation in research” (https://www.mja.com.au/journal/2014/201/3/supplement), we shared our experience of using the value co-creation approach with influential research partners and stakeholders. Now, in this Supplement, we explore the use and impact of value co-creation as a driver for health care reform, at a time when systems are reaching to improve value within resource constraints: reporting on the further study of the Primary Care Practice Improvement Tool (PC-PIT) in practice settings, and resulting development of a resource suite to support quality improvement initiatives, and providing perspectives on the evolution of the role of consumer in value co-creation, as well as the experience of using a value co-creation approach in mental health commissioning and polypharmacy reduction research design.

With Australia’s health system under ongoing pressure, due to increasing health complexity, an ageing population and rising rates of chronic disease, we need to maximise user value within tightening fiscal frameworks. A system that integrates and leverages existing opportunities and technology, increases involvement of consumers and all stakeholders, and creates opportunities for increasing innovation, productivity and co-created outcomes of value for end users is key.

What we now need is a clear national direction that locks in a vision for value co-creation at all levels of the health system — establishing ongoing, collaborative design and review as a key role for health services, end users and the research community. Such integration between the researchers and “businesses” of health care might do much to lift our current unenviable OECD ranking, and unlock the innovation for which our nation has been traditionally renowned.

Aileen Joy Plant

Professor Aileen Plant (1948–2007) was a renowned medical epidemiologist and an outstanding global public health leader

In mid-March 2003, hurrying through Perth Airport on her way to a World Health Organization assignment, Professor Aileen Plant paused to write out her will. She asked the airline staff to witness it before boarding a plane for Hanoi. Her task was to lead a team trying to bring Vietnam out of its sudden nightmare of the deadly disease of severe acute respiratory syndrome (SARS), an illness that no one knew the cause of, nor how it spread. The person she was replacing, Dr Carlo Urbani — who had identified the new syndrome — lay sickened by it in a hospital in Bangkok.

Aileen knew that speed was essential. The effectiveness of the tasks of early detection and prevention of transmission would require a cohesive and willing team, which in turn would require the trust of the Vietnamese Ministry and the Vietnamese health care workers. This, she achieved.

On 29 March, Dr Carlo Urbani died. Dr Katrin Leitmeyer, virologist, recalls how Aileen rallied everyone, “gluing extreme characters from all around the world together under difficult psychological circumstances”.

The 3-week mission became 11 weeks. Vietnam had 69 cases of SARS and five deaths, mostly in staff and patients of the Hanoi French Hospital. During this time, Aileen’s sister, Kaye, became gravely ill in Perth. Aileen was desperate to be with her but knew that, even if she did return to Australia, she would not be allowed into any hospital.

Under her leadership, the Hanoi team characterised the clinical features of the disease, its incubation period and possible routes of transmission, and made important observations about the effectiveness of case isolation and infection control in halting transmission. On 28 April, Vietnam was declared SARS-free, the first country to eradicate the disease. The Vietnamese government awarded Professor Plant its highest award, the National Medal of Honour.

Aileen said of her experience that two things stood out. The first was that the Vietnamese government agreed that external help should be sought — an extraordinary admission in communist Vietnam at that time. The second was the dedication of the Vietnamese staff, who quarantined themselves in the hospital and worked with little in the way of modern technology or resources. Aileen thought they should have been awarded the Medal, rather than her. Her own keen sense of family no doubt contributed to her great respect for the grief and isolation of any individual. Finally, in June, Aileen was able to return home to her recovering sister.

Other WHO assignments in which Aileen was involved included investigating an HIV outbreak in children in Libya, childhood dermal fibromatosis in Vietnam, yellow fever outbreaks in Africa, tuberculosis trends in Indonesia and the emergence of avian influenza in Asia. She also began seminal work with the WHO on the International Health Regulations (IHR), to frame the relationship between countries and the WHO in regard to preparation and response for public health events of international concern, and continued work on the Global Outbreak and Alert Response Network (GOARN), which she had helped establish in 2000. Both are key tools in global biosecurity today.

Aileen came from a large family and left school at the age of 15 to work on her parents’ farm in Denmark, Western Australia. She became interested in infectious diseases, telling her father that an animal had died of eastern equine encephalitis. This became a family joke, as the animal in question was a cow. She took up work as a bank teller for 5 years but became determined to study medicine, putting herself though technical school and gaining entrance to the University of Western Australia.

Her early years as a resident doctor in the Northern Territory sparked her interest in Aboriginal health. She became firm in her belief that it was essential for the overall health of humanity to understand and care for vulnerable populations. Already evident to her colleagues by this time were her razor-sharp “bullshit detector”, her interest in all matters and her keen sense of humour.

Professor Aileen Plant with Professor Lance Jennings on a World Health Organization mission to investigate a cluster of H5N1 influenza cases in Vietnam in 2005.

Aileen went on to study at the London School of Hygiene and Tropical Medicine. On returning to Australia, she obtained a Master of Public Health at the University of Sydney, eventually joining the faculty as a lecturer, while also working with the New South Wales Department of Health.

In 1989, Aileen took up the position of Chief Health Officer in the NT. Although frustrated by politics, she kept her focus on Aboriginal health, pointing out the flaws in census methods and analysing a decade of data demonstrating health trends and causes of premature mortality in Aboriginal communities.1,2 Her 1995 report called for a whole-of-community and government approach to the poor health trends in Aboriginal and Torres Strait Islander populations.1

Among Aileen’s gifts was the ability to see the truth, or the way to the truth, in science, diplomacy and politics. Science was her bedrock, and diplomacy she saw as an everyday necessity from which wonderful friendships could grow. Bad science and politics tired her, perhaps due to the famous bullshit detector constantly being triggered.

In 1992, Aileen took up the position of Director of the Master of Applied Epidemiology (MAE) Program at the Australian National University, a program she had played a key role in initiating and developing. During her 3 years there, she completed her own PhD, guided many masters and doctoral students, and worked with her colleagues to develop a program on Indigenous health and in attracting Indigenous students. She convinced a colleague in the NT, Dr Mahomed Patel, to join her, developing pathways for international students and obtaining overseas placements for Australian trainees, including deployments with the WHO and establishing MAE-like programs in India, China, Malaysia and Vietnam.

The MAE Program has served the world exceedingly well, with many of its students, staff and graduates contributing to the control of SARS, avian influenza and other public health emergencies. Many of Aileen’s students are now leaders in public health, nationally and internationally.

In 1995, Aileen moved back to Perth to be with her much loved extended family. She worked initially as a senior lecturer at the University of Western Australia before becoming professor of international health at Curtin University in 2000. Together with Professor John Mackenzie, a world-renowned virologist, she compiled an ambitious bid to establish a cooperative research centre (CRC) with a focus on emerging infectious diseases. After two arduous attempts, their bid was successful. The Australian Biosecurity CRC for Emerging Infectious Disease was established in 2003, bringing animal, human and environmental disciplines together in research. Over 7 years, the CRC had many high-impact achievements, including extensive research into the ecology of disease emergence, the development and application of diagnostic tools and systems, and important work on Hendra virus, coronaviruses and influenza viruses. Translational research — taking research into action and policy — was a centrepiece. The CRC awarded over 60 postgraduate scholarships to students in Australia and South-East Asia.

During this time, Aileen continued to assist the Australian Government Department of Health and Ageing, including in emergencies such as the Asian tsunami, where her ability to see the path forward encompassed areas beyond public health. In 2008, the Department named its new crisis response centre the Aileen Plant National Incident Room.

Aileen’s comments usually went to the heart of the matter. Radio host Phillip Adams, interviewing Aileen on ABC RN Late Night Live, asked her whether authoritarian or democratic governments would be better at handling outbreaks. She replied that it depended on the characteristics of the disease and its transmission mode. Diseases like SARS, she noted, are shown to be well handled by authoritarian governments if backed up by a good public health system, but something like HIV–AIDS, which requires behavioural change, is better handled by democracies. She repeated the point, “Wherever they are, infectious diseases always make poor people poorer”.3

Aileen continued to work with the WHO on finalising the IHR, which were endorsed in 2005 and are now signed by over 190 countries. Many of the articles of the IHR reflect the cooperation and information exchange exemplified by Aileen’s time in Vietnam.

Professor Aileen Plant with Professors John Mackenzie (Curtin University), Mal Nairn (Charles Darwin University) and Charles Watson (Curtin University) at the opening of the Queensland node of the Australian Biosecurity Cooperative Research Centre in 2004.

In addition to 90 scientific articles and numerous book contributions, Aileen co-authored a book on the impact of SARS and another on the approach to communicable diseases.4,5 Aileen’s delight was to do projects with her friends and family, and their interests were hers, be they research projects, scientific books, teaching friends’ children to swim, writing creative fiction or designing tree farms.

Aileen died suddenly at Jakarta Airport on 27 March 2007, while travelling home from a WHO meeting, where she had helped to bring about consensus on the issues of sharing avian influenza viruses and access to influenza vaccine for developing countries.

Her spirit and values live on in her colleagues and her students. The Australian Science Communicators honoured Professor Plant as the 2007 Unsung Hero of Australian Science. The University of NSW introduced the yearly Aileen Plant Memorial Prize in Infectious Diseases Epidemiology, an honour for emerging researchers. The Public Health Association of Australia, together with three other peak public health bodies, awards the Aileen Plant Medal for Contributions to Population Health at every Population Health Congress (4-yearly), and Curtin University grants Aileen Plant Memorial Scholarships for Indigenous students and conducts an annual oration, the Aileen Plant Memorial Lecture.

Aileen’s sister Teen, arriving at Jakarta Airport in 2007, remarked, “This is where Aileen died”. Another sister, Caro, replied, “No, she was in departures”. Even in their deep sorrow, they both laughed, as they realised how much Aileen would have liked that quip.

Editor’s note: We hope you are enjoying our series on remarkable and talented Australian medical women. We would love to hear your suggestions about subjects for future articles. Please email your ideas to us at mja@mja.com.au.

Immunisation for medical researchers: an ethical and practical imperative

Participants in medical research are the most valuable resource within health research, and their wellbeing must be regarded as paramount. Australia’s national statement on ethical conduct in human research1 establishes that the burden is on researchers to safeguard the health, wellbeing and autonomy of their research participants. We argue that additional guidance is required in an area that has not been widely considered in the ethical research literature and policy: immunisation coverage of the research team.

It is acknowledged that health care workers with immunisation-preventable diseases infect their patients.2,3 There is no reason to believe that researchers are exempt from transmitting these diseases to their participants. There are national guidelines4 that provide evidence-based recommendations on immunisation for people at occupational risk, but this guidance does not specifically refer to researchers.

We present a case study to illustrate the issue. We undertook a cross-generational longitudinal study examining environmental, lifestyle and genetic factors influencing health and wellbeing across the lifespan. The study, based at a medical research institute, involved recruiting pregnant women in collaboration with the local health district. University researchers sought honorary appointments for recruitment and data collection in the hospital setting, with the expectation that we would be required to prove immunisation currency, according to relevant state health policy.5 When the resultant honorary researcher appointment applications were approved, we were not required to show any immunisation status. There may be several reasons for this: first that individuals classifying risk may interpret the rules differently; and second, employment status in clinical research studies with multiple researchers from different organisations is complex.

The study researchers reviewed the university immunisation guidelines and found that those on clinical placements in state health facilities required immunisation coverage, but for all others, including researchers, immunisation was voluntary. After careful consideration, we decided that ensuring the research team was fully immunised was the most ethical way to approach our research. In consultation with an infection control specialist at the local health district, we agreed on several immunisations or evidence of serological immunity.

To fulfil our responsibilities as ethical researchers, we believe it is essential that all researchers who have direct contact with participants are fully immunised, using national guidelines, against relevant diseases. The prevention of avoidable harm appears to be an ethical imperative, but we can find no consistent guidance in this area for researchers at a national or international level. We suggest that it is appropriate for the National Health and Medical Research Council to consider guidance on immunisation coverage of researchers who have direct contact with participants, rather than leaving it to individual research ethics committees.

A Delphi study assessing the utility of quality improvement tools and resources in Australian primary care

There is international interest in the best methods for improving quality of care in primary health care settings.1,2 As a result, governments and health care organisations carry out large-scale programs, including national quality strategies and accreditation, in an effort to improve the quality of services, enhance patient experience and health outcomes and reduce the cost of care.36 Quality improvement (QI) involves “a structured process that includes assessment, refinement, evaluation and adoption of processes by an organization and its providers to achieve measurable improvements in outcomes to meet or exceed expectations”.7

In Australia, a system-wide approach for QI has been driven by the endorsement of national frameworks and policies, including the Quality Framework for Australian General Practice (2007),8 the Australian Safety and Quality Framework for Health Care (2010),9 the National Primary Health Care Strategic Framework (2013)10 and, most recently, the Primary Health Network Quality Partnership Framework (2015).11 Most QI activity in general practice has been motivated by the accreditation process based on the national standards of the Royal Australian College of General Practitioners (RACGP)5 and the opportunity to participate in externally facilitated programs, such as the Australian Primary Care Collaboratives.6 These programs have addressed issues such as chronic disease management, access and e-health and, while these efforts have had a positive impact on improving health care and building practice capacity in these areas, only 2116 out of about 7035 practices have been involved in some aspect.12,13

While the external drivers such as frameworks and accreditation for QI are important, internal factors such as organisational infrastructure, strong team leadership and a culture of QI enable practices to improve their performance and the outcomes of their patients.7,14 However, specific areas that practices choose to deal with through ongoing QI efforts, and the methods they use to do so, are likely to vary based on each practice’s concerns, circumstances, capacity and resources.3 Evidence suggests general practice teams need to “own” the quality agenda, take leadership and be actively engaged as partners in QI.4 QI that is internally led at a practice level, with support from regional networks, is likely to be more effective.15

There are numerous QI tools and resources available for clinical practices and practitioners, with various applications for improving different aspects of quality.1620 However, the accessibility, utility and quality of these resources are variable.1 There is also increasing evidence suggesting that QI initiatives that take on a whole-of-practice approach, such as the Primary Care Practice Improvement Tool (PC-PIT), Six Sigma and the Clinical Microsystem Assessment Tool, are more effective as they engage all practice staff to improve varying aspects of organisational and clinical practice, while recognising practice context and capacity.21

There has been limited exploration of general practitioners’ and practice managers’ perceptions of, and preferences for, QI tools. Available evidence focuses predominantly on GPs and suggests that the length, format, accessibility, content, relevance, reliability (scientific evidence), skills required for use, perceived ease of implementation and perceived benefits and support are factors that affect their choice of tools and resources for use in practice.2225

This work follows on from the pilot study and trial of the PC-PIT approach to improve organisation performance in primary care.21,26 The PC-PIT includes seven key elements integral to high-quality practice performance: patient-centred and community-focused care; leadership; governance; communication; change management; a culture of performance; and information and information technology.21,26 During the trial, practice managers identified the need for additional resources to support the PC-PIT and provide a “one-stop shop” for organisational performance improvement.

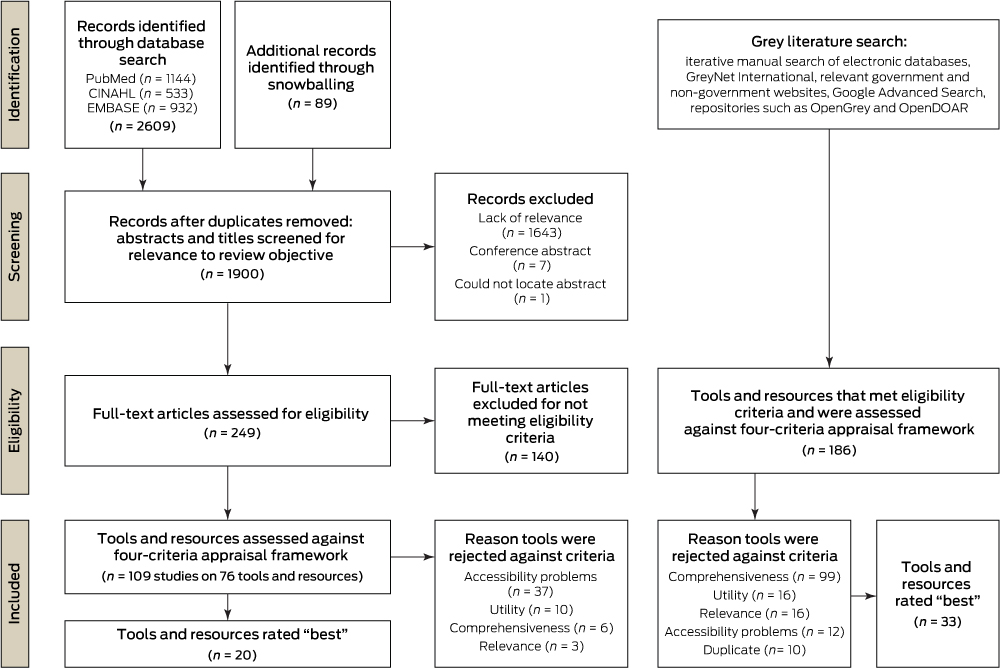
After conducting a systematic literature review to identify online QI tools and resources to support organisational improvement related to the seven elements in the PC-PIT,27 we conducted this Delphi study to assess their relevance and utility and select a final suite of tools and resources to both complement the PC-PIT and support QI activities in Australian general practice.26

Methods

This study was conducted from November 2014 to August 2015. Ethics approval was granted by the University of Queensland Behavioural and Social Sciences Ethical Review Committee (approval number 201000924).

An Expert Advisory Panel evaluated the 53 tools and resources identified in the systematic review (Appendix 1)27 using a modified Delphi technique.28,29 In contrast to the “pure” Delphi process, which provides collated feedback from reviewers back to all reviewers over a series of rounds, in this study de-identified collated feedback was provided to all reviewers during the final (third) round only. This modification was necessitated by the workload and time constraints of the panel members. The modified Delphi process was chosen for its efficient use of time and resources, as well as its ability to minimise the impact of group interaction and influence.30,31 It is also a method for providing valuable expert information where knowledge is incomplete.30

Evaluation process

A five-step approach was used in the evaluation (Box 1).

Step 1. Establish Expert Advisory Panel

A panel of six GPs and six practice managers (as end users of QI tools and resources) who each had more than 5 years’ experience in QI activities in general practice was purposively recruited from practices that had participated in the PC-PIT pilot study in 2013. Of the panel of 12, five were male and seven female, and their practice settings were evenly divided between metropolitan and regional areas. The main task of the panel was to assess, using a standard assessment form, the relevance and utility of selected tools identified through the international literature review.27

Step 2. Develop and pilot assessment form

The pre-tested assessment form (Appendix 2) was based on five domains commonly used for assessing quality of interventions, health information and websites: (i) target audience; (ii) relevance to the PC-PIT; (iii) usability; (iv) strengths; and (v) limitations (pertaining to utility).3234 A mix of tick-box categories and open-ended questions and statements (eg, “Please comment on the strengths, limitations and your overall perception of the utility of using this tool in your practice”) elicited qualitative feedback from the reviewers. The final section of the form asked reviewers to make an overall recommendation (“I do not endorse this tool”, “I am unsure about recommending this tool” or “I recommend this tool to be used to complement the PC-PIT”) and provide a written justification for the chosen recommendation. A score from 0 to 10 for each tool (where 0 indicated poor utility and 10, high utility) provided additional information about tool recommendations.

Step 3. Data collection

In Rounds 1 and 2, the review process was undertaken using the standard assessment form and scoring system (Appendix 2).

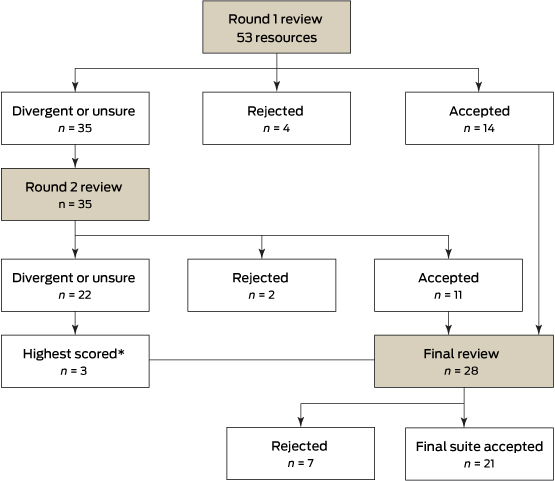
Round 1 review: QI tools and resources were randomly divided into six groups of about nine tools each. Two reviewers (a GP and a practice manager) were allocated a group of tools to review. The reviewers categorised the tools and resources as recommended, not recommended or unsure, and provided reasons for their decision.

Round 2 review: Tools and resources that had received an unsure recommendation from both reviewers, or divergent recommendations (ie, one reviewer had recommended the tool, but the second reviewer did not recommend it or was unsure), in Round 1 were sent out for Round 2 review by different pairs of reviewers using the same assessment form.

Final review: The final review included the tools and resources previously recommended by both the practice manager and GP in Rounds 1 and 2, plus the three highest scoring (those that scored 29/40) divergent Round 2 tools and resources that were relevant to the Australian context, as indicated in the reviewer justification comments. All 12 members of the Expert Advisory Panel were invited to participate in the final review, and nine (five practice managers and four GPs) were able to do so. Each was sent a spreadsheet (Microsoft Excel) that included online links to the tools and resources, with de-identified comments and scores from the Round 1 and 2 reviews. Using the modified Delphi technique, reviewers were instructed to consider the comments and scores from their peers and make a decision to accept or reject each tool or resource for inclusion in the final suite, along with providing a brief reason for their decision. This process provided reviewers with a final opportunity to revise their judgements in light of the collated information from previous rounds.

Step 4. Data analysis

Quantitative data were entered into a spreadsheet and imported into SPSS version 21.0 (SPSS). Data were analysed using SPSS and Microsoft Excel 2013. One of the research team (L C) completed an additional accuracy check of about 10% of coded and entered data. Quantitative results are reported using descriptive statistics. We explored free-text responses using NVivo 10 (QSR International) and used thematic analysis to identify common themes relating to the strengths and limitations of each of the tools and resources.

Step 5. Select suite of recommended tools to support PC-PIT

Tools and resources were selected for inclusion in the final suite if they received five or more recommendations from the expert panel of nine in the final review round.

Results

Of the original 53 tools and resources provided to the Expert Advisory Panel, 28 were included in the final review round. Of these, 21 were selected for inclusion in the final suite. Box 2 shows the number of tools and resources accepted or rejected in each round.

Box 3 shows the mean and range of scores for recommended, rejected and divergent tools and resources in Rounds 1 and 2. Overall, results suggest good concordance in ratings between practice managers and GPs, and clear delineation between recommended and rejected tools and resources. All reviewers provided a recommendation, but not all provided a final score.

Of the final suite of 21 tools and resources (Box 4), five were Australia-specific, six were from the United Kingdom and seven were from North America. Nearly all the tools and resources addressed two or more elements of the PC-PIT, with the most common elements being leadership, change management and patient-centred and community-focused care. Most tools and resources took a whole-of-practice approach and involved most practice staff.

As reviewers perceived the tools and resources to be relevant to different target audiences and PC-PIT elements, only consensus results are reported (ie, where both reviewers in Round 1 indicated the same audience or PC-PIT element for a recommended tool, these are recorded in Box 4; likewise where three or four reviewers indicated the same audience or element in Round 2).

Qualitative results

Key results are summarised below (full details are presented in Appendix 3). Three key themes were common to the recommended tools and resources; namely, that they were: (i) easily used (high utility), (ii) useful to the practice (high value) and (iii) complemented and supported elements of the PC-PIT. Tools and resources were more likely to be scored highly if they had been successfully used on previous occasions by the reviewer(s) or had the perceived potential to be modified or adapted, or if the reviewer indicated an intention to use the tool or resource in the future.

It is beautiful in its simplicity. It is well laid out and easy to use. This can be used easily with minimal training and support. All practice staff should find this easy to use. (GP, Round 1)

A very useful tool to enable change to occur in small managed steps that become improvements, not just changes for the sake of change. A tool that assists in reaching goals and monitoring progress toward the goal. (practice manager, Round 1)

A broad range of limitations with the recommended tools and resources were also noted. GP comments centred mainly on poor utility (too complex or too general), whereas both GPs and practice managers focused on potential implementation challenges, including the need for further resourcing, strong leadership and buy-in from other members of the practice.

It is easy to use and quite simple. It does require a facilitator and team time to be most effective; this can sometimes be difficult to arrange in a busy practice. (practice manager, Round 2)

The six unanimously rejected tools and resources from Rounds 1 and 2 were perceived to have poor utility (hard to follow, too sophisticated, too generalised, too time- and resource-intensive or too wordy); be relevant mainly to hospitals or other non-primary care organisations; be already out of date; require external facilitation; or to be duplicated by or of no additional value to the PC-PIT.

It is not simple to follow. Language is not simple and is too wordy without practical summaries to tie it all in together. It would need extensive facilitation and would achieve minimal practical benefit. (GP, Round 2)

There were 35 tools and resources in Round 1 and 22 in Round 2 to which practice managers and GPs gave divergent or unsure judgements. Most of these tools complemented the PC-PIT, but there were mixed comments on their utility and usefulness, and perceptions of their lack of relevance to the broader Australian context or the context of general practice. If reviewers perceived that the tool replicated the PC-PIT or existing accreditation resources, these were also noted as limitations.

I can’t recommend the tool as is but really recommend the concept. I’ve found it to be excellent in my own practice. It could be worked on to be feasible in Australian general practice through the use of case conferencing items and sponsored workshops which explain how it works. (GP, Round 2)

Overall, the tools and resources accepted in the final suite were perceived to have high utility and relevance, which outweighed any limitations.

This is a well designed resource. A number of the modules would be useful in the Australian setting but some are not — if offered as a resource for PC-PIT, there needs to be an explanation (practice manager, final round)

Tools and resources excluded from the final suite were rejected primarily because they did not fit the Australian context or were too complex. All excluded tools and resources were perceived to have some strengths, but more limitations in relation to utility when compared with the final set of tools and resources.

This is a useful tool but does not fit with Australian general practice training at a practice level. (practice manager, final round)

Discussion

Addressing practice systems is a recognised component of achieving QI in primary care.4,22,35 Our study indicates that potential end users have a preference for tools and resources that cover multiple aspects of practice function. However, issues remain regarding how to promote and sustain QI and the need for ongoing practice support, training and potential financial incentives to undertake and implement QI activities.17

As primary care organisations, health authorities and research networks work to develop QI tools, resources and approaches, our study highlights the need to consider both the capacity of health professionals and practice managers to undertake and drive QI initiatives and their preferences for tools and resources that are most applicable to the context of their practice, including factors that enable (eg, strong leadership, buy-in from others, high relevance) and hinder (eg, implementation cost) tool use.3,16,17,36,37

The final suite of tools and resources included three that were unanimously recommended by the Expert Advisory Panel: Event Analysis: the Seven Steps, the UK National Health Service clinical engagement resources and the Plan, Do, Study, Act (PDSA) cycle. These types of tools and resources are familiar to practices; the PDSA is particularly widely used by both the Australian Primary Care Collaboratives and RACGP QI programs.37,38 Health care professionals demonstrated a clear preference for resources they perceived to be of high utility — those that are simple to understand, easy to use and require no additional training.25 Tools and resources that can be used by all staff and involve all domains of practice operation are considered of highest value, particularly in identifying areas in need of change and in facilitating and monitoring the change process.36 Tested and proven tools and resources (ie, those with high credibility) and those perceived to be easily adapted to suit practice context were judged as most acceptable in our study. Indeed, the credibility of a tool or resource has been linked to greater adherence and implementation, particularly in the use of clinical guidelines.25

However, access to well designed, adaptable tools and resources is only part of the QI process. The acceptability of tools and resources is moderated by considerations relating to implementation and perceptions of the degree of benefit to be gained (perceived value). In this study, reviewers weighed up the costs of implementation (eg, time commitment, the need to pay for external facilitators) against the level of benefit that could potentially be gained. Rejected QI tools and resources were those perceived to be too time-consuming or too complex and thus beyond practice capacity.17,39,40

There has been limited research on appropriate end user-selected tools and resources relevant to general practice. Several of the tools and resources, although not designed for the Australian context, were highly regarded by the Expert Advisory Panel. There is an opportunity to further explore how these tools and resources could be adapted for the Australian primary care context and so provide additional valuable resources to support organisational performance in general practice. Whatever tools and resources are used, QI is a dynamic process and one that often requires the use of more than one QI tool or resource. It requires fostering and sustaining a QI culture, strong team leadership and the implementation of QI at the grassroots level to ensure buy-in, uptake and, ultimately, better quality care.4

Our study had some limitations. While the Delphi technique is a well recognised review method, the judgements of the selected Expert Advisory Panel may not be representative of all end users, and tool or resource acceptability may vary according to the specific interests of individuals. Perceptions of utility may also change with exposure to and increasing familiarity with specific QI tools and resources. However, we endeavoured, through the panel selection process, to engage people with a high level of experience in the field and from a diversity of practices. Our modification of the Delphi technique also limited the number of rounds of review for each of the tools and resources. Ideally, all panel members would have reviewed all tools and resources in each round, but this was not possible due to time constraints and reviewer workloads. We also acknowledge that new QI tools and resources are constantly becoming available and will not have been included in this evaluation, while existing tools and resources can become outdated or difficult to access. It is also likely that several of the excluded tools and resources could be useful for specific tasks in practice, despite their identified limitations.

In conclusion, the final suite of tools and resources to support and enhance the use of the PC-PIT offers one approach to improving the quality of primary care in Australia. Finding ways to integrate and sustain the currency of this resource suite will need the future support of existing peak professional partners, such as the RACGP, the Primary Health Network and the Australian Association of Practice Management. Further work should explore the feasibility of the use of this suite and the potential to modify useful international tools and resources to suit the Australian context.

Box 1 –
Evaluation steps for assessing quality improvement tools and resources


Step 1

Establish Expert Advisory Panel

Define tool and resource review task

Step 2

Develop assessment form

Pilot assessment form

Step 3

Data collection

Three rounds of review of tools and resources

Step 4

Data analysis: qualitative and quantitative

Step 5

Select suite of recommended tools to support PC-PIT


PC-PIT = Primary Care Practice Improvement Tool.

Box 2 –
Evaluation process for assessing quality improvement tools and resources


* Highest scored tools were those that scored 29/40.

Box 3 –
Review scores for quality improvement tools in Rounds 1 and 2*

Score

Round 1


Round 2


Recommended (n = 14)

Rejected (n = 4)

Divergent/unsure (n = 35)

Recommended (n = 11)

Rejected (n = 2)

Divergent/unsure (n = 22)


Total, mean (range)

17 (14–20)

5 (5)

13 (8–17)

16 (12–19)

5 (3–6)

11 (6–15)

n = 12

n = 2

n = 30

n = 11

n = 2

n = 21

General practitioner, mean (range)

8 (5–10)

1 (0–2)

6 (0–10)

8 (5–10)

2 (0–3)

5 (0–10)

n = 13

n = 2

n = 33

n = 11

n = 2

n = 21

Practice manager, mean (range)

9 (7–10)

3 (0–5)

7 (0–10)

8 (6–9)

3 (3)

6 (1–10)

n = 13

n = 4

n = 32

n = 11

n = 2

n = 22


* All reviewers provided a recommendation, but not all provided a final score. † Score out of 20. ‡ Score out of 10.

Box 4 –
Final suite of 21 recommended quality improvement tools and resources

Tool name, URL and description

Target audience

PC-PIT elements

Country developed

No. who recommended tool (n = 9)


Clinical engagementhttp://www.institute.nhs.uk/quality_and_service_improvement_tools/quality_and_service_improvement_tools/clinical_engagement.htmlThis suite is designed to engage clinicians at the start of the project to help plan and avoid pitfalls of instigating change.

M, N, MG

L, CM

UK

9

Plan, Do, Study, Act (PDSA) (NHS)http://www.institute.nhs.uk/quality_and_service_improvement_tools/quality_and_service_improvement_tools/plan_do_study_act.htmlThis tool provides a framework for developing, testing and implementing changes leading to improvement. It can be used to test an idea by temporarily trialling a change and assessing its impact.

M, N, MD, MG, AR

L, CM, P, IT

UK

9

Event Analysis: the Seven Stepshttp://arkiv.patientsikkerhed.dk/media/609926/dsp_laeringssaet_uk_web.pdfThis work provides seven steps to key event analysis in primary care. It was inspired by the NHS Significant Event Audit Guidance for Primary Care.

M, N, MG, AR

All

Netherlands/Belgium

9

Patient Assessment of Care for Chronic Conditions (PACIC)http://www.improvingchroniccare.org/index.php?p=PACIC_Survey&s=36The PACIC measures specific actions or qualities of care, congruent with the Chronic Care Model, that patients report they have experienced in the delivery system. It can be used in conjunction with ACIC.

P

PCC, C

US

8

SafeQuest (NHS Education Scotland)http://www.nes.scot.nhs.uk/media/6362/Safety%20climate%20questionnaire%20MASTERCOPY.pdfQuestionnaire (30 items) to measure perceptions of safety climate in primary care. Intended for use by all members of the primary care team. Questions cover workload, communication, leadership, teamwork, safety systems and learning.

M, N, MD, MG, AR

PCC, C, CM, P, L, G

Scotland

8

Quality Improvement Hubhttp://www.qihub.scot.nhs.uk/education-and-learning/qi-e-learning.aspxA suite of 16 e-learning modules to support the quality improvement learning journey. Includes commonly used tools and examples (not all are relevant to the Australian context).

M, N, MD, MG, AR

L, CM, P, IT

Scotland

8

Leanhttp://www.institute.nhs.uk/quality_and_service_improvement_tools/quality_and_service_improvement_tools/lean.htmlLean is an improvement approach to design or redesign services to ensure that work done adds value to patient care. It links to a number of other change innovation tools (eg, process mapping and the cause and effect diagram).

M, N, MD, MG, AR

PCC, C, L, G, CM, P

UK

8

Plan, Do, Study, Act (RACGP)New title: Putting prevention into practice (“Green Book”, 2006)http://www.racgp.org.au/your-practice/guidelines/greenbookThe PDSA method involves a “trial and learning” approach in which an idea, hypothesis or suggested solution for improvement is made and tested on a small scale before any changes are made to the whole system. It is a cyclical model, allowing improvements to be achieved and refined in one or more cycles.

P, M, N, MD, MG, AR

All

Australia

8

Advanced Access and Efficiency Workbook for Primary Carehttp://www.hqontario.ca/portals/0/Documents/qi/qi-aae-interactive-workbook-en.pdfThe workbook outlines fundamental information required to understand the concept of advanced access and efficiency, plus tools, measures and techniques used to assist implementation. Information is presented in a practical format and is backed by the experience of clinicians and change management consultants.

MG

All

Canada

7

RACGP Clinical guidelineshttp://www.racgp.org.au/your-practice/guidelinesLinks to more than 50 endorsed clinical guidelines to assist general practitioners and allied health care staff in their work. Many of these guides also assist with improving practice organisation (eg, Guidelines for preventive activities in general practice).

M, N, MG

G, C

Australia

7

Assessment of Chronic Illness Care (ACIC)http://www.improvingchroniccare.org/index.php?p=Survey_Instruments&s=165Designed to help organisations evaluate the strengths and weaknesses of their delivery of care for chronic illness in six areas: community linkages, self-management support, decision support, delivery system design, information systems and organisation of care. Two versions (ACIC 3.0 and 3.5) are available and may be used in conjunction with PACIC.

M, N, MD, MG, AR

All

US

7

Creativity Toolshttp://www.institute.nhs.uk/quality_and_service_improvement_tools/quality_and_service_improvement_t%20ools/creativity_tools_-_an_overview.htmlCreativity tools are tried and tested ways of coming up with new solutions and perspectives to an issue or problem. These approaches include: brainstorming, six thinking hats, that’s impossible, fresh eyes, wish for the seemingly impossible, simple rules to thinking differently, and the affinity diagram.

M, N, MD, MG, AR

All

UK

7

Pen Computer Systems Clinical Audit Tool (CAT) resourceshttp://www.clinicalaudit.com.au/using-cat/installation-and-user-guidesA data extraction and analysis tool compatible with Best Practice and Medical Director software. It acts as an online clinical audit tool with links to Classic CAT, Cleansing CAT and PAT CAT. The tool enables efficient implementation of clinical interventions, comparison of Medicare Benefits Schedule item number utilisation and identification of at-risk populations.

M, N

IT

Australia

6

Diabetes prevention and management in general practice: using the Pen Computer Systems Clinical Audit Toolhttp://www.diabetesvic.org.au/Advanced-Search-Result-Detail?ocmsLang=en_US&content_id=a1R9000000I9UoyEAFThis resource gives ideas and suggestions on ways of approaching the systematic prevention and management of people with diabetes in order to allow practices to implement and measure change.

M, N

PCC, G

Australia

6

Patient Surveys: Research and Resourceshttp://www.hscr.co.nz/research-and-resourcesThis site provides links to resources, tools and articles including Handbook on improving your practice with patient surveys.

MG

PCC, C, P

New Zealand

6

Primary Care Resources and Supports (PCRS) for Chronic Disease Self Managementhttp://www.diabetesinitiative.org/support/documents/PCRSwithBackgroundandUserGuide.Rev12.08.FINAL.pdfThe PCRS was developed for primary care practices interested in improving self-management support systems and service delivery. It is designed to be used with multidisciplinary teams working together to manage a patient’s health care.

M, N, MD

PCC, C, P

US

6

Protecting your practice informationhttp://www.racgp.org.au/your-practice/ehealth/protecting-informationOnline links related to protecting practice information, including computer and information security standards, using email in general practice, privacy and effective solutions for e-waste.

M, N, MD, MG, AR

G,C, CM, P, IT

Australia

6

Patient Engagement Projectshttp://www.cfhi-fcass.ca/OurImpact/ImpactStories/ImpactStory/2012/10/31/93366af2-5ef7-48df-9a7e-6c98d880e236.aspxThis site links to three innovative patient resources to facilitate the process of patient engagement.

M, N, MD

PCC, P, C

Canada

5

Interpersonal Processes of Care Survey (IPC-29)http://dgim.ucsf.edu/cadc/cores/measurement/ipcindex.htmlThe IPC survey is a patient-reported, multidimensional, 29-item instrument appropriate for patients from diverse racial and ethnic groups. The survey assesses sub-domains of communication, patient-centred decision making and interpersonal style.

P

PCC, P

US

5

Practice Staff Questionnaire (PSQ)http://www.fmdrl.org/index.cfm?event=c.getAttachment&riid=3895The PSQ has been designed and used to gather information about a practice’s culture. It contains 62 statements for staff to indicate their degree of agreement as it applies to their practice. The survey is designed to be completed by all practice staff.

M, N, MD, MG, AR

L,G, C, CM, P

US

5

Health Service Co-Designhttp://www.healthcodesign.org.nzThis resource provides a range of flexible tools for working effectively with patients in service improvement work. While the focus is on patients themselves, the tools can be equally applied to other groups such as frontline staff, family and carers.

All

All

New Zealand

5


NHS = National Health Service. PC-PIT = Primary Care Practice Improvement Tool. RACGP = Royal Australian College of General Practitioners. UK = United Kingdom. US = United States. Target audiences: AR = administration/reception. M = medical. MD = multidisciplinary. MG = management. N = nursing. P = patients. All = all the above. PC-PIT elements: C = communication. CM = change management. G = governance (organisational and clinical). IT = information and information technology. L = leadership. P = performance culture. PCC = patient-centred and community-focused care. All = all elements. Web links provided for each tool were current at the time of publication.

Trial of the Primary Care Practice Improvement Tool: building organisational performance in Australian general practice and primary health care

As the cornerstone of health care, primary care should be effective, efficient and responsive to the needs of patients, families and communities.1 The Australian primary care system currently has significant opportunities to co-create approaches to quality improvement (QI) and practice redesign in ways that could fundamentally improve health care in Australia. To ensure these efforts are successful, there is a need to build and sustain the ability of primary care practices to engage in QI activities in a systematic, continuous and effective way.2 Primary Health Networks (PHNs) are a central component of the government’s primary health care reforms and have a number of roles in improving the quality of primary care. They will work closely with general practices and other primary care services in planning and supporting primary care teams to adopt QI initiatives, with the overall aim of improving care delivery and health outcomes.3,4

The Australian Commission on Safety and Quality in Health Care has recently developed a national set of practice-level indicators of safety and quality for primary health care. These indicators are designed for voluntary inclusion in QI strategies at the local practice or service level and are intended for local use by organisations and individuals providing primary health care services.5 The Australian Safety and Quality Framework for Health Care was also developed, which sets out the actions needed to achieve safe and high-quality care for all Australians.6 To respond effectively to these, primary care practices will need to be equipped with both organisational development and change management approaches. In response, the Primary Care Practice Improvement Tool (PC-PIT), an organisational performance improvement tool, was co-created for Australian primary care.7

The co-creation methods involved combining results from a systematic literature review8 and pilot study9 with cyclical feedback from partners and end users (general practices), using a variety of engagement platforms (interviews, face-to-face meetings, formal presentations, workshops and webinar discussions).10 The systematic literature review identified 13 elements integral to high-quality practice performance, which was defined as “systems, structures and processes aimed to enable the delivery of good quality patient care” but which do not necessarily include clinical processes.11 During discussion sessions, stakeholders and end users identified a list of desired attributes for a performance improvement process; namely, that it should be simple, accessible online, enable a “whole-of-practice” approach, be an internal process facilitated by practice managers or nurses without the need for extensive external facilitation, have additional support resources, be no or low cost and fit with existing QI or practice support programs.

The tool resulting from this combination of processes, the PC-PIT, was initially piloted with six high-functioning practices.9 In this study, we trialled the refined PC-PIT approach nationwide with three objectives: (i) to document and describe the use of the online PC-PIT in practice; (ii) to validate the PC-PIT independent practice visit objective indicators; and (iii) to identify the perceived needs (eg, resources, professional development) to support practice managers as leaders of organisational improvement in general practice.

Methods

We conducted the national PC-PIT trial from March to December 2015, with volunteer general practices from a range of Australian primary care settings. Practices were invited to participate using newsletter information sheets distributed by partner and stakeholder organisations and through national webinars and conference workshops. We used a mixed-methods approach, collecting both quantitative and qualitative data. A full description of the trial protocol is available in Appendix 1. Ethics approval for the study was granted by the University of Queensland Behavioural and Social Sciences Ethical Review Committee (approval number 201000924).

The PC-PIT trial consisted of two parts. In Part 1, practice staff at all participating practices completed the online PC-PIT, with each practice staff member giving a subjective assessment of how they perceived their practice met (or did not meet) the best practice definition of each of the 13 PC-PIT elements, using a 1–5 Likert rating scale.

For Part 2, we selected a purposeful sample of the primary care services to represent a range of practice sizes, business models and geographic locations. Two external raters conducted an independent practice visit to each selected practice, during which they assessed the subjective practice assessment from Part 1 against objective indicators of the same 13 PC-PIT elements, as supported by documented practice evidence. Each rater completed a separate evidence assessment form and ranked a set of objective indicators for each PC-PIT element (using a 1–5 Likert scale) by reviewing the documented practice evidence; working with both practice managers and practice nurses to identify and cite the evidence. Box 1 provides a summary of the Likert ratings and how they are interpreted in the context of the PC-PIT elements.

Data were gathered from a variety of sources during the independent practice visits, including interviews with practice managers and practice nurses, background materials and documented evidence such as meeting minutes, policy and procedure manuals, and communications books. Well documented strategies to enhance trustworthiness and rigour were incorporated in the qualitative phase of the study design; namely, that the two raters cited the sources, which allowed the triangulation of information and the review and confirmation of findings.12,13 The in-depth, semi-structured interviews with practice managers and practice nurses explored their involvement in QI and also their perceptions of resources and support needed to facilitate their role in performance improvement. A proforma was used to guide the interview discussions and all interviews were recorded, either manually or using a digital recorder. Interviews were then transcribed, and participants were provided with the opportunity to review and edit their responses.

The staff ratings for the PC-PIT elements from Part 1 were aggregated to a median practice score for each element and then compared with the ratings from the objective indicators in Part 2 and displayed in two side-by-side spider diagrams. These data were presented to each practice in individual PC-PIT reports, thus presenting a profile of practice performance against each of the 13 elements, using staff perceptions compared with documented practice evidence. Appendix 2 provides two de-identified examples of completed PC-PIT reports, including spider diagrams, as provided to a higher- and a lower-scoring practice. Practice managers used their PC-PIT reports to lead staff discussions about the identification of specific improvements to be made, strategies to achieve them, a time frame, measures of success and the staff member(s) responsible. This was then formalised using the Plan, Do, Study, Act (PDSA) approach.

Data analysis

Quantitative data were entered into a Microsoft Excel 2013 spreadsheet, then imported into SPSS version 21.0 (SPSS); data were analysed using SPSS and Excel. A key outcome measure was the degree of concordance between Rater 1 and Rater 2 during the independent practice visits, measured using concordance and κ statistics. Standard integer weights were used, as described by Fleiss.14

A total of 32 in-depth, semi-structured interviews were held (with 19 practice managers and 13 practice nurses). Transcribed interviews were coded by one member of the research team (L C) using NVivo 10 (QSR International). Codes were reviewed for duplication and clarity. We used thematic analysis to identify and classify recurrent patterns and themes. Interviews focused on aspects such as the background training and current role of the practice manager and practice nurse, QI experience of the individual interviewees and the most recent QI undertaken in the practice.

Results

A total of 45 general practices participated in Part 1 of the PC-PIT trial. At the time of writing, complete datasets were available for 34 of the 45 practices. These represented a range of geographic locations (urban, regional and rural areas), although most were urban and regional practices. It also included a range of practice sizes (< 2, 2–< 5, 5–< 10, 10&plus; full-time-equivalent general practitioners) and represented a range of business models (privately owned, partnerships and corporate business models). Ten of the 34 practices described both undertaking internal QI activities, such as PDSA cycles, and involvement in externally run QI activities, such as Medicare Local programs, National Prescribing Service activities and the Australian Primary Care Collaboratives. The remaining practices described either internal QI activities or involvement in external improvement programs. One practice was newly established and had not undertaken any improvement activities within the past 12 months. The practice managers came from a variety of backgrounds, including business management, nursing and allied health. Appendix 3 details the characteristics of the 34 participating practices.

Of these trial practices, 20 were selected for the independent practice visits and qualitative interviews in Part 2, and complete datasets were available for 19 practices. One practice was excluded due to competing commitments of the practice manager, which made it impossible for the independent practice visit to be conducted by the raters during the study timeframe.

Assessment of practice performance against the PC-PIT

A total of 310 online PC-PIT forms were completed in Part 1 by practice staff, comprising 19 practice managers, 95 GPs, 56 practice nurses, 109 administration and reception staff, 25 allied health (including pharmacy) staff and six “other” staff (primarily in business development, finance or information management roles). Using the combined online PC-PIT element ratings, the independent practice visit ratings and interviews with practice managers and practice nurses, three specific practice types were identified among the 19 practices from Part 2, each with a distinct way of using the PC-PIT. Rather than being discrete, these three types represented key points along a continuum of organisational performance, from lower-scoring to higher-scoring practices.

First practice type

The three lowest-scoring practices appeared to have separate and uncoordinated clinical and practice management processes. This was evidenced by uncoordinated clinical governance and organisational management activities and the incomplete translation of clinical and management processes into formalised policies and protocols that were clearly known and understood by all staff (both clinical and administrative).

Second practice type

A further three practices had a primary focus on clinical governance, with organisational management as a supporting basis. In this model, practice managers had limited or no autonomy in relation to organisational changes within the practice. This was illustrated by a lack of cited documented evidence (and therefore lower scores) on the PC-PIT element of organisational management, including key indicators such as evidence of staff role descriptions, performance appraisals, internal QI activities and the use of information such as data reports, formal meetings and discussion to improve the internal function of the practice. The practice manager generally worked in a supporting role to the GP(s), but there was limited evidence of communication and coordination between clinical and organisational management.

Third practice type

The five highest-scoring practices recognised the equal importance of organisational and clinical management in supporting the ongoing operation of the practice as a whole, demonstrated by high ratings in both the independent practice visit and staff online PC-PIT forms. Documented evidence of meeting minutes and previous PDSA processes and outcomes showed that management processes were constantly reviewed in a combined approach by clinical and administrative–management staff and readjusted to facilitate patient care. These practices demonstrated close communication and shared decision making in relation to continuous QI, championed by an autonomous practice manager who worked closely with a defined clinical leader. They were also more likely to have a history of involvement in a range of external continuous QI programs.

The remaining eight practices fell along the continuum, with most toward the lower-scoring end. These practices were generally characterised by positive staff perceptions of the 13 PC-PIT elements but a lack of documented supporting evidence, particularly on the use of practice data in making ongoing improvements to their organisational processes and in reviewing and using performance results. Box 2 provides examples of the three practice types, the median PC-PIT element scores given by the staff and the raters, illustrative interview quotes and the evidence cited during the independent evidence assessments.

Agreement between raters: independent practice visits

Overall, there was complete agreement between the two raters in 11 of the 19 general practices. Rater 1 scored higher for 11 PC-PIT elements and lower for one. The mean difference was 0.10. Box 3 presents the agreement between raters and the κ statistic for each element. The element with the lowest κ (0.43) was team-based care. For this element, the two raters agreed in 11 of the 19 practices; Rater 1 scored higher than Rater 2 in seven practices and lower in one. If we excluded this element from the overall κ coefficient, the χ2 test for homogeneity was 14.66 (P = 0.20).

To identify reasons for key discrepancies by practice and by element, the raters reviewed their evidence-based assessment forms and discussed possible reasons for the discrepancies. The discrepancy in Practice 10 was due to circumstances that required the raters to interview different informants and cite separate documentation in relation to the PC-PIT elements. Poor concordance between the ratings for the element of team-based care reflected a lack of formally documented policies and procedures available to practice managers, while additional undocumented information could be provided by practice nurses. Rater 1 scored this verbal (but undocumented) information, while Rater 2 did not (Box 3).

In terms of practices, Rater 1 scored more elements higher than Rater 2 in six practices, especially for Practice 10, where there was agreement on only one element (Appendix 4).

Resource and support needs of practice managers

During the in-depth interviews, four key themes were identified in relation to practice managers’ perceived resource and support needs (Appendix 5). Most practice managers were not familiar with internal organisational development tools other than those previously developed by the former Divisions of General Practice. Most of these tools were neither trialled nor validated in general practice settings. Only one practice manager described the use of a formalised approach to organisational development (Six Sigma), which was recently adapted for use in general practice but required extensive external facilitation to complete. Practice managers perceived the benefits of having additional supporting tools relating to elements in the PC-PIT, and also identified strategies such as online forums or email updates, based on the PC-PIT elements of high-performing practices, which might focus on sharing key problems and solutions for organisational performance improvement.

Discussion

This national trial of the PC-PIT determined that it can be a useful organisational performance tool in various general practice settings.

As health care delivery becomes more complex and technology-driven, the organisational context in which QI initiatives take place becomes increasingly recognised as a crucial determinant of their effectiveness.16,17 Contextual elements have been described as the “adaptive reserves” of a practice; that is, those features that represent a practice’s internal capability.18 They include features such as culture, leadership, collaboration and teamwork, data and information tools, improvement skills, incentives and time allocation, which general practices should address to support a context of continuing QI.19

The establishment of the PHNs and the release of the consultation paper for the review of the Performance and Accountability Framework indicators20 illustrate the integration of aspects of QI across the health reform strategy. Although as yet incomplete, the national Performance and Accountability Framework objectives relating to quality focus on outputs related to safety, responsiveness (based on measures of patient experience), capability and capacity.20,21 Following this, the proposed national PHN evaluation framework lists continuous QI activities, outputs and outcomes related to provision of practice support and the identification of high-priority practices (those practices requiring targeted support to build their capacity to engage in QI), such as accreditation and the use of data for practice improvement.

The need to develop and strengthen managers’ skills also involves the development of management processes for motivation, supervision control and action, and support at an organisational level.22 Practice managers may be responsible for large and fluctuating numbers of staff, high yearly financial turnovers and the ongoing facilitation and management of change; many do so with limited timely access to appropriate ongoing training and validated support resources. While there is an undeniable need to focus on the role of GPs in QI, it is also worth noting that the elements relating to organisational improvement are also the domain of practice of operational managers.

Although the independent practice visit was conducted by two external raters in this trial, we anticipate that this aspect will become part of the PC-PIT as a wholly internal assessment process. However, future testing of the PC-PIT will seek to further address the discrepancies relating to the involvement of different practice staff members (ie, practice managers v practice nurses) in the use of the evidence-based assessment forms. The objective indicators for the element of team-based care have also been refined and clarified to include additional meeting minutes and documentation accessible to either practice managers or practice nurses, to ensure that all available evidence is taken into account during the assessment.

Two of our partner organisations, the Royal Australian College of General Practitioners and the PHNs, identified a key benefit of the PC-PIT as the ability to identify the lower-scoring practices and more effectively engage them in organisational improvement activities, allowing for more targeted interventions that are relevant to the capacities of the individual practices. Thus, there are two aspects to the future sustainability of the PC-PIT: (i) embedding the PC-PIT approach into existing QI frameworks, and (ii) further research into the role of the PC-PIT in supporting performance improvement in primary health care. The PC-PIT approach will be further developed to include a suite of high-quality, validated and free-to-access resources that complement the use of the tool.23,24

Limitations

Although this trial was conducted with volunteer practices, every effort was made to ensure a range of geographic locations and practice sizes were incorporated in the inter-rater comparison. However, there was an over-representation of urban and regional practices. Many rural practices were unable to commit due to perceptions of the time required to complete improvement activities. However, this is an area that may be of interest to the newly established PHNs, given their formal role as facilitators and supporters of practice engagement in QI. We also acknowledge the lack of consumer involvement during the trial phase of the PC-PIT. Further work to refine and embed the PC-PIT in existing QI programs will seek to involve the Consumer Health Forum of Australia as a key partner in the process, with emphasis on the role of consumer feedback as an embedded feature of external validation.

In relation to the inter-rater comparison, the calculation of the aggregate value of κ over the 13 PC-PIT elements assumes that the κ values are independent, which is unlikely. The lack of independence, however, is unlikely to affect the aggregate value but might increase the standard error to a small degree.

Conclusion

With the refocus on the importance of organisational aspects of practice in relation to quality care delivery, the time is now right to focus on a standardised, internally led approach to improving practice performance, designed for the dynamic context of primary care. Work with our key partners and end users is ongoing, with the aim of further trialling and embedding the PC-PIT within existing QI initiatives.

Box 1 –
Interpretation of the staff and independent practice visit (IPV) ratings for the PC-PIT elements

Staff rating*

IPV rating*

What it means

What it indicates


1–3 (perception)

1–3 (objective indicators)

Staff perceive the practice does not at all meet (rating 1) or only partially meets (ratings 2–3) best practice definition of element.IPV indicates practice does not at all meet (rating 1) or only partially meets (ratings 2–3) best practice definition of element.

Improvement needed. Recognised by staff and demonstrated by objective indicators.

4–5 (perception)

4–5 (objective indicators)

Staff perceive the practice entirely meets (rating 5) or almost entirely meets (rating 4) best practice definition of element.IPV indicates practice entirely meets (rating 5) or almost entirely meets (rating 4) best practice definition of element.

No or limited improvement needed at this time. Focus is on monitoring and sustaining best practice function.

1–3 (perception)

4–5 (objective indicators)

Staff perceive the practice does not at all meet (rating 1) or only partially meets (ratings 2–3) best practice definition of element.IPV indicates practice entirely meets (rating 5) or almost entirely meets (rating 4) best practice definition of element.

Improvements needed. Indication that the best practice processes evidenced in the practice documentation (policy and protocols) are not embedded in practice workflow and/or are unknown by practice staff.

4–5 (perception)

1–3 (objective indicators)

Staff perceive the practice entirely meets (rating 5) or almost entirely meets (rating 4) best practice definition of element.IPV indicates practice does not at all meet (rating 1) or only partially meets (ratings 2–3) best practice definition of element.

Improvements needed. Indication that the best practice processes perceived by staff are not evidenced in practice documentation (policy or protocols).


PC-PIT = Primary Care Practice Improvement Tool. * 1–5 Likert scale.

Box 2 –
Practice types and illustrative interview quotes from the independent practice visits (IPVs)

PC-PIT element

Rating*


Examples from qualitative interviews

IPV sources

Improvements identified

Staff

IPV


First practice type: Separate clinical and organisational management processes; lack of coordinated approach

Governance — organisational management

3

2

We have separate but … regular admin meetings; just no joint meetings with the GPs. I can’t make any changes here, I’m not allowed to really … and so there’s just no way to do it … I don’t even know when [the GPs] are planning leave. We don’t know who is following up any urgent pathology or other results, we don’t know if we should be offering patients appointments with other GPs so we can’t even tell [patients] when their GP will be back … and I don’t know what to tell the reception staff to do … I developed up this flow table, which shows what we have to do, it can go in our manual but we’re not doing it in practice. We need to sort this out — it’s part of our 2015 accreditation but there’s just no motivation (practice manager)

Policy and procedures manuals; practice manager interview; agenda and meeting minutes (administrative and clinical meetings)

Developing (i) a staff leave recording system, and (ii) a formalised GP buddy system using established protocol developed by practice manager and GP, following accreditation requirements

Performance — performance results

4

2

We have a PenCat report on our type 2 diabetes patients — it shows the number of patients and treatment information … I send it to the GP and registrars to help with our service delivery (practice manager)A review of the report by the IPV raters showed the data were incorrect. There was a significant underestimate of current active type 2 diabetes patients. A further review of patient data showed this was primarily due to a lack of consistent diagnosis information recorded for patients with type 2 diabetes. The practice manager was not aware the report was incorrect.There aren’t standard approaches to data entry — for clinical data into our patient files; we have a lot of registrars that come and go … they enter things the way they want — we haven’t got a standard way of entering information. I think we could develop a standard system for the common things like diabetes, a session for new registrars and have a reminder sheet … I haven’t spoken with the practice manager about it … we don’t really get together to discuss problems (practice nurse)

Practice software and PenCat report on patients with active type 2 diabetes; practice manager and practice nurse interviews

Practice manager to undertake further training in the use and interpretation of the PenCat tool and reports; practice manager and practice nurse to develop protocols to guide clinical data entry for visiting registrars; role of the practice nurse in data cleaning to be defined and formalised, with initial focus on patients with type 2 diabetes

Second practice type: Primary focus on clinical governance; organisational management is basis for clinical support

Change management — incentives

3

5

There are a range of incentives that are available … they’re mostly for the GPs but there are some for the staff … maybe [the staff] don’t really know about them … or maybe we don’t update them and tell them … it’s sort of something I guess we need to keep track of (practice manager)In reviewing the available evidence, the IPV raters found there were policies concerning paid leave and financial support for staff to attend training and conferences, but it was clear from the median staff score that the staff were unaware of the available incentives. While these incentives may have been part of documented practice policy, they were not a part of daily workflow or staff performance review

Human resource manuals; policy and procedures manuals; meeting minutes; position descriptions; practice nurse, practice manager and GP interviews

Developing quarterly news sheet for staff outlining upcoming professional development opportunities approved by practice and method of applying for support to attend; review of existing protocols to support staff education and training in practice

Third practice type: Clinical and organisational management equally important; coordinated and consultative approach to patient care and practice management

All elements

4

4

Our principal GP here and myself are talking now … we want to work together on looking at our patients with type 2 diabetes, especially the organisational side of recall and follow-up, with our nurses and admin staff … we think it would be good to see how changes made to the management of our recall and follow-up systems result in better HbA1cs and other outcomes for our patients (practice manager)

Human resource manuals; policy and procedures manuals; data printout (patients with active type 2 diabetes); meeting minutes; position descriptions; communication book; practice nurse and practice manager interviews

Initial focus on reviewing current recall and follow-up procedures; working to identify appropriate methods to link


GP = general practitioner. PC-PIT = Primary Care Practice Improvement Tool. * Median rating; 1–5 Likert scale.

Box 3 –
Agreement between raters, by PC-PIT element

Element

Sub-element

Number of practices for which:


κ statistic (95% CI)*

SE

Rater 1 higher

Raters agreed

Rater 2 higher


Patient-centred care

2

16

1

0.78 (0.54–1.00)

0.12

Leadership

1

17

1

0.86 (0.68–1.00)

0.09

Governance

Organisational management

4

14

1

0.64 (0.35–0.93)

0.14

Clinical governance

3

14

2

0.65 (0.38–0.92)

0.14

Communication

Team-based care

7

11

1

0.43 (0.14–0.73)

0.15

Availability of information for patients

4

14

1

0.54 (0.27–0.83)

0.14

Availability of information for staff

4

14

1

0.59 (0.26–0.92)

0.17

Change management

Readiness for change

3

15

1

0.68 (0.39–0.96)

0.14

Education and training

0

18

1

0.87 (0.63–1.00)

0.12

Incentives

1

18

0

0.91 (0.74–1.00)

0.09

Performance

Process improvement

2

16

1

0.85 (0.69–1.00)

0.08

Performance results

3

16

0

0.86 (0.70–1.00)

0.08

Information and IT

1

18

0

0.93 (0.81–1.00)

0.06


IT = information technology. PC-PIT = Primary Care Practice Improvement Tool. SE = standard error. * κ statistic and associated 95% CI: κ > 0.8 represents almost perfect agreement beyond chance; 0.60 < κ ≤ 0.80 represents substantial agreement; 0.40 < κ ≤ 0.60 represents moderate agreement; 0.20 < κ ≤ 0.40 represents fair agreement; 0.00 ≤ κ ≤ 0.20 represents slight agreement; and κ < 0.00 represents no agreement beyond chance.15 Overall κ coefficient: 0.82 (95% CI, 0.76–0.87); SE, 0.0287. Test for homogeneity: χ2 = 21.34; df = 12; P = 0.046.

Quality tools and resources to support organisational improvement integral to high-quality primary care: a systematic review of published and grey literature

There is growing awareness of the need to improve quality in health care, including in primary care.14 In Australia, this is witnessed by the National Primary Health Care Strategy, with its focus on the importance of quality as a foundation and driver of change.2 There is also an ongoing push for the development of new indicators for performance improvement, quality and safety benchmarking, and change management approaches and strategies for quality improvement (QI) in primary care.2

There are diverse terms and definitions used for QI,5 and varying QI strategies involving structured processes that include assessment, refinement, evaluation and adoption of processes used by individuals, teams, an organisation or a health system, with the aim to enhance some aspect of quality and achieve measurable improvements.6,7 These can include simple tools, such as flow charts and checklists; more complex multiple-method tools, such as re-engineering; and frameworks, such as the Plan, Do, Study, Act (PDSA) and audit cycles.8 These strategies have yielded modest change and are often not sustained over time.8,9 There is increasing evidence that QI initiatives that are locally owned and delivered, team-focused, formative and flexible and involve interorganisational collaboration and networking are more sustainable and yield better outcomes.10,11 The primary care practice team has a responsibility for QI as part of clinical and organisational governance, and team members are encouraged to collaboratively engage in QI activities in areas that will improve the safety or quality of patient health care.1216 Primary care practices that embrace a QI culture and support QI initiatives are likely to have better health outcomes, better care delivery and better professional development.1,7,17,18

There is currently no single tool available to Australian general practices that combines traditional areas of clinical governance and less widely used aspects of organisational performance.19 In response, the Primary Care Practice Improvement Tool (PC-PIT)11 was co-created by a range of stakeholders using various engagement platforms, including ongoing cyclical feedback from partners and end users. The result is an organisational performance tool tailored to Australian primary care.11 The PC-PIT includes seven key elements integral to high-quality practice performance: patient-centred and community-focused care; leadership; governance; communication; change management; a culture of performance; and information and information technology. Results from the pilot study and the trial of the PC-PIT indicate that this tool offers an appropriate and acceptable approach to internal QI in general practice.11,20 The findings also showed that additional QI tools and resources are necessary to support the seven elements in the PC-PIT.20 Therefore, we aimed to undertake a systematic review of the international published and grey literature to identify existing primary care QI tools and resources that could support organisational improvement related to the seven elements in the PC-PIT. The identified tools and resources were then included in the next phase of study, which used a Delphi approach to assess the relevance and utility of these tools and resources for use in Australian primary care and to complement the PC-PIT.21

Methods

We undertook a systematic review of published and grey literature to identify existing online QI tools and resources to be included in a Delphi study assessing their relevance and utility in Australian general practice.21

Search strategy

In March 2014, we searched the electronic databases CINAHL, Embase and PubMed for articles published between January 2004 and December 2013, using the search strategy outlined in Table 1 of Appendix 1. We searched for articles where the search terms appeared in the title, abstract or subject headings, and limited results to those published in the English language. All searches were designed and conducted in collaboration with an experienced search librarian. We imposed no restrictions on the type or method of QI tool or resource and included any simple tools, multiple-method tools or frameworks that can be used by an individual in the practice, teams in the practice or the whole organisation to improve any aspect of organisational quality related to any of the seven elements in the PC-PIT.

In March–April 2014, we also conducted a comprehensive search of grey literature for documents dated between 1992 and 2012.22,23 This included an iterative manual search of the electronic database GreyNet International (http://www.greynet.org) and relevant government and non-government websites (Appendix 2). We consulted experts in primary care and QI to ensure key electronic databases, organisation websites and online repositories were included in the search. Searches were also conducted using Google Advanced Search (http://www.google.com/advanced_search) and repositories such as OpenGrey (http://www.opengrey.eu), WorldCat (http://www.worldcat.org) and OpenDOAR (http://www.opendoar.org).

For all relevant tools and resources identified through the grey literature search, we also searched in the research databases CINAHL, Embase and PubMed, as well as Google Scholar, for evidence of their use in practice. Search terms used in the grey literature search are shown in Table 2 of Appendix 1.

Finally, we reviewed the bibliographies of all identified relevant studies, reports, websites, databases, tools and resources to identify any additional QI tools and resources for inclusion. All additional tools and resources identified through this snowballing process underwent the screening and assessment process.

Selection of studies, tools and resources

All citations were imported into a bibliographic database (EndNote, version X7). To be included in the review, identified citations, tools and resources had to meet the following eligibility criteria: (1) purpose of the tool or resource is QI; (2) tool or resource is used in the primary care setting or has potential for use in primary care; (3) tool or resource addresses at least one of the seven elements integral to high-quality primary care practice; and (4) tool or resource is available and in the English language.

The initial screening process involved two reviewers (S U and T J) screening the titles and abstracts of published citations and any articles, reports, tools or resources identified through the grey literature, and categorising them as “relevant” or “not relevant” according to the review objective. The full texts of all tools and resources deemed relevant were sought and reviewed by two independent reviewers with expertise in primary care QI (S U and T J) to further assess their relevance according to the eligibility criteria.

There is no single well established assessment or scoring instrument suited for QI tools and resources that covers the broad range of tools and resources included in this review. Therefore, we developed a four-criteria appraisal framework from common sets of criteria proposed for assessing a range of QI tools, resources and initiatives, such as guidelines, instruments, programs and web-based resources (Box 1).2430 All identified tools and resources that met the eligibility criteria were evaluated for their accessibility (ie, able to be accessed online and at no cost), relevance, utility and comprehensiveness using this four-criteria appraisal framework. Two reviewers (S U and L C) independently gave each tool or resource a score out of 8 using the criteria. Tools or resources with a score of 7–8 were rated as the “best” and passed on to the Delphi study21 for further assessment. Tools and resources rated less than 7 were rejected and not included in further assessment. The reviewers compared their ratings, and any discrepancies were resolved through discussion.

Data extraction and synthesis

We created a data extraction template using Microsoft Excel to assist in systematically extracting information about the tools and resources that met the eligibility criteria. A content analysis approach was used to explore each tool or resource to collate the following information: name of the tool or resource, year and country of development, author, name of the organisation that provided access to the tool or resource and its URL, accessibility information or problems, a brief overview of each tool or resource, the QI element(s) it addresses and any supporting evidence (published or unpublished data). If accessible, a copy of the tool or resource was downloaded into the bibliographic database. Any supporting evidence (studies, reports and any other data) on the use of the tool or resource in primary care was also added to the bibliographic database.

Results

The database search yielded 1900 citations after duplicate records were removed (Box 2). After reviewing the titles and abstracts for relevance to the review objective, the total was reduced to 249 articles. Of these, 140 did not meet eligibility criteria and were excluded, leaving 109 articles. Most excluded citations did not meet the eligibility criteria because the tools or resources were not used in primary care settings. From the 109 citations, 76 QI tools or resources were identified (Appendix 3).

The level of empirical evidence for each tool or resource varied substantially — some, such as the PDSA, had numerous studies supporting their use in primary care,3135 whereas others, such as the Organisational Capability Questionnaire,36 had only been taken to pilot stage. Of the 76 tools and resources identified in the published literature, 37 were rejected because of accessibility problems. Of the remaining 39 tools and resources, 19 scored less than 7 on the four-criteria appraisal and were rejected due to problems related to utility (n = 10), relevance (n = 3) and comprehensiveness (n = 6). This left 20 that were classified as the best tools and resources (Appendix 4).

Through the grey literature search, we identified 186 tools or resources that met the eligibility criteria (Appendix 5). Of these, 12 were rejected because of accessibility problems. A further ten tools or resources were duplicates and also excluded. Of the remaining 164 tools and resources, 131 scored less than 7 on the four-criteria appraisal and were rejected due to problems related to comprehensiveness (n = 99), utility (n = 16) and relevance (n = 16). This left 33 tools or resources identified as the best from the grey literature (Appendix 4).

Of the total 53 best tools and resources identified through published and grey literature, 13 were from Australia and the remainder were from the United Kingdom (n = 14), United States (n = 14), Canada (n = 4), New Zealand (n = 4) and Europe (n = 4). There was significant overlap of the PC-PIT elements covered by the best tools and resources, with most tools relevant to two or more elements integral to high-performing practices. Of the 53 identified tools and resources, 34 predominantly addressed performance, 20 governance, 19 patient-centred care, 15 change management, nine leadership, nine communication, and six information and information technology (Appendix 4).

Discussion

In an effort to strengthen primary care practices, and thereby strengthen the broader health care system, many providers, delivery systems and other organisations are supporting the use of QI initiatives to improve the performance of practices.37 There are currently no published data regarding the available QI tools and resources for Australian primary care. In this review, we identified and synthesised existing primary care QI tools and resources from the international published and grey literature that are relevant to the seven elements integral to high-quality primary care practice,19 which are specifically covered by the PC-PIT.11 Our findings provide data on QI tools and resources that can be used to support QI initiatives in primary care, including complementing and optimising the value of the PC-PIT.

Given the complexity of health care, developing, implementing and assessing QI initiatives is a dynamic, evolving and challenging area.38 This review illustrates the wide range of primary care QI tools and resources that are available. There is substantial variability in the accessibility, comprehensiveness and utility of tools and resources for primary care, as well as the evidence for their use. Many tools and resources require extensive (and often costly) external facilitation, which adds further complexity and limitations to their application in general practice settings.

Variability in evidence

There is a gap in the published literature on QI tools and resources in primary care settings, and the available literature is of varying quality.39,40 This is partly due to the complexities involved in reviewing a heterogeneous set of interventions that are applied in a varying set of contexts.41 This lack of scientific literature has somewhat inhibited the acceptance of QI methods in health care.38 With new approaches, tools and resources being introduced at a rapid pace and disseminated through the World Wide Web, there is some debate about the most effective QI tools and resources for use in the health care setting.7 Although new studies are emerging,38 there is a need for more rigorous evaluations of different QI tools and resources in primary care settings.39,42

Comprehensiveness of tools and resources

There are many approaches and strategies that can be used to improve the quality of primary care practices. These improvement strategies are generally divided into two types: improvement focusing on clinical areas and improvement focusing on quality from a management perspective.6 Although the two may share common themes, they are often seen as discrete parallel activities. For example, the NPS MedicineWise Clinical e-Audits are used to facilitate clinical QI by assisting GPs to review their prescribing practices,43 while the Advanced Access and Efficiency Workbook for Primary Care focuses on improving the organisational quality of the practice to enable patients to see their doctor when they need to.44 Some tools and resources, such as Lean,45 Six Sigma46 and the Manchester Patient Safety Framework,47 are based on theoretical frameworks, whereas others, such as the Canning Data Extraction Tools48 or the eCHAT (electronic case-finding and help assessment tool), are more pragmatic.49 Some tools and resources, such as the PDSA, Six Sigma and Significant Event Analysis, are well known.6,50 Other less well recognised tools and resources range from the simple, such as the Organisational Capability Questionnaire,36 to the more comprehensive, incorporating a range of other supporting tools, such as the UK’s National Health Service (NHS) clinical engagement resources51 and the NHS Scotland Quality Improvement Hub.52

Due to the complexity of primary care practice and the dynamic process of QI, several QI tools and resources could be used in conjunction with each other, or one after another, to yield successful outcomes; for instance, beginning with root-cause analysis, then using either Six Sigma or PDSA to implement a change in processes.38 Another example is the use of tools and resources for improving chronic illness care, such as using the Primary Care Resources and Supports for Chronic Disease Self Management53 in conjunction with the Assessment of Chronic Illness Care,54 with the former focused on self-management support and the latter on improved patient and staff competency in self-management processes.

Accessibility and utility of tools and resources

It can be challenging to engage practices in QI initiatives because primary care clinicians and staff often feel intense time pressures; have competing priorities; lack a culture and leadership that support change; lack resources, capability and capacity; and may fear the perceived costs of undertaking QI.7,17,18,55 Therefore, ease of access and utility are important factors in optimising the acceptance and adoption of QI initiatives in primary care practices.7,18 In line with the literature, the main reasons tools and resources were rejected in this review were that they rated poorly with regard to their comprehensiveness (42%), accessibility (19%), utility (10%) (ie, too complicated, contained difficult language, too time-consuming or required extensive facilitation) and relevance to primary care (8%).

QI efforts need to be substantially more efficient and easy to access and must reduce the burden on practices to maximise their adoption in primary care settings.17 Recognising this need, some health care organisations provide comprehensive online libraries of quality and service improvement tools and resources that are readily accessible and free of charge.5658 Nonetheless, it is often difficult for busy practitioners to navigate through multiple websites to obtain the right tools or resources for QI. Therefore, a better option would be a suite of QI tools and resources that is embedded into existing quality frameworks.

Support and incentives for quality improvement

Practices need to be supported and incentivised to adopt a QI culture and engage in continuous QI initiatives.7,18 Even the most determined practices are likely to require help in developing their QI capacity, such as skills to identify areas for improvement, knowledge and understanding of QI approaches, how to use data for QI, planning and making changes, and tracking performance over time.37 This demands the commitment of practice leadership and staff to dedicate time and resources to QI activities.37,38 Practices will also require external support, such as technical assistance, learning activities and tools and resources provided by organisations to assist practices undertaking QI initiatives.37

Public and private health care sectors around the world are now linking service quality with provider payment. Both the UK and the US provide financial incentives to some health care providers for adopting improved quality practices. Using a “pay for performance” system can drive and support practices to adopt QI initiatives to improve the quality of their practice and patient outcomes.59 In Australia, the Primary Health Care Advisory Group recently considered new payment mechanisms to better support the primary care system to drive safe and high-quality care.60

Limitations

Our review has several limitations. First, the exclusion of non-English-language literature may have omitted some relevant tools and resources. However, non-English tools and resources could not have been used in Australian primary care without being translated, which was not feasible within the scope of the study. Second, QI initiatives (including tools and resources) are poorly indexed in bibliographic databases.39 As such, we employed broad search strategies that used free text and Medical Subject Headings (MeSH) to optimise our search strategy. While we also included grey literature to capture tools and resources, an exhaustive search was not undertaken due to time constraints. Other studies have reported similar challenges.61,62 In response to this, we consulted with experts in the area to ensure that the key relevant electronic databases, organisation websites and online repositories were not missed in the search. Finally, the four-criteria appraisal framework and the method of rating the tools and resources was subjective and potentially biased, and we did not perform a sensitivity analysis against the robustness of the assumptions. Hence, caution is required when interpreting the classification and rating of each tool or resource. To address these limitations and increase reliability, the two reviewers who assigned the ratings discussed, checked and agreed on the scoring.

Conclusions

The necessity for QI initiatives permeates health care37,59,63 and presents opportunities to fundamentally improve health in Australia. Engaging primary care practices in QI and practice redesign activities allows them to work toward achieving improved quality, better health and improved patient and provider experiences, as well as reducing the ongoing costs of care.37,64 To ensure these efforts have a positive impact, there is a need to build and sustain the ability of primary care practices to engage in QI initiatives in a continuous and effective way. To foster QI capacity in Australian health care, we have identified tools and resources that can potentially be provided as part of a suite of tools and resources to support primary care practices in improving the quality of their practice, to achieve improved health outcomes. Following this review, a Delphi study was undertaken to evaluate the 53 best tools and resources to assess their relevance and utility in Australian general practice; the results are published elsewhere in this supplement.21

Box 1 –
Criteria for assessing the accessibility, relevance, utility and comprehensiveness of identified tools and resources2430

Each tool or resource was given a total score out of 8. Those with a score of 7–8 were rated as the “best” and passed on to the Delphi study for further assessment.21

  1. Accessibility of tool (yes/no; if yes to both items, tool or resource is assessed on Criteria 2–4)

    • Readily available (easy to access)
    • Accessible free of charge
  2. Relevance to primary care (2 points, one point for each item)

    • Supports organisational improvement related to the seven elements of the PC-PIT (patient-centred and community-focused care; leadership; governance; communication; change management; a culture of performance; information and information technology) integral to high-quality primary care practice
    • Complements the PC-PIT
  3. Utility (3 points, one point for each item)

    • Ease of use in primary care (structure and layout easy to follow, appropriate language, and feasible [not too time-consuming to use in general practice])
    • Can be used by all practice staff
    • Requires minimal training and support to use (does not require extensive external facilitation)
  4. Comprehensiveness (3 points, one point for each item)

    • Best available content (completeness, coverage, scope, currency of content related to the quality improvement element/s)
    • From a reputable source
    • Has supporting data (research or reports) demonstrating use in practice or potential use in primary care

PC-PIT = Primary Care Practice Improvement Tool.

Box 2 –
Flow diagram outlining selection process for tools and resources

A multifaceted intervention to reduce inappropriate polypharmacy in primary care: research co-creation opportunities in a pilot study

A goal of primary care research is to inform and facilitate beneficial change in health care delivery for both patients and clinicians in a way that is efficient for providers and economically sustainable for the health care system. Co-design or co-creation is a process whereby researchers and stakeholders jointly contribute to the ideation, planning, implementation and evaluation of new services and systems as a possible means to optimise the impact of research findings.1,2 Co-creation represents the highest form of stakeholder engagement, building on existing theories such as community-based participatory research,3 and emphasises the creation of value for both end users and researchers.

However, it is often infeasible to co-create with all stakeholders at all stages of a research project. Decisions must be made about which stakeholders to involve at different stages to achieve the greatest return on investment for researchers’ and stakeholders’ time and contributions, considering the context in which change is likely to occur.

In designing a controlled pilot study of a multifaceted intervention to reduce inappropriate polypharmacy in primary care involving 20 general practitioners and more than 150 patients in south-east Queensland, we identified both patients and prescribers as the most important stakeholders. For this project, however, we proposed that the critical gateway to effective co-creation in the first instance was the GP, with both the GP and patient to be involved in evaluating the pilot to inform future development. In this article, we describe the rationale for this approach, the process, challenge and value of co-creating with GPs in the planning and implementation of the intervention, and the anticipated value of involving both patients and GPs in the pilot’s evaluation.

Background

The impetus for this co-creation research project was Australian data suggesting high rates of potentially inappropriate medication use among older Australians, and its association with significant patient harm.4 The aim of the project was to design and pilot a multifaceted deprescribing intervention to minimise inappropriate polypharmacy in older people in primary care. Deprescribing is the systematic process of identifying and discontinuing the use of medicines where the actual or potential harms outweigh the benefits, giving due consideration to an individual patient’s care goals, current level of functioning, life expectancy, values and preferences.5 Box 1 shows an overview of the decision algorithm for use by the GPs in this pilot study. Deprescribing is an inherent principle of quality use of medicines and is part of good prescribing.7 The study presented here represents early-phase piloting and developmental work, as described by the United Kingdom Medical Research Council’s guidance for complex interventions.8

Rationale for co-creation with GPs

This deprescribing pilot study, as a quality prescribing initiative, aimed to effect change at the microsystem level (ie, the provider–patient interaction). Relevant stakeholders for co-design could have included patients (and family or carers if relevant), GPs, medical specialists, hospital providers, community pharmacists and other members of the primary health care team.

There were several reasons for prioritising GPs for co-design in this pilot. Recent literature exploring patients’ perspectives on deprescribing indicated that their GPs can be highly influential in encouraging patients to cease taking inappropriate medicines,9 confirming that GPs exert considerable influence on what is discussed during consultation time with patients.10 Deprescribing is a highly nuanced, individualised process that requires comprehensive, holistic review and follow-up of a patient. Accordingly, the GPs’ often long term and trusted relationship with, and tacit knowledge of, their patients place them in an ideal position to engage patients in the deprescribing process and participate in decisions about the continuation or discontinuation of long term therapy.11 Giving due consideration to the organisational structure and operation of primary care, and the asymmetry of medical knowledge between patients and GPs, the GP was considered to be best positioned to raise the issue of deprescribing, and collaborate with patients and other highly influential stakeholders such as specialists and health professionals, to facilitate the process as appropriate. We were also aware of research identifying patient attitudes and barriers to deprescribing initiatives, which we used to inform our study design.9,12 For all these reasons, we decided to pursue co-design with GPs in the first instance. Although co-design would not be undertaken with the patients at the front end, the pilot evaluation would include interviews with both patients and GPs aimed at ascertaining the impact and acceptability of the deprescribing process.

The challenge and reward of research co-creation in primary care

GPs are a busy and heterogeneous group of health professionals, whose practice settings vary markedly in terms of administrative and clinical support, resourcing and infrastructure, capacity and readiness for change.13 Engagement of GPs in co-creation research must occur at times and places that are optimally convenient for them, and must recognise the immense variability among GPs and their work contexts. The following describes examples of how GPs were involved in the planning, implementation and evaluation of the project in ways that recognise their busyness and diversity.

Planning

A collective approach to co-creating new systems or services is often preceded by information gathering and conceptual ideas.1 We undertook a systematic review of the literature of prescribers’ barriers and enablers to minimising the use of potentially inappropriate medications and used its findings to inform the first stage of co-creation.14 We also undertook focus group discussions with GPs from five large practices in the designated pilot study catchment area with two objectives: (i) to identify local barriers and enablers to deprescribing, as local context is highly influential in shaping clinician behaviour,8 and compare these with the findings of the review; and (ii) to determine the perceived applicability and utility of a purposively designed deprescribing framework in routine care, modified from one shown to be an effective tool for deprescribing in hospitals.15

The findings of the focus group discussions and the literature review together with liaison with a senior academic GP adviser experienced in the care of older multimorbid patients, were critical in understanding the context in which the intervention would be applied and consequently, in formulating its key components, including:

  • conducting an interactive training workshop for GPs on deprescribing, based on the deprescribing framework;

  • identifying patients at high risk of medication misadventure;

  • scheduling extended deprescribing appointments with GPs for their high risk patients (with follow-up and referral at the GP’s discretion); and

  • providing the option of referring patients to an accredited pharmacist trained in deprescribing to review a patient’s medicines to help GPs overcome some of their barriers to deprescribing, such as limited time.

GPs, with their patients, would be free to collaborate with or involve other health professionals throughout the deprescribing process, in recognition of the heterogeneity of GP work environments, care teams and with respect for the GPs’ professional autonomy.

Implementation

The next step was working with GPs recruited into the pilot study to co-design practical tools that would help meet study objectives.1 The following describes two examples, wherein a flexible, iterative research design was used that could respond to the needs of different general practices.

Example 1: Identifying patients at high risk of medication misadventure

The research team worked closely with the principals (or their delegates) of the practices recruited to the pilot to develop a standardised but customisable patient management software query that would help identify patients at high risk according to evidence-based criteria. This involved the use of the same medical software (Best Practice Software) at all but one site. A comparable query was performed using an external reporting software tool at the site that used different software. To account for variations in data quality across the sites, the software query was combined with a documented manual screening process so that each GP could generate a sample of consecutive eligible patients for study recruitment. The co-design of the software query minimised the extent of manual screening required by GPs and practice staff, but maintained a degree of standardisation of non-negotiable search criteria important to the research team across all of the sites.

Example 2: Co-designing a multipurpose tool for use during the deprescribing appointment

Focus group discussions with GPs emphasised that any tool for deprescribing should ideally be integrated into the medical software used in general practice. The research team aimed to minimise the burden of documentation for GPs as part of the project.

A tool or template, easily imported into the electronic consult notes, was developed and served three functions: collecting data for the research team; acting as a memory prompt for the GPs of the key steps of deprescribing; and providing a framework for documenting the deprescribing consultation. The draft tool was designed by the team, with the aid of a practising GP with research and software experience, after considering GPs’ work processes and the required sequential steps of the deprescribing framework.

This template (Box 2) was subsequently trialled in the medical software used by participating GPs who attended the preparatory deprescribing workshop. This resulted in additional decision support being added to the tool on the basis of suggestions made by GPs. All participants recognised that having a multipurpose tool integrated into the medical software increased the chance of it being used in routine care and capturing all information critical to project evaluation.

Evaluation

The future evaluation of the deprescribing project will involve a mixed-methods approach. The primary outcome measure is a change in the total number of regular medications taken by older people at high risk of medication misadventure. Secondary measures will include change in the number of medications taken as needed (prn), the number of medications to have doses changed, drug classes commonly deprescribed and process measures such as the proportion of patients attending their deprescribing appointment. A formal process for ascertaining and recording any instance of actual or potential patient harm arising from deprescribing has been implemented. Changes in patient attitudes towards deprescribing and quality of life will be assessed by pre- and post-questionnaire surveys. Interviews with GPs and patients will explore the acceptability and impact of the deprescribing process. The results of this pilot study will help determine if there is sufficient justification for seeking funding for a larger-scale trial that evaluates the deprescribing intervention used, or an amended version of it, across a wider spectrum of general practice settings.

Conclusion

Utilising a co-creation approach in research is both challenging and rewarding. The exact approach that is taken needs to be tailored according to the study purpose, views of key participants and context of change. The level of engagement between researchers and end users will vary at different stages of planning and implementation to ensure maximum value for both parties.

Box 1 –
Abridged deprescribing algorithm5,6

  • Ascertain all medicines that the patient is taking and the reasons for using each one.
  • Consider the overall risk of medicine-induced harm in the individual patient, determining the required intensity of the deprescribing intervention.
  • Assess each medicine for its eligibility to be discontinued, and deprescribe medicines:
    • without a clear or valid indication;
    • that are part of a prescribing cascade;
    • where the actual or potential harms clearly outweigh any benefits;
    • for symptom control if they are ineffective or if symptoms have resolved;
    • that are preventive in nature, and that are unlikely to confer any important benefit in a patient’s remaining life span; and
    • that are imposing an unacceptable treatment burden.
  • Establish an order of priority for discontinuing medicines.
  • Implement and monitor the medication discontinuation regimen.

Adapted from Scott and colleagues.5

Box 2 –
Template for use by GPs in deprescribing consultations*

Patient attended for appointment as part of University of Queensland study.

Medication history taken and list reconciled? Y or N? If no, why?

Each medication reviewed for utility? Y or N? If no, why?

Medications eligible for deprescribing —

  • Medication, coded reason for ceasing or restarting (see below), GP recommended plan, plan after discussion with patient

This step is repeated for as many medications as deemed appropriate.

Next appointment to be scheduled <insert date>


  • Coded reasons for CEASING medications (free text in consult notes OR select from drop down list) —

    1. No clear or valid indication (including contraindication)
    2. Prescribing cascade
    3. Actual or potential harms > benefits
    4. Symptom control
      • Ineffective
      • Symptoms resolved
    5. Time until benefit questionable
    6. Unacceptable treatment burden
    7. Patient stopped it
  • Coded reasons for RESTARTING medications previously deprescribed (free text in consult notes)

    1. Restart — Symptom relapse
    2. Restart — Withdrawal syndrome

* A letter template for completion and forwarding to lead researcher in regard to any adverse events thought probably or possibly related to deprescribing was also implemented.

The Partners in Recovery program: mental health commissioning using value co-creation

The Australian Government’s Partners in Recovery (PIR) program1 established a new form of mental health intervention aimed to better support people with severe and persistent mental illness with complex needs, and their carers and families. It aims to achieve this by getting multiple sectors, services and consumers to work in a more collaborative, coordinated and integrated way.1 Commissioning these services required an approach that engaged many stakeholders to generate a model that was widely supported and understood. Value co-creation offers a framework to describe this style of commissioning and has been applied to mental health commissioning internationally.26

Co-creation entails a new vision of value creation through a shift in thinking about the co-creators of value, the value networks, and the entire value of ecosystems.7,8 It involves redefining the way an organisation engages with individuals, partners and stakeholders by bringing them into a process of value creation and engaging them in enriched experiences throughout the journey, in order to design new products and services, transform management systems, and increase innovation, productivity and returns on investment.711 Co-creation requires focus and sustained efforts in making choices of where and how to co-create value with stakeholders and end users.9,10 Elsewhere in this Supplement, Janamian and colleagues12 describe value co-creation approaches and strategies to achieve value co-creation in primary care services research.

The aim of this article is to illustrate how the Brisbane North Primary Health Network (PHN) applied value co-creation approaches to the PIR program to co-design a solution with the partners and end users. Here, we focus on the co-creation processes; formal evaluation outcome data will be provided in detail elsewhere in future reports and publications. Only through the direct engagement and co-creation with stakeholders could the government’s program guidelines be translated into a real service that functioned effectively. The PIR program was established in two phases. Phase one is the collaborative work undertaken in the development of the funding submission in 2012–13; and phase two is program delivery from 1 July 2013 to the present.

Mental health commissioning in Brisbane North

Identifying and engaging stakeholders

Stakeholders encompassed not just providers of specialist mental health services, but also primary health care providers, emergency services, social services and consumers of these services and their families/carers. Involvement of stakeholders across multiple sectors and organisations produced new capacities and widened the scope and scale of interactions and experiences. This expansion of value creation in a “win more, win more” fashion leads to more transformational results as the scope of application expands — meaning that more and more people gain some impact or benefit from the co-created processes and outcomes.79 Brisbane North PHN (the PHN) engaged more than 100 organisations in the development phase, either by direct invitation or by public advertisement. The service model was developed through a series of three workshops in the last half of 2012. An additional workshop exclusively for consumers of mental health services and their families/carers identified the key outcomes that the model should deliver. A meeting of Aboriginal and Torres Strait Islander agencies was also convened.

During this phase, stakeholders reported satisfaction with the open and participative process, and they strongly embraced the opportunity to feed into development of the model. The outcomes of each workshop were documented and fed back to all participants, in an iterative process that co-created the service model. Champions for the PIR program and the PHN model emerged from these workshops and, through the process, 22 organisations expressed interest in forming a working collaborative. The PHN ultimately selected seven mental health specialist providers, the local hospital network (Metro North Hospital and Health Service), the Queensland Alliance for Mental Health (the state’s peak body for community mental health), and consumer and carer representatives to form the Consortium Management Committee (CMC). While the service model was co-created with all stakeholders’ participation, the budget was finalised by the CMC.

Co-creation experiences and platforms of engagement

A range of engagement platforms were established in 2013, each providing stakeholders opportunities for new co-creation experiences and outcomes of value.79 A key premise of co-creation is that by sharing experiences, the individuals involved will gain a greater understanding of what is happening on the other side of every interaction, enabling them to devise a new, better experience for both sides.10 Agency chief executive officers and senior managers meet with consumer and carer representatives as the CMC every 6 weeks. Service managers within agencies also meet 6-weekly and direct delivery staff meet in learning sets every month. A client information management software platform is used by all agencies, providing staff across eight separate agencies direct access to client information. An analysis tool enables real-time interrogation of both outcome and process data, and program-wide reports. This has facilitated the ongoing co-creation of quality improvements and the potential for integration with clinical data from primary care or public mental health services.

PIR regularly produces short videos, circulated on YouTube and other social media platforms, which update stakeholders on progress and showcase new initiatives. Information is available in a widely distributed electronic quarterly newsletter and through an interactive website (http://www.northbrisbane.pirinitiative.com.au). A separate website has been co-created by public and private health providers as a system navigation tool updated directly by providers (http://www.mymentalhealth.org.au). Additionally, an annual forum brings together the wide and diverse range of stakeholders initially involved in the program’s development phase. This provides both accountability for those delivering, and opportunities for prioritisation of new initiatives.

Importance of stakeholder value co-creation

Co-creation expands value creation for stakeholders in various ways: value as enacted through co-creative interactions; value as exemplified experiences; and value as emerging from diverse collaborations across multiple sectors and building on stakeholder’s existing capabilities.7 The PHN had limited expertise in working with people with severe mental illness, and an effective service model could not have been created without the genuine engagement of key stakeholders — community agencies, primary health care providers, public mental health services, consumers and carers. Through equal partnership, mutual relationships and sharing of the decision-making power, value was co-created jointly and reciprocally by all stakeholding individuals. A key value of the program was system improvement and, without contribution from the broad range of players operating in the local system, this goal would not have been achieved. In essence, the co-creation development process was part of achieving the co-created outcome.

During the delivery phase, PIR was managed by the CMC. The PHN adopted principles of collective impact13 and positioned itself as simply one member agency with the “backbone” responsibility for managing the formal partnerships, performance data and reporting accountabilities. PHN staff focused on creating a CMC environment that was high in trust where the PHN operated as a facilitator rather than a funder.

The high levels of trust and cooperation among members was evidenced in their response to performance data. For example, the data showed 3% of PIR clients in the region were of Aboriginal and Torres Strait Islander background, which was in line with overall population prevalence. However, given the over-representation of Aboriginal and Torres Strait Islander people in the target population, it was clear that PIR was not sufficiently accessible. Following discussion, the CMC agreed that an Aboriginal and Torres Strait Islander provider organisation needed to join the collaborative. The seven provider agencies agreed to give up a portion of their existing contracted funding and pool these resources to enable the PHN to formally partner with the Institute for Urban Indigenous Health, and for this agency to join the CMC. Subsequently, the proportion of Indigenous PIR clients increased. In this way, members of the CMC demonstrated that they were committed to making changes based on performance data, in an environment high in trust.

Co-creation partnership motivations

Dialogue, access, risk–benefits and transparency form the building blocks of value co-creation and require diligent application.14 The collective management of the program included data sharing and client consent across all agencies. This meant that providers could view client notes from other agencies, and all agencies could access client outcome data. As a result, in addition to the CMC meetings that were attended predominantly by executives, service managers from all agencies met to discuss differences in performance and approach. This has resulted in much stronger connections between agencies at multiple levels, and increased quality of service provision. The delivery system is more self-monitoring, with a convergence of practice, meaning consumers, referrers and other providers have a consistent experience of the program.

Stakeholder value co-creation opportunities

A deeper collaboration with stakeholders across multiple sectors increases the pool of resources, competencies and capabilities, accelerating value creation opportunities for all.79 Agencies collaborated on system improvement activities across a range of projects. Work on the primary–secondary health care interface was undertaken with public, private and community providers working together to create practical solutions in order to smooth the patient journey across these boundaries. More inter-sectoral work has occurred, and an advisory group including disability services, police and emergency services, and housing and homelessness agencies, was formed to better integrate responses. The CMC oversaw a program to incentivise innovative and collaborative activities, which resulted in work with community pharmacies, education of employers through the Queensland Chamber of Commerce and Industry and the production of new stepped-care models of housing and support. While some of this work has involved new initiatives, much is focused on changing existing interventions and referral practices as understanding and awareness of consumers’ needs increased.

Reported benefits of value co-creation

To evaluate the impact of the program, we recruited and trained a team of consumer evaluators who collectively designed the client data collection tool, approached clients directly (and not through their service provider) for interviews, facilitated qualitative workshops, and analysed the data collected.

Although formal results will be reported in future reports, to give a glimpse of the possible impact of the co-creation, early reports include that about 90% of the more than 1500 clients in the program reported experiencing a reduction in unmet need, and about 85% no longer reported problems with connecting to relevant services. Approximately four in ten clients had previously had no contact with the public mental health system and around one in ten PIR clients were of Aboriginal or Torres Strait Islander background. In parallel, our survey of providers found that PIR was thought by some to have contributed to improved coordination between clinical and community mental health providers.

The development of environments which are high in trust also has significant efficiency outcomes. Co-creation and collaborative management means organisations deliver according to their strengths while ensuring program consistency from a consumer perspective. Agencies were also prepared and willing to give up resources to alternative approaches if the evidence demonstrated their value.

Challenges using value co-creation

The value co-creation approach requires a significant commitment of time — not just by PHN staff but also many staff in CMC member agencies, consumers and broader stakeholders. At least initially, it would appear that simply delivering a program independently within an agency is less time-intensive. Formal evaluations are yet to be completed and reported; however, our experiences over 3 years of delivery suggest that investment in strong connections at multiple levels and through many organisations produces better quality for the client and ultimately saves time through a more integrated and collectively planned approach.

The major challenge is giving up long-held models of care that may work for individual agencies but are not effective from a systems perspective. This remains a work in progress, particularly for agencies that are large and complex and for professions that have been delivering care in a particular way for many decades.

Conclusion

The challenges of consistently delivering a program by working through eight separate agencies are considerable. The style and approach of the PHN as backbone to this initiative has a significant impact on the processes and outcomes. The use of value co-creation and collective impact has produced better outcomes for mental health consumers and their families, and has ensured that resources have been applied efficiently to create lasting system improvements.