×

Government policy ambitions trimmed

Health Minister Sussan Ley is talking up the Health Care Homes trial and the MBS review as the Coalition Government recalibrates its policy ambitions following its scarifying Federal election experience.

Trying to prevent her term in office being defined by the widely disliked Medicare rebate freeze, Ms Ley insisted in an interview on ABC radio that her policy program was much broader and encompassed a range of measures to improve the delivery of health care including the modernisation of the Medicare Benefits Schedule, the Health Care Homes model of chronic care, the introduction of an opt-out national e-health record system and mental health reforms.

“That is just for starters,” she said. “We are embracing brave, forward-looking reform.”

But with Prime Minister Malcolm Turnbull virtually declaring Medicare off-limits during the election campaign and Treasurer Scott Morrison demanding that any new expenditure items must be fully offset by savings elsewhere, the Minister is yet to identify any new policy initiatives since being re-elected.

Instead, she has so far had to spend much of her time defending her performance during the election campaign and the Medicare rebate freeze, and re-defining the Government’s approach to upgrading Medicare’s software and payments systems.

“We have made very strong undertakings that the Medicare system will be modernised within Government and by Government, and I am looking forward to that because the existing system is about 30 years old and it is creaking a little and work needs to be done,” Ms Ley said.

Seeking to move the discussion of health policy beyond a focus on the Medicare rebate freeze and bulk billing, the Minister said, “I am not just focussing on one thing. There is so much more we are doing in health that is just not related to that.”

“A lot of things we are doing around hospital payments, around modernising the MBS, around the Health Care Home initiative…all of these things are all part of the discussion.”

While the Medicare rebate has stagnated since 2014, Ms Ley said the Government’s Health Care Home initiative would give GPs access to a new stream of revenue by providing “a different way of paying for quality health outcomes”.

But the Government could face problems trying to have parts of its policy agenda supported in Parliament.

The deal struck by Ms Ley with pathology and diagnostic imaging providers over the scrapping of the bulk billing incentive for their services has yet to be approved by Parliament, and was opposed by Labor during the election.

The Government is also facing opposition from some of the minor parties over its funding cuts to aged care.

Adrian Rollins

Pharmacists: shopkeepers or health professionals?

Pharmacists could face restrictions on the amount of shelf space they devote to selling vitamins, shampoo, toothpaste and other retail products as their dual role as health care professionals and shopkeepers comes under scrutiny in a Federal Government review.

The Government’s Review of Pharmacy Remuneration and Regulation is looking into whether there should be limits imposed on the retail activities of community pharmacies amid accusations that pharmacists are misleading consumers and undermining their own professional integrity by selling vitamins, herbal remedies and other complementary medicines that have no proven health benefit.

While dispensing prescriptions is the principle source of pharmacy earnings, generating 61.5 per cent of income in 2015-16, sales of cold and flu remedies, cough syrup and other non-prescription medicines contributed 16 per cent of revenue, purchases of vitamins, herbal remedies and other complementary medicines provided 15.5 per cent of earnings and sales of cosmetics and beauty products generated 7 per cent of income.

The review panel, led by Professor Stephen King, has been told that community pharmacists face a conflict of interest between their role as a health care professional and a shopkeeper, particularly when stocking their shelves with products for which there is no evidence of efficacy.

As community pharmacists push for an expanded role as health service providers, they are coming under scrutiny over their business practices, particularly regarding the sale of complementary medicines.

The issue is probed in a discussion paper released as part of the review, which has been set up to examine the role of pharmacists and community pharmacy in delivering health services, now and in the future.

The review panel said it had heard of numerous examples where community pharmacists had gone “above and beyond in providing additional services that are in the patient’s best interest, even though they may not be compensated for these valuable services”.

But, it added, there were those who objected to the current direction in which community pharmacy was headed, and were concerned that issues around their dual roles as a retailer and health service provider were yet to be resolved.

“It was put to the Panel that community pharmacists face conflicts of interest between their role as retailers and as health care professionals,” the discussion paper said. “This tension between treating consumers as customers or patients was attributed to the contrast in the remuneration from dispensing and the revenue generated from the sale of over-the-counter medicines and complementary products.”

The Panel said it had heard concerns that financial pressures might cause pharmacists to compromise on the professional advice they provide, such as recommending medicines or products that were not necessary.

“It was also claimed that many complementary products do not have evidence-based health benefits and, as such, the sale of these products in a pharmacy setting may misinform consumers of their effectiveness and undermine the professional integrity of community pharmacists.”

The review has been set up under the terms of the current Community Pharmacy Agreement, and the panel is seeking comment on possible reforms in the sector, including changes to the pharmacy business model.

The discussion paper cited Guild Digest data showing that community pharmacies have an average annual turnover of $2.8 million, and a net profit of $107,000 (excluding proprietor salaries).

Among the proposals up for consideration is that Government funding, which is worth $13.2 billion under the life of the current five-year agreement, should be made conditional on the amount of revenue pharmacists generate from other sales.

“Should Government funding take into account the business model of the pharmacy when determining remuneration, recognising that some businesses receive significant revenue from retail activities?” is one of the question raised in the discussion paper.

“Should there be limitations on some of the retail products that community pharmacies are allowed to sell? For instance, is it confusing for patients if non-evidence-based therapies are sold alongside prescription medicines?”

It noted that some hospital pharmacies have designed their service area to resemble a clinic, getting rid of a counter and “providing a private environment without distraction, which maximises the professionalism of patient-pharmacist interaction”.

The review is being undertaken in the context of a sustained push by pharmacists for an expanded role as health providers.

Health Minister Sussan Ley said pharmacists were already taking on a greater role, including providing routine vaccinations and blood pressure checks, and the industry is pushing to be allowed to undertake broader screening and patient health checks.

The AMA has raised concerns about the risk to patients from pharmacists providing services beyond their realm of expertise, and is expected to make a submission to the review.

The Pharmacy Guild said the discussion paper raised many “thought-provoking questions” about the pharmacy sector and was preparing a formal response.

The review panel will conduct a series of public forums over the next five weeks, and those interested have until 23 September to provide a written submission.

Details of the review, including the discussion paper and the consultation process, are at: http://www.health.gov.au/internet/main/publishing.nsf/Content/review-pharmacy-remuneration-regulation

Adrian Rollins

National Heart Foundation of Australia and Cardiac Society of Australia and New Zealand: Australian clinical guidelines for the management of acute coronary syndromes 2016

These clinical guidelines have been developed to assist in managing patients presenting with chest pain suspected to be caused by an acute coronary syndrome (ACS) and those with confirmed ACS. The development of these guidelines has been informed by reviews of the literature dealing with key aspects of chest pain assessment and ACS care, as well as broad consultation with local opinion leaders, stakeholder groups and the public. The recommendations focus on the core clinical and system-based components of care most associated with improved clinical outcomes. As such, these guidelines should be read in conjunction with the Acute coronary syndromes clinical care standard, developed by the Australian Commission on Safety and Quality in Health Care,1 and the Australian acute coronary syndromes capability framework, developed by the National Heart Foundation of Australia (NHFA).2 Guidance regarding both the strength of evidence supporting the recommendations and their potential impact on outcomes is provided to assist in informing clinical practice.3,4 Additional guidance regarding the timing and considerations informing the use of therapies and management strategies is given in the accompanying practice advice. A full version of the NHFA and Cardiac Society of Australia and New Zealand (CSANZ) Australian clinical guidelines for the management of acute coronary syndromes 2016 is available at: http://heartfoundation.org.au/for-professionals/clinical-information/acute-coronary-syndromes.

Methods

The NHFA, in partnership with the CSANZ, has undertaken an update to the NHFA/CSANZ Guidelines for the management of acute coronary syndromes 2006 and addenda of 2007 and 2011.57 The updated guideline will provide a synthesis of current evidence-based guidance for health professionals caring for patients with ACS.

The ACS Guideline Development Working Group comprised an Executive and the four writing groups of which it had oversight, covering the topics of chest pain, ST segment elevation myocardial infarction (STEMI), non-ST segment elevation ACS (NSTEACS) and secondary prevention. In addition, a Reference Group included representatives from stakeholder groups, potential endorsing organisations and regional experts. The Working Group comprised a broad mix of health professionals, including a general practitioner, general physician, cardiac surgeon, consumer representative, pathologist, ambulance service representative, cardiologists, emergency physicians, exercise physiologists and cardiac nurses.

The Working Group consulted state-based cardiac clinical networks and the Reference Group on the scope determination for the updated guideline. Based on this consultation, the expert Working Group generated clinical questions to inform the literature search of evidence required for the guideline’s development. The separate writing groups reviewed and graded the evidence, generated and graded recommendations, and produced draft sections for the four topic areas. The Executive group provided oversight for this process and approved the final document.

A draft of the guideline was open for a 30-day period of public consultation in April 2016 to capture stakeholder views and aid engagement with the guideline once completed. Attention has been paid to ensuring appropriate governance processes were in place, to ensure transparency, minimise bias, manage conflict of interest and limit other influences during guideline development.

Key evidence-based recommendations

Each recommendation is presented with a Grading of Recommendations Assessment, Development and Evaluation (GRADE) strength of recommendation (Appendix 1) and a National Health and Medical Research Council level of evidence (Level) (Appendix 2). Practice points (PPs) are also provided.

Assessment of possible cardiac causes of chest pain

  • It is recommended that a patient with acute chest pain or other symptoms suggestive of an ACS receives a 12-lead electrocardiogram (ECG), and this ECG is assessed for signs of myocardial ischaemia by an ECG-experienced clinician within 10 minutes of first acute clinical contact.8 GRADE: Strong; Level: IIIC

    • PP: Oxygen supplementation. The routine use of oxygen therapy among patients with a blood oxygen saturation (SaO2) level > 93% is not recommended, but its use when the SaO2 is below this level is advocated, despite the absence of clinical data.9,10 However, care should be exercised in patients with chronic obstructive pulmonary disease where the target SaO2 level is to be 88–92%.

    • PP: Initial aspirin therapy. In all patients with possible ACS and without contraindications, aspirin (300 mg orally, dissolved or chewed) should be given as soon as possible after presentation. Additional antiplatelet and anticoagulation therapy, or other therapies such as β-blockers, should not be given to patients without a confirmed or probable diagnosis of ACS.

  • A patient presenting with acute chest pain or other symptoms suggestive of an ACS should receive care guided by an evidence-based Suspected ACS Assessment Protocol (Suspected ACS-AP) that includes formal risk stratification.11 GRADE: Strong; Level: IA

    • PP: Selecting and implementing a Suspected ACS-AP. For hospitals using sensitive or highly sensitive troponin assays, the ADAPT or modified ADAPT protocol, respectively, identifies low risk patients (< 1% major adverse cardiac events [MACE] at 30 days) on the basis of negative troponin test results at both 0 and 2 hours, a Thrombolysis in Myocardial Infarction (TIMI) risk score of 0 (ADAPT) or 0 or 1 (modified ADAPT), and no ischaemic changes on ECG at both 0 and 2 hours.12,13

  • Using serial sampling, cardiac-specific troponin levels should be measured at hospital presentation and at clearly defined periods after presentation using a validated Suspected ACS-AP in patients with symptoms of possible ACS.14 GRADE: Strong; Level: IA

    • PP: Timing of troponin testing. Most patients with an underlying diagnosis of acute myocardial infarction (AMI) have elevated troponin levels within 3–6 hours of symptom onset, although some assays may not show elevated levels for up to 12 hours (Box 1). Validated rapid rule-in and rule-out algorithms for AMI incorporated into Suspected ACS-APs and/or using highly sensitive troponin assays may reduce the serial testing time to 1–2 hours after presentation.18,19,21,24,25 Incorporating sensitive or highly sensitive troponin assay results into the ADAPT or modified ADAPT protocol, respectively, allows early (2 hours after emergency department presentation) risk stratification.12,13

  • Non-invasive objective testing is recommended in intermediate risk patients, as defined by a validated Suspected ACS-AP, with normal serial troponin and ECG testing and who remain symptom free.26 GRADE: Weak; Level: IA

    • PP: Timing of testing. High risk patients require further objective testing during the index admission (Box 2). Intermediate risk patients may be safely accelerated for early inpatient testing or discharged for outpatient testing, ideally within 7 days but acceptable up to 14 days after presentation. Investigation before discharge from the emergency department is desirable among patients with characteristics associated with significant failure to re-attend for medical review, given the higher rates of MACE in such patients.27

  • Patients in whom no further objective testing for coronary artery disease is recommended are those at low risk, as defined by a validated Suspected ACS-AP: age < 40 years, symptoms atypical for angina, in the absence of known coronary artery disease, with normal troponin and ECG testing and who remain symptom free.26 GRADE: Weak; Level: III-3C

Diagnostic issues, risk stratification and acute management of ACS

  • The routine use of validated risk stratification tools for ischaemic and bleeding events (eg, GRACE score for ischaemic risk and CRUSADE score for bleeding risk) may assist in patient-centric clinical decision making in regards to ACS care.2830 GRADE: Weak; Level: IIIB

    • PP: Choice of risk score. For ischaemic risk, the GRACE risk score is superior to the TIMI risk score in terms of discriminating between high risk and intermediate or low risk patients.28 However, estimating risk of death or recurrent myocardial infarction (MI) for an individual patient depends on local validation. For bleeding risk, the CRUSADE risk score is preferred, although it has limited validation in the Australian setting.31

Acute reperfusion and invasive management strategies for ACS

  • For patients with STEMI presenting within 12 hours of symptom onset, and in the absence of advanced age, frailty and comorbidities that influence the individual’s overall survival, emergency reperfusion therapy with either primary percutaneous coronary intervention (PCI) or fibrinolytic therapy is recommended.32,33 GRADE: Strong; Level: IA

    • PP: ECG interpretation. In situations where expertise in ECG interpretation may not be available, an electronic algorithm for ECG interpretation (coupled with review by an expert) can assist in diagnosing STEMI. Local or state care pathways should incorporate means for allowing expert ECG reading within 10 minutes of first contact, integrated with clinical decision making to enable timely reperfusion.

  • Primary PCI is preferred for reperfusion therapy in patients with STEMI if it can be performed within 90 minutes of first medical contact; otherwise, fibrinolytic therapy is preferred for those without contraindications.3436 GRADE: Strong; Level: IA

    • PP: Strategies for reducing the time to reperfusion therapy. Coordinated protocols with planned decision making that incorporates ambulance services and paramedics, first-responder primary care physicians, and emergency and cardiology departments are critical for achieving acceptable reperfusion times. Strategies need to be tailored to the local community and the distribution of emergency services. Strategies that effectively shorten the time to reperfusion include: developing hospital networks with pre-determined management pathways for reperfusion; pre-hospital ECG and single call catheter laboratory activation; pre-hospital fibrinolytic therapy administered by suitably trained clinicians (eg, paramedics); the bypassing, where appropriate, of non-PCI-capable hospitals; and bypassing the emergency department on arrival in PCI-capable centres. Furthermore, an established capability for timely expert consultation for complex clinical scenarios is highly desirable. In the context of a system-based approach to reperfusion, the capacity for continuous audit and feedback is also advocated.

  • Among patients treated with fibrinolytic therapy who are not in a PCI-capable hospital, early or immediate transfer to a PCI-capable hospital for angiography, and PCI if indicated, within 24 hours is recommended.37 GRADE: Weak; Level: IIA

  • Among patients treated with fibrinolytic therapy, for those with ≤ 50% ST recovery at 60–90 minutes and/or with haemodynamic instability, immediate transfer for angiography with a view to rescue angioplasty is recommended.38 GRADE: Strong; Level: IB

    • PP: Hospital networks. Systems of care should be developed to provide advice and enable, when appropriate, immediate or early transfer for angiography of patients treated with fibrinolytic therapy who are not in a PCI-capable hospital.

  • Among high and very high risk patients with NSTEACS (except type 2 MI [secondary to ischaemia due to either increased oxygen demand or decreased supply]), a strategy of angiography with coronary revascularisation (PCI or coronary artery bypass grafting [CABG]), where appropriate, is recommended.39 GRADE: Strong; Level: IA

    • PP: Mode of revascularisation. Patient comorbidities, fitness for major surgery and coronary anatomy are the main determinants. Urgent revascularisation with CABG may be indicated for patients with failed PCI, cardiogenic shock or mechanical defects resulting from MI (eg, septal, papillary muscle or free-wall rupture). A combined Heart Team approach may provide the best consensus decision about the care of an individual patient.

    • PP: Invasive management for type 2 MI. Type 2 MI remains a challenging diagnosis, and no trials have examined the benefits of a routine invasive strategy in patients with type 2 MI. In the absence of any trial evidence, angiography with a view to revascularisation may be considered if there is ongoing ischaemia or haemodynamic compromise despite adequate treatment of the underlying acute medical problem that provoked the type 2 MI.

  • Patients with NSTEACS who have no recurrent symptoms and no risk criteria are considered at low risk of ischaemic events and can be managed with a selective invasive strategy guided by provocative testing for inducible ischaemia.39 GRADE: Strong; Level: IA

  • Very high risk patients: Among patients with NSTEACS with very high risk criteria (ongoing ischaemia, haemodynamic compromise, arrhythmias, mechanical complications of MI, acute heart failure, recurrent dynamic or widespread ST segment and/or T wave changes on ECG; Box 3), an immediate invasive strategy is recommended (ie, within 2 hours of admission).40 GRADE: Strong; Level: IIC

  • High risk patients: In the absence of very high risk criteria, for patients with NSTEACS with high risk criteria (GRACE score > 140, dynamic ST segment and/or T wave changes on ECG or rise and/or fall in troponin compatible with MI; Box 3), an early invasive strategy is recommended (ie, within 24 hours of admission).40 GRADE: Weak; Level: IC

  • Intermediate risk patients: In the absence of high risk criteria, for patients with NSTEACS with intermediate risk criteria (such as recurrent symptoms or substantial inducible ischaemia on provocative testing; Box 3), an invasive strategy is recommended (ie, within 72 hours of admission).4042 GRADE: Weak; Level: IIC

Pharmacology for ACS

  • Aspirin 300 mg orally (dissolved or chewed) initially, followed by 100–150 mg/day, is recommended for all patients with ACS, in the absence of hypersensitivity.43 GRADE: Strong; Level: IA

  • Among patients with confirmed ACS at intermediate to very high risk of recurrent ischaemic events, use of a P2Y12 inhibitor (ticagrelor 180 mg orally, then 90 mg twice a day; or prasugrel 60 mg orally, then 10 mg daily; or clopidogrel 300–600 mg orally, then 75 mg daily) is recommended in addition to aspirin (ticagrelor or prasugrel preferred; see below).4447 GRADE: Strong; Level: IA

    • PP: Choosing between P2Y12 inhibitors. Given their superior efficacy, ticagrelor and prasugrel are the preferred first-line P2Y12 inhibitors. Use of ticagrelor is advised for a broad spectrum of patients with STEMI or NSTEACS who are at intermediate to high risk of an ischaemic event, in the absence of atrioventricular conduction disorders (second and third degree atrioventricular block) and asthma or chronic obstructive pulmonary disease. Prasugrel may be considered for patients who have not received a P2Y12 antagonist and in whom PCI is planned, but it should not be used for patients > 75 years of age, of low bodyweight (< 60 kg) or with a history of transient ischaemic attack or stroke. Use of either prasugrel or ticagrelor, rather than clopidogrel, is also recommended for patients who have experienced recurrent events while taking clopidogrel or who have experienced stent thrombosis. Clopidogrel is recommended for patients who cannot receive ticagrelor or prasugrel, as an adjunctive agent with fibrinolytic therapy or for those requiring oral anticoagulation (refer to relevant prescribing information documentation). Ticagrelor or clopidogrel should be commenced soon after diagnosis, but due consideration should be given to ischaemic and bleeding risks, the likelihood of need for CABG (more likely in patients with extensive ECG changes, ongoing ischaemia or haemodynamic instability) and the delay to angiography. Prasugrel should be commenced immediately after diagnosis among patients undergoing primary PCI for STEMI, or after the coronary anatomy is known among those undergoing urgent PCI. Initiation of prasugrel before coronary angiography outside the context of primary PCI is not recommended.

    • PP: Combination of P2Y12 inhibition with long term anticoagulation. Among patients with an indication for oral anticoagulation, a careful assessment of thrombotic and bleeding risks is required, using CHA2DS2-VASc and HAS-BLED scores, respectively. The following advice is based on consensus opinion. In patients with a strong indication for long term anticoagulation (ie, mechanical heart valves, atrial fibrillation with CHA2DS2-VASc score ≥ 2), the anticoagulant should be continued at a reduced dose, and clopidogrel, rather than ticagrelor or prasugrel, should be used for these patients. The duration of triple therapy (ie, aspirin, clopidogrel and oral anticoagulation) should be determined by the bleeding risk.

  • Intravenous glycoprotein IIb/IIIa inhibition in combination with heparin is recommended at the time of PCI among patients with high risk clinical and angiographic characteristics or for treating thrombotic complications among patients with ACS.48 GRADE: Strong; Level: IB

  • Either unfractionated heparin or enoxaparin is recommended in patients with ACS at intermediate to high risk of ischaemic events.49,50 GRADE: Strong; Level: IA

    • PP: Choosing between indirect thrombin inhibitors. Enoxaparin may be preferred over unfractionated heparin as it does not require monitoring of partial thromboplastin time and is simpler to administer. Swapping between enoxaparin and unfractionated heparin has been shown to increase bleeding risk and is not recommended.

  • Bivalirudin (0.75 mg/kg intravenously with 1.75 mg/kg/h infusion) may be considered as an alternative to glycoprotein IIb/IIIa inhibition and heparin among patients with ACS undergoing PCI with clinical features associated with an increased risk of bleeding events.51 GRADE: Weak; Level: IIB

Discharge management and secondary prevention

  • Aspirin (100–150 mg/day) should be continued indefinitely unless it is not tolerated or an indication for anticoagulation becomes apparent.43 GRADE: Strong; Level: IA

  • Clopidogrel should be prescribed if aspirin is contraindicated or not tolerated. GRADE: Strong; Level: IA

  • Dual antiplatelet therapy with aspirin and a P2Y12 inhibitor (clopidogrel or ticagrelor) should be prescribed for up to 12 months in patients with ACS, regardless of whether coronary revascularisation was performed. The use of prasugrel for up to 12 months should be confined to patients receiving PCI. GRADE: Strong; Level: IA

  • Consider continuation of dual antiplatelet therapy beyond 12 months if ischaemic risks outweigh the bleeding risk of P2Y12 inhibitor therapy; conversely, consider discontinuation if bleeding risk outweighs ischaemic risks.52 GRADE: Weak; Level: IIC

  • Initiate and continue indefinitely, the highest tolerated dose of an HMG-CoA (3-hydroxy-3-methylglutaryl-coenzyme A) reductase inhibitor (statin) for a patient following hospitalisation with ACS, unless contraindicated or there is a history of intolerance.53 GRADE: Strong; Level: IA

    • PP: Target cholesterol levels. There is additional benefit from progressive lowering of cholesterol levels, with no apparent lower limit. Within the context of an individualised care plan, a target low density lipoprotein cholesterol level of less than 1.8 mmol/L is suggested in the first instance.

  • Initiate treatment with vasodilatory β-blockers in patients with reduced left ventricular systolic function (left ventricular ejection fraction ≤ 40%) unless contraindicated.54 GRADE: Strong; Level: IIA

  • Initiate and continue angiotensin-converting enzyme inhibitors (or angiotensin receptor blockers) in patients with evidence of heart failure, left ventricular systolic dysfunction, diabetes, anterior MI or co-existent hypertension.55 GRADE: Strong; Level: IA

  • Attendance at cardiac rehabilitation or undertaking a structured secondary prevention service is recommended for all patients hospitalised with ACS.56,57 GRADE: Strong; Level: IA

    • PP: Individualisation of cardiac rehabilitation or secondary prevention service referral. A wide variety of prevention programs improve health outcomes in patients with coronary disease. After discharge from hospital, patients with ACS and, where appropriate, their companion(s) should be referred to an individualised preventive intervention according to their personal preference and values and the available resources. Services can be based in the hospital, primary care, the local community or the home.

System considerations

  • Continuous audit and feedback systems, integrated with work routines and patient flows, are strongly advocated to support quality assurance initiatives and provide data confirming continued, cost-efficient improvement in patient outcomes as a result of new innovations in care.

Box 1 –
Timing of troponin testing

Timing of sampling

Strategy*

Assays


0 hour (single sample)

Patients whose pain and symptoms resolved 12 hours prior to testing (cut points are the assay-specific 99th percentile

Both sensitive and highly sensitive (HS) assays

0 hour (single sample)

Patients with value < LoD of the specific assay (not > 99th percentile cut point) and symptom onset > 3 hours1517

HS assays

0 hour and 1 hour after presentation

Rule-in and rule-out AMI algorithms (cut points are assay-specific and not the 99th percentile)1820

HS assays

0 and 2 hours after presentation

ADAPT protocol13

Sensitive assays

Modified ADAPT protocol12,21(cut points are the assay-specific 99th percentile)

HS assays

0 and ≥ 3 hours after presentation

Previous NHFA protocol7

HS assays

HEART Pathway22,23 (cut points are the assay-specific 99th percentile)

Both sensitive and HS assays

0 and ≥ 6–12 hours after presentation

Rule-in and rule-out AMI algorithms5 (cut points are the assay-specific 99th percentile)

Sensitive and point-of-care assays


ADAPT = 2-Hour Accelerated Diagnostic Protocol to Assess Patients with Chest Pain Symptoms Using Contemporary Troponins as the Only Biomarker. AMI = acute myocardial infarction. HEART = History, Electrocardiogram, Age, Risk factors and Troponin. LoD = limit of detection. NHFA = National Heart Foundation of Australia. * With concurrent clinical risk stratification. † Reports on the use and outcomes of the biomarker strategy in clinical practice are not currently available.

Box 2 –
Risk classification for possible cardiac causes of chest pain


High risk

  • Ongoing or recurrent chest discomfort despite initial treatment
  • Elevated cardiac troponin level
  • New ischaemic changes on electrocardiogram (ECG), such as persistent or dynamic ECG changes of ST segment depression ≥ 0.5 mm; transient ST segment elevation (≥ 0.5 mm) or new T wave inversion ≥ 2 mm in more than two contiguous leads; or ECG criteria consistent with Wellens syndrome
  • Diaphoresis
  • Haemodynamic compromise — systolic blood pressure < 90 mmHg, cool peripheries, Killip Class > I and/or new onset mitral regurgitation
  • Sustained ventricular tachycardia
  • Syncope
  • Known left ventricular systolic dysfunction (left ventricular ejection fraction ≤ 40%)
  • Prior acute myocardial infarction, percutaneous coronary intervention or coronary artery bypass grafting

Low risk

  • Age < 40 years
  • Symptoms atypical for angina
  • Remain symptom free
  • Absence of known coronary artery disease
  • Normal troponin level
  • Normal ECG

Intermediate risk

  • Neither high risk nor low risk criteria

Box 3 –
Markers of increased risk of mortality and recurrent events among patients with confirmed acute coronary syndrome

Risk classification

Clinical characteristic


Very high

  • Haemodynamic instability, heart failure, cardiogenic shock or mechanical complications of myocardial infarction (MI)
  • Life-threatening arrhythmias or cardiac arrest
  • Recurrent or ongoing ischaemia (ie, chest pain refractory to medical treatment) or recurrent dynamic ST segment and/or T wave changes, particularly with intermittent ST segment elevation, de Winter T wave changes or Wellens syndrome, or widespread ST segment elevation in two coronary territories

High

  • Rise and/or fall in troponin level consistent with MI
  • Dynamic ST segment and/or T wave changes with or without symptoms
  • GRACE score > 140

Intermediate

  • Diabetes mellitus
  • Renal insufficiency (glomerular filtration rate < 60 mL/min/1.73 m2)
  • Left ventricular ejection fraction ≤ 40%
  • Prior revascularisation: percutaneous coronary intervention or coronary artery bypass grafting
  • GRACE score > 109 and < 140

GRACE = Global Registry of Acute Coronary Events.

The uptake of coronary fractional flow reserve in Australia in the past decade

The use of coronary pressure wires (or fractional flow reserve [FFR]) has been shown to reduce the frequency of major adverse cardiac events and of unnecessary stent procedures, and to lower treatment costs in both the public and private sectors in Australia.13 FFR is a tool for assessing physiological ischaemia in coronary artery stenosis, measuring pre- and post-stenosis pressures during adenosine-induced hyperaemia. Because it is evidence-based and quantifiable, it may be discussed during the upcoming Medicare reform. Data on its uptake across Australia, however, have not been published.

We examined trends in FFR use after its addition to the Medicare Benefits Schedule 10 years ago. We analysed Australian Government Department of Human Services data on Medicare items for coronary flow reserve, coronary angiography and percutaneous coronary angiography.

A total of 14 160 FFR services were processed by Medicare during the past 10 years. FFR use grew during this period, with a mean annual increase of 55%, from 131 services in 2007 to 3869 in 2015 (non-parametric analysis, P = 0.004). Time series analysis identified a Gompertz non-linear trend of FFR against time, indicating that national FFR use is continuing to increase, although growth began to slow in 2014. Further, FFR use increased on a population basis by an average of 45% each year, from 1 per 100 000 in 2007 to 16 per 100 000 in 2015, when these figures were highest in New South Wales (23 per 100 000) and Queensland (19 per 100 000) (Box).

The national rate of FFR per coronary angiogram increased from 0.02% in 2006 to 4.8% in 2015 (P = 0.004), when the highest rate was in NSW (5.8%). The rate of FFR per percutaneous coronary intervention (PCI) increased from 0.1% in 2006 to 19.2% in 2015 (P = 0.004), when the highest rate was in Queensland (26.6%). In 2015, there were 5.2 PCIs per FFR used; the rate was not related to the population size of the state or territory (Spearman non-parametric correlation, ρS = 0.07; P = 0.87) or to total PCI use (ρS = 0.12, P = 0.78). There was marked variation between states and territories (Box), highlighting heterogeneity across Australia in the use of FFR.

The data summarised in the Box allow operators and hospitals to compare their use of FFR with state and national averages, and they facilitate more standardised care across Australia. Barriers to the uptake of FFR include operator and centre experience, availability and cost. It has been suggested that FFR is discouraged by the lower remuneration received if stenting is not performed.4 From a national perspective, however, there is a mean saving of $1200 per patient in the public sector and $5000 per patient in the private sector when FFR makes stenting unnecessary,2 representing a total annual saving of $4 million.4

The use of FFR across Australia is heterogeneous, but it has grown over the past decade, both in absolute numbers and as proportions of coronary angiograms and PCI.

Box –
Summary of Medicare items for use of a coronary pressure wire (fractional flow reserve [FFR]) processed during 2015

Australia

NSW

Vic

Qld

SA

WA

Tas

ACT

NT


Total FFR services

3869

1764

688

944

146

225

77

11

14

FFR per 100 000 population

16

23

11

19

8

9

15

3

6

FFR per angiogram

1/21 (4.8%)

1/17 (5.8%)

1/28 (3.6%)

1/17 (5.7%)

1/30 (3.4%)

1/29 (3.5%)

1/21 (4.8%)

1/83 (1.2%)

1/38 (2.7%)

FFR per percutaneous coronary intervention

1/5.2 (19.2%)

1/4.6 (21.6%)

1/7.0 (14.3%)

1/3.8 (26.6%)

1/6.8 (14.7%)

1/7.7 (13.0%)

1/6.2 (16.2%)

1/34.1 (2.9%)

1/4.3 (23.3%)


Source: Australian Government Department of Human Services. Medicare Australia Statistics, medical item reports (http://medicarestatistics.humanservices.gov.au/statistics/mbs_item.jsp) for coronary flow reserve (item number, 38241), coronary angiogram (38215, 38218, 38220, 38222, 38225, 38228, 38231, 38234, 38237, 38240, 38246) and percutaneous coronary angiogram (38243, 38246).

Variation in coronary angiography rates in Australia: correlations with socio-demographic, health service and disease burden indices

The known Angiography rates vary across Australia. Whether this variation is correlated with indices of socio-economic deprivation, chronic disease, acute coronary syndrome (ACS) incidence, or health service characteristics is uncertain.

The new Social disadvantage and remoteness were correlated with ACS incidence and mortality, but not with angiography rates. Private hospital cardiac admissions were strongly correlated with angiography rates; the relationship with public hospital cardiac admissions was less marked. Socio-economic indicators, regional location, and ACS and chronic disease burden were not significantly associated with angiography rates.

The implications A focus on clinical care standards and better health service distribution is needed to reduce the variation.

Managing coronary artery disease (CAD) with coronary angiography is informed by an extensive evidence base.15 Variation in the rates of coronary angiography has been described in Australia.6,7 This variation may be explained by heterogeneity in clinical need (ie, variations in disease incidence or prevalence), but differences unexplained by disease burden highlight inequities in access to health services, and differential over- and underuse of health care resources. These disparities are potentially targets for policy interventions that aim to improve population health and achieve a high quality health system.

Health care in Australia faces a combination of challenges. The geographic distribution of the population and substantial cultural diversity give rise to complexity in providing access to clinical expertise and procedures such as angiography. Clinical audits of acute coronary syndrome (ACS) practice have identified variations in applying components of care advocated in guidelines, particularly invasive management.812 Australia’s demography may contribute to heterogeneity in access to health services, differential clinical needs and variation in care. The relative contributions of demographic factors have implications both for national policy and for local efforts to re-design health services.

In our study we explored the associations of selected socio-economic, geographic, and chronic disease factors with ACS incidence and mortality rates, and examined whether rates of coronary angiography across the Australian population are correlated with indicators of disease burden, health access, and clinical activity.

Methods

Data sources

Socio-economic and health workforce data

Our analysis included data for the entire Australian population of about 23.5 million people. Between 2010 and 2015, federal government support for primary health care services was organised into 61 geographic divisions (Medicare Locals). Social, economic and health service characteristics of the Medicare Locals were obtained from a publicly accessible website that publishes age- and sex-standardised rates for these features, including the estimated proportions of privately insured residents and of Indigenous residents, based on data from the 2011 Australian census (conducted by the Australian Bureau of Statistics [ABS]).13 Data from the Socio-Economic Indexes for Areas (SEIFA),14 a relative measure of social and economic disadvantage (normalised to 1000; higher numbers denote more advantaged areas), were also used as a socio-economic indicator. Medical workforce data were drawn from the annual survey of the Australian Health Practitioner Registration Authority, which records the primary locations of practice and specialisations of all registered medical practitioners. Further, modelled rates of chronic cardiovascular conditions (prior myocardial infarction and angina, heart failure, stroke and rheumatic heart disease), estimates derived from the Australian Health Survey 2011–2013 (conducted by the ABS), were available for all but three Medicare Locals (Tasmania, Northern Territory, Australian Capital Territory).

As an indicator of local clinical practice in each region, the likelihood that a suspected ACS patient received coronary angiography, compared with the national average, was estimated from the SNAPSHOT ACS clinical audit.9,10

Rates of ACS, angiography, revascularisation and mortality

The National Hospital Morbidity Database (NHMD) was used to identify ACS separations (International Classification of Diseases, revision 10, Australian modification [ICD-10-AM] principal diagnosis codes I20 and I21) and catheter procedures during the calendar year 2011. Data on procedures undertaken as ambulatory care (eg, outpatient angiography) were obtained by the Australian Institute of Health and Welfare (AIHW) from the Medicare Benefits Schedule. The combined total rate of angiography is presented in this article. All cardiac-specific admissions were included in the analysis. Three of the eight state or territory jurisdictions did not report data for private hospital admissions, so that private hospital and total admissions were not available for three Medicare Locals (Tasmania, NT, ACT). Data on deaths attributed to CAD were drawn from the National Mortality Database (NMD).

Statistical analysis

Standardised age- and sex-specific rates — of ACS separations, inpatient and outpatient angiograms, percutaneous coronary interventions (PCI), coronary artery bypass graft (CABG) procedures, and CAD-related deaths of people aged 35 years or more grouped in 5-year age intervals (to 85 years or more) and by sex — were calculated by dividing by the corresponding Australian population figure (at 30 June 2001) for the relevant age and sex group, and expressed as numbers per 100 000 population.

Socio-economic data, health service information, procedure and ACS incidence, and mortality rates were stratified by geographic location of the Medicare Local as defined by the AIHW, and compared using Kruskal–Wallis tests. Univariate correlations between potential explanatory factors and rates of angiography, ACS and mortality were assessed using partial correlations; the strength of the adjusted correlation coefficient (CC) was defined as strong (> 0.70), moderate (0.50–0.69), or weak (0.30–0.49). Separate correlation plots of ACS v CAD mortality rates and of angiography v ACS rates were generated, and fitted linear predictions superimposed. To assess the potential overuse of angiography, the ratio of the numbers of coronary revascularisations to those of coronary angiograms was calculated for each Medicare Local, and plotted as a function of the rate of coronary angiography, using the fractional polynomial estimate.

Given the small numbers of Medicare Locals and the availability of earlier data to evaluate these relationships, a Bayesian linear regression approach was used (Appendix). All analyses were undertaken in Stata 14.0 (StataCorp); P < 0.05 was deemed statistically significant.

Ethics approval

This SNAPSHOT ACS study was conducted with local ethics approval for opt-out consent, except for two hospitals where opt-in consent was applied (lead ethics committee: Cancer Council NSW Human Research Ethics Committee; reference, 2011/06/334). The AIHW work program and any release of data from AIHW datasets are subject to the oversight of the AIHW Ethics Committee and handled in accordance with the AIHW Act 1987 (as amended), the Privacy Act 1988, and any terms and conditions set by data providers. Separate ethics committee approval is not required for the analysis of AIHW datasets that does not involve data linkage, and was thus not needed for our study.

Results

Characteristics of the Medicare Locals

Of the 61 Medicare Locals, 27 were categorised by AIHW criteria as metropolitan, 24 as regional and ten as rural. Regional and rural locations were significantly more disadvantaged than metropolitan areas, with higher proportions of the population on long term unemployment support, greater reported delays in seeking medical consultation because of the associated costs, and lower proportions of residents with private health insurance. Similarly, the prevalence of smoking, obesity and chronic cardiovascular disease was higher in regional and rural areas than in metropolitan areas. There was no difference in the rates of total hospital admissions by geographic location, but there was a significantly lower rate of private hospital cardiac admissions in non-metropolitan locations, where fewer private hospitals exist (Box 1).

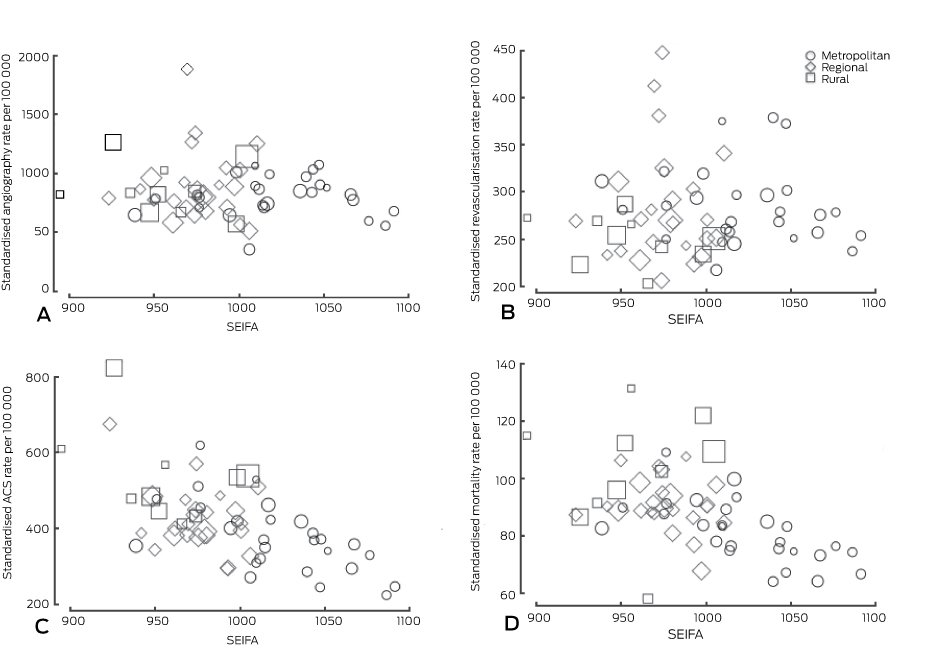
ACS rates were higher in non-metropolitan areas, but this was not reflected in a significantly higher rate of coronary angiography. PCI rates were significantly lower in rural areas, while rates of CABG were significantly higher in non-metropolitan areas. Overall, there was no significant difference in the combined coronary revascularisation rates according to geographic location. Premature death from CAD and total mortality were higher in regional and rural areas. There were 3.7-fold (ACS), 5.3-fold (angiography), 2.2-fold (revascularisation) and 2.3-fold (CAD mortality) differences between the lowest and highest rates for individual Medicare Locals. Box 2 shows the variation in ACS, angiography, revascularisation, and mortality rates for each Medicare Local by SEIFA index score.

Correlation of socio-economic, chronic health and health service data with ACS admission mortality rates

The ACS admission rates for individual Medicare Locals were significantly correlated with all-cause mortality (CC, 0.52; P < 0.001). There were strong correlations between socio-economic measures and ACS admission rates and mortality (Box 3). Similarly, rates of smoking, obesity and chronic cardiovascular conditions were all correlated with mortality; smoking and obesity rates were also correlated with ACS admission rates. Strong negative correlations between the proportion of insured people in the Medicare Local and the ACS admission and all-cause mortality rates were also observed. Conversely, there were negative correlations between local availability of specialist physicians and ACS admissions and mortality, as well as positive correlations between delays in consultations and these outcomes. From a health service use perspective, emergency department and public hospital admission rates were correlated with ACS admission and mortality rates, while private hospital cardiac admission rates were negatively associated with total mortality. An increased likelihood of patients admitted with suspected ACS undergoing angiography was associated with lower mortality (Box 3).

An adjusted analysis of mortality was performed to explore relationships with the indicators SEIFA score, regional location, local cardiovascular health status (chronic cardiovascular conditions), ACS rates, workforce capacity (access to specialist physician care), and health service provision (cardiac admission rates to public and private hospitals). Rural location was associated with increased mortality (19 additional deaths [95% CI, 10–27] per 100 000 population). Interestingly, the likelihood of coronary angiography in the context of ACS appeared to be associated with a modest reduction in mortality rates (three fewer deaths [95% CI, 1–5] per 100 000 population for each 10 percentage point increase in the likelihood of angiography for a suspected ACS admission). After considering these two factors, socio-economic index, disease burden, health service indicators, and angiography rates were not significantly correlated with the Medicare Local CAD mortality rate.

Correlation of socio-economic status, chronic health status and health service with angiography rates

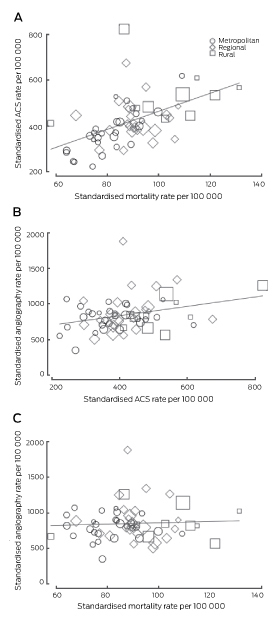
There was no correlation between measures of social disadvantage or health service availability and coronary angiography rates (Box 3). A positive correlation between all cardiac admissions and angiography rates was evident, particularly private hospital cardiac admissions. This correlation was weaker when analysis was restricted to public hospital admissions. The likelihood of angiography for acute patients was not correlated with the overall rate of angiography in Medicare Locals. There was a weak correlation between the rates of angiography and of ACS (CC, 0.31; P = 0.018), but no correlation with premature ischaemic heart disease deaths (CC, 0.13; P = 0.315) or total CAD mortality (CC, 0.06; P = 0.671) (Box 4).

In the adjusted model, private hospital cardiac admissions had a large influence on the angiography rate (71 additional angiograms [95% CI, 47–93] per 1000 admissions). The relationship between public hospital admission rates and the angiography rate was more modest (44 angiograms [95% CI, 25–63] per 1000 admissions). Socio-economic indicators, regional location, and background ACS or chronic disease rate burden were not significantly associated with angiography rates.

Progression from angiography to revascularisation

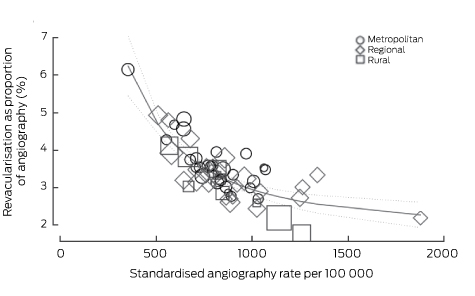
The angiography rate was correlated with those of PCI (CC, 0.54; P < 0.001), CABG surgery (CC, 0.44; P < 0.001) and any revascularisation (CC, 0.65; P < 0.001). Revascularisation rates as a proportion of angiography rates varied greatly (17–61%). There was a striking negative correlation between the angiography rate and the proportion of patients undergoing angiography who proceeded to any form of coronary revascularisation (CC, −0.71; P < 0.001) (Box 5). This was also seen with the individual modes of revascularisation (PCI: CC, −0.62; P < 0.001; CABG: CC, –0.62; P < 0.001). There was no correlation between PCI rates and the incidence of myocardial infarction (CC, −0.11; P = 0.402) or ACS (CC, −0.12; P = 0.345). However, rates of CABG were correlated with those of myocardial infarction (CC, 0.53; P < 0.001) and of ACS (CC, 0.45; P < 0.001).

Discussion

We observed that:

  • increasing socio-economic disadvantage, rural location, and chronic disease burden were each correlated with rates of ACS and of total mortality;

  • local availability of specialist physicians and admissions to private hospitals were negatively correlated with ACS admissions and mortality rates;

  • there was no association between coronary angiography rates and the burden of chronic cardiovascular disease, and a modest positive association with ACS rates, but there was a positive association between angiography rates and those of cardiac admissions to private hospitals; and

  • the rates of angiography and coronary revascularisation were correlated, but there was a negative correlation between the local angiography rates and the proportion of these procedures proceeding to revascularisation.

These findings suggest that health reforms aimed at the appropriate use of diagnostic coronary angiography may be required to improve consistency and equity of access, and consequently to deliver positive outcomes for the Australian community more efficiently.

As expected, a correlation between the incidence of ACS and CAD mortality was evident. Similarly, higher ACS rates in regional and rural locations were confirmed, as was the relationship between indicators of socio-economic disadvantage and chronic cardiac disease burden, and between disease incidence and outcomes. However, the distribution of acute care services was negatively correlated with the incidence of disease in the population. This geographic mismatch has also been described elsewhere, including the United States, and highlights the influence of factors such as funding and workforce proficiency in delivering services to non-metropolitan communities.1517

A solid evidence base supports using coronary angiography, with subsequent revascularisation where deemed appropriate, in ACS patients with elevated troponin levels.18 However, the superiority of angiography and revascularisation to medical management of patients with stable CAD is less robust.5,19 This clinical evidence base contrasts strongly with several of our findings. Firstly, the indicator most associated with variation in angiography appeared to be cardiac admission rates to private hospitals, but an inverse correlation with ACS rates implies that these procedures are mainly being undertaken for indications other than ACS. Secondly, while angiography rates were correlated with revascularisation rates, neither angiography nor PCI rates (unlike the CABG rate) were correlated with that of ACS. Thirdly, angiography rates were negatively correlated with progression to revascularisation. These observations are inconsistent with the evidence base for invasive management for non-ACS indications, with private institutions accounting for a higher proportion of the variation. Computed tomography coronary angiography for investigating non-acute CAD may reduce the use of invasive angiography for this indication, but caution should be exercised, as there is ample evidence that all forms of cardiac testing tend to motivate further investigations.19,20

These comparisons suggest certain policy targets for improving the clinically appropriate application of coronary angiography. At the higher end of patient risk, the Australian Commission on Safety and Quality in Health Care has developed clinical care standards for the management of ACS.21 These standards may appropriately increase the use of angiography for ACS patients, for whom the benefits of invasive management have been established. Linking the funding of hospitals to ACS performance measures may be an approach for achieving changes in practice and outcomes. Further, resourcing and implementing clinical support networks that serve regional and remote areas (eg, telemedicine) would enable the appropriate selection of patients who would benefit most from being transferred for angiography and revascularisation, and this would also be an opportunity for improving access to angiography. While there is no current guidance on stable CAD in Australian, criteria for the appropriateness of angiography and revascularisation have been developed in the US.22 It is notable that re-imbursement by Medicare and Medicaid in the US for the costs of invasive procedures is now linked to these appropriateness criteria. It is suggested that funding linked to the appropriateness of care or the achievement of clinical care standards, and limiting re-imbursement for angiography in low value clinical situations, should be focuses of debate in any health care reform discussion in Australia.

Limitations

Given the ecological study design, pockets of excellence in care and outcomes probably exist but are obscured by data aggregation. Further, in view of the small number of Medicare Locals, a linear relationship between variables was assumed, although curvilinear relationships are possible. The small sample of the SNAPSHOT ACS study is acknowledged, with caution accordingly exercised when interpreting the association with mortality rates. While this relationship should be examined in larger studies, our finding is consistent with international large scale data.23 Similarly, we cannot fully exclude the possibility of under- (misclassification) or over-reporting (double counting secondary to inter-hospital transfers) of ACS admissions or procedures; systematic under-reporting is, however, unlikely, given the funding implications of these coding practices. Detailed interrogation of the system would require documentation of patient-level characteristics and care, combined with an evaluation of the health service infrastructure beyond the availability of catheter laboratories, extending to other modalities of cardiac investigation, such as computed tomography coronary angiography and functional imaging. Such information is not currently available in Australia.

Conclusion

Significant variation in providing coronary angiography, not related to clinical need, is evident across Australia. A greater focus on clinical care standards and better distribution of health services will be required if these disparities are to be reduced.

Box 1 –
Socio-economic and health service characteristics, and age- and sex-standardised rates of death, diagnosis, and coronary procedures (per 100 000 population), by Medicare Locals stratified according to metropolitan, regional and rural locations, for the calendar year 2011

Total

Metropolitan

Regional

Rural

P


Number

61

27

24

10

Socio-economic indicators

SEIFA score, mean (SD)

992 (42)

1022 (39)

976 (21)

955 (33)

0.001

Indigenous population, mean (SD)

3.9% (5.5)

1.1% (0.7)

3.1% (2.1)

13.2% (8.1)

0.001

Long term unemployed, mean (SD)

3.5% (1.4)

2.6% (1.1)

4.1% (1.0)

4.6% (1.5)

0.001

Private insurance, mean (SD)

44.3% (9.9)

51.7% (9.3)

40.8% (4.3)

33.0% (5.2)

0.001

Chronic health status indicators

Diabetes, mean (SD)

5.3% (1.0)

5.7% (1.1)

4.8% (0.7)

5.5% (0.9)

0.004

Hypertension, mean (SD)

10.2% (0.6)

10.2% (0.6)

10.3% (0.6)

10.1% (0.5)

0.994

Smokers, mean (SD)*

19.1% (3.6)

16.2% (2.9)

21.4% (1.8)

22.8% (1.5)

0.001

Obesity, mean (SD)*

28.3% (4.2)

25.5% (4.4)

30.6% (1.9)

31.4% (2.1)

0.001

Hypercholesterolaemia, mean (SD)

33.1% (1.7)

32.9% (1.4)

33.6% (1.8)

32.1% (2.2)

0.186

Chronic cardiovascular condition, mean rate (SD)*

88 (14)

81 (11)

91 (9)

102 (21)

< 0.001

Premature ischaemic heart disease, mean rate (SD)

28.4 (10.2)

22.9 (5.1)

27.6 (3.4)

45.3 (13.3)

< 0.001

Access and health workforce indicators

Delay in medical consultation because of cost, mean (SD)

14.6% (3.6)

13.2% (3.8)

15.3% (2.9)

16.8% (3.1)

0.006

Primary care physicians, mean rate (SD)

110.8 (17.4)

113.9 (22.1)

109.1 (10.8)

106.3 (15.8)

0.776

Specialist physicians, mean rate (SD)*

22.9 (21.6)

34.2 (26.7)

13.4 (6.5)

10.8 (6.4)

0.002

Health service provision indicators

Primary care health check, mean rate (SD)

4266 (1181)

4336 (1034)

4548 (1239)

3401 (1111)

0.032

Public cardiac admissions, mean rate (SD)

1684 (451)

1366 (274)

1826 (316)

2201 (479)

< 0.001

Private cardiac admissions, mean rate (SD)

752 (264)

861 (202)

717 (283)

527 (227)

0.021

All emergency department presentations, mean rate (SD)

30 881 (11 358)

24 939 (11 358)

32 400 (9837)

43 277 (17 082)

< 0.001

Likelihood of angiogram in suspected acute coronary syndrome, mean (SD)

40.6% (16.7)

49.2% (17.2)

30.9% (8.9)

41.4% (18.2)

< 0.001

Coronary events and procedures

Myocardial infarction, mean rate (SD)

250 (63)

225 (48)

250 (46)

316 (90)

0.003

Acute coronary syndrome, mean rate (SD)

419 (108)

375 (93)

423 (84)

532 (120)

< 0.001

Coronary angiography, mean rate (SD)

849 (236)

803 (167)

895 (300)

863 (218)

0.742

Percutaneous coronary intervention, mean rate (SD)

212 (47)

222 (38)

215 (58)

178 (23)

0.009

Coronary artery bypass surgery, mean rate (SD)

70 (15)

64 (13)

74 (15)

75 (18)

0.040

Revascularisation, mean rate (SD)

278 (49)

284 (41)

283 (61)

250 (25)

0.089

Premature ischaemic heart disease deaths, mean rate (SD)

28.4 (10.2)

22.9 (5.1)

27.6 (3.4)

45.3 (13.3)

< 0.001

Premature cerebrovascular accident deaths, mean rate (SD)

9.2 (2.4)

8.2 (1.6)

9.4 (1.7)

11.5 (3.7)

< 0.001

Total mortality, mean rate (SD)

88 (14)

81 (11)

91 (9)

102 (21)

< 0.001

Population, mean (SD)

296 666 (165 595)

414 767 (144 115)

232 023 (110 353)

132 939 (94 442)

< 0.001


SEIFA = Socio-Economic Indexes for Areas. * Estimates from modelled data: not available for three Medicare Locals (all rural). † Data not released for three Locals (one each for metropolitan, regional and rural). ‡ Annualised rates per 100 000 individuals for 2008–2011.

Box 2 –
Variation in angiography, revascularisation, acute coronary syndrome and mortality rates according to Socio-Economic Index for Australia score for the location of the Medicare Local*


SEIFA = Socio-Economic Indexes for Areas score; a higher SEIFA value indicates lesser disadvantage. * The size of the symbol is proportional to the size of the population served by the Medicare Local.

Box 3 –
Correlations between indicators of socio-economic status, health status, health workforce, health care access and clinical practice, and coronary angiography, acute coronary syndrome and mortality rates in Medicare Locals*

Coronary angiography rate

Acute coronary syndrome admission rate

Total mortality rate


Socio-economic indicators

SEIFA score

–0.11 (0.42)

–0.62 (< 0.001)

–0.54 (< 0.001)

Indigenous population

–0.08 (0.53)

0.53 (0.002)

0.30 (0.019)

Long term unemployed

–0.07 (0.62)

0.60 (< 0.001)

0.46 (0.002)

Private insurance

–0.15 (0.24)

–0.65 (< 0.001)

–0.62 (< 0.001)

Chronic health status indicators

Diabetes

–0.22 (0.10)

–0.05 (0.72)

0.001 (0.94)

Hypertension

–0.27 (0.03)

–0.17 (0.20)

0.16 (0.22)

Smokers

0.25 (0.05)

0.61 (< 0.001)

0.62 (< 0.001)

Obesity

0.15 (0.26)

0.51 < 0.001)

0.65 (< 0.001)

Hypercholesterolaemia

0.16 (0.23)

–0.39 (0.002)

–0.08 (0.54)

Chronic cardiovascular condition

–0.21 (0.12)

0.05 (0.70)

0.38 (0.003)

Premature ischaemic heart disease

0.13 (0.32)

0.59 (< 0.001)

0.58 (< 0.001)

Access and health workforce indicators

Delay in medical consultation because of cost

0.05 (0.69)

0.61 (< 0.001)

0.45 (< 0.001)

Primary care physicians

–0.07 (0.59)

–0.26 (0.04)

–0.39 (0.002)

Specialist physicians

0.12 (0.37)

–0.41 (0.002)

–0.47 (< 0.001)

Health service provision indicators

Primary care health check (45 years)

0.28 (0.03)

0.02 (0.88)

–0.12 (0.35)

Public cardiac admissions

0.30 (0.02)

0.65 (< 0.001)

0.49 (< 0.001)

Private cardiac admissions

0.44 (0.006)

–0.13 (0.32)

–0.42 (< 0.001)

Emergency presentations

0.14 (0.28)

0.47 (0.001)

0.35 (0.005)

Likelihood of angiogram in suspected acute coronary syndrome

0.06 (0.69)

–0.01 (0.96)

–0.40 (0.002)


SEIFA = Socio-Economic Indexes for Areas. * Expressed as correlation coefficient, with significance (P) in parentheses. † Correlation between percentage of population positive for indicator and angiography, acute coronary syndrome admissions and mortality rates.

Box 4 –
Correlation between acute coronary syndrome and mortality rates, angiography and acute coronary syndrome admissions rates, and angiography and mortality rates*


ACS = acute coronary syndrome. * The size of the symbol is proportional to the size of the population served by the Medicare Local.

Box 5 –
Revascularisation rates as proportions of angiography rates in each Medicare Local,* with fractional polynomial estimate and 95% confidence band


* The size of the symbol is proportional to the size of the population served by the Medicare Local.

Ensuring access to invasive care for all patients with acute coronary syndromes: beyond our reach?

We need to ensure that those who need care most receive it

Coronary artery disease (CAD) remains the leading cause of death and disability in Australia, with suspected acute coronary syndromes (ACS) being the most common reason for acute presentation to hospital.1 A substantial body of evidence supports the early use of invasive care — coronary angiography and, if appropriate, revascularisation (either by percutaneous coronary intervention [PCI] or coronary artery bypass grafting [CABG]) — in patients presenting with ST-elevation myocardial infarction to reduce mortality and re-infarction rates.2 Evidence and expert opinion also favour invasive management of patients with high risk, troponin-positive non-ST-elevation ACS (NSTEACS).3,4 In patients with stable CAD, there is no evidence for any benefit from invasive care if optimal medical therapy is administered.5 Access to invasive care should be in accordance with clinical need, and this is likely to be greater in populations with a higher prevalence of CAD, CAD-related deaths, and coronary risk factors.

In this issue of the MJA, a large ecological study encompassing the entire population of 61 (former) Medicare Locals and using information from several databases identified associations between socio-economic, geographic and chronic cardiovascular disease factors and ACS incidence and mortality rates.6 Chew and colleagues also examined whether rates of invasive care (coronary angiography being the key measure) were correlated with indicators of disease burden, access to care, and clinician practice.

The study had some limitations. Data were analysed and associations between different variables (presumed to be linear) defined at the population rather than at the individual level; data on private hospital admissions were missing for three of eight state or territory jurisdictions; rates of ACS, invasive care and CAD-related deaths were only adjusted for age and sex, not for other risk factors or measures of disease severity; the likelihood of a patient with suspected ACS receiving coronary angiography was based on a relatively small national snapshot audit (n = 4398) from 8 years ago;7 the timing of invasive care after the ACS event was not provided; and rates of non-invasive co-interventions for ACS were not included in the analysis.

Despite these limitations, some of the key findings are interesting. Rates of angiography and of ACS were only weakly correlated, with no correlation between ACS and PCI rates; these trends were most evident in non-metropolitan areas where CAD mortality was highest. While ACS rates varied 3.7-fold between Medicare Locals, angiography rates varied 5.3-fold. The strongest predictor of angiography being undertaken was admission as a cardiac patient to a private hospital (71 additional angiograms per 1000 admissions), despite lower rates of ACS among private patients, suggesting that many procedures were for non-ACS indications. Coronary revascularisation rates as a proportion of angiography rates varied between 17% and 61%; higher angiograms rates were associated with reduced likelihood that revascularisation followed. There was a reasonably strong positive association between rates of ACS and CABG, suggesting that less invasive PCI is more vulnerable to unwarranted use. Depressingly, the study also reconfirmed the higher ACS rates in non-metropolitan locations where the prevalence of smoking, obesity and chronic cardiovascular disease is higher.

The disparity between rates of invasive care and those of ACS and overall CAD burden probably means that some patients are receiving interventions they do not need, while, more worryingly, patients who have real need for them are missing out. Without data on clinical indications and criteria of appropriateness for individual patients, overuse cannot be distinguished from underuse. Nevertheless, such variations in invasive care, seemingly unexplained by variations in clinical indications, are of concern, especially as they have been documented since 2005.711

So why is universal access to invasive care according to need seemingly beyond our reach? It is not for want of trying on the part of national professional bodies that develop, disseminate and promote evidence-based recommendations and implementation frameworks.12 The answer lies with front line health care delivery systems. Cardiology service networks at the state level should collect data on ACS incidence and rates of invasive care in public and private facilities, identify locations where the mismatch is greatest, and seek to understand and mitigate the relevant factors. Networked, hub-and-spoke support systems of rapid diagnostic, referral and transfer procedures are needed, whereby patients with ACS presenting to any emergency centre have rapid access to invasive care in angiography-capable facilities, in accordance with clinical indications and socio-cultural context, and without logistical barriers.13,14 Hospitals should report on their provision of appropriate ACS care according to agreed care standards and data collection methods, for benchmarking against peers and sharing improvement strategies.15

Invasive care prevents about 10% of all CAD-related deaths, whereas medical treatments and reducing risk factors account for at least 80% of saved lives.16 As Chew and colleagues report, a higher probability of undergoing coronary angiography was associated with only a modest reduction in ACS mortality rates (three fewer deaths per 100 000 population for each 10 percentage point increase in likelihood of angiography). The maximal gain in lives saved after ACS onset will require optimisation of all care modalities along the entire patient trajectory. However, while non-invasive care is not consistently employed across Australia,710 differences in the use of invasive care are more marked and cannot be allowed to persist into the next decade.

“Congenital heart health”: how psychological care can make a difference

An integrated approach incorporating both physical and mental health is critical to “congenital heart health”

Congenital heart disease (CHD) affects more than 2400 Australian babies each year. It is the most common cause of admission to paediatric intensive care in the neonatal period,1 a leading cause of infant death2 and one of the leading causes of disease-related disability in children under 5 years of age.3 In Australia and around the world, the landscape of CHD care is rapidly evolving. With advances in medicine, survival has markedly improved over the past two decades4 and the best estimates suggest that the total population, from newborns through to adults living with CHD, now represents well over 65 000 Australians.5 These gains in survival are a triumph, but paradoxically, they bring new challenges. Earlier diagnosis, more complex treatment choices, longer survivorship and a need for transition from paediatric to adult cardiac services lead us into new territory. Embedded in each of these challenges are a range of psychological complexities, foremost of which is how to best support the wellbeing of people with CHD across a lifetime. “Congenital heart health” requires an integrated, life course approach — with equal emphasis on the physical and the psychological — beginning before birth, through infancy to adulthood. This article presents the evidence for such an approach, highlighting the areas where evidence is lacking and calling for national standards of mental health care in CHD.

Beginning before birth: the mental health of expectant parents

Fetal diagnosis of CHD has changed clinical care. Half of all babies who need heart surgery in the first year of life are now diagnosed while in the womb.6 A major advantage of fetal diagnosis is that potentially unstable newborns can be delivered close to specialised paediatric cardiac services, reducing morbidity and improving survival.7,8 Fetal diagnosis also facilitates early family counselling regarding the nature of the baby’s heart abnormality and expected prognosis. But when a parent hears words such as “your baby has tetralogy of Fallot” their world stops. Fetal diagnosis of any abnormality, major or minor, precipitates an emotional crisis for expectant parents. Threats to the health of the fetus have long been recognised as an important risk factor for psychological disturbance during pregnancy, which in turn indicates a high risk of ongoing psychiatric disorders postpartum. Research has shown that one in three mothers and fathers of infants with complex CHD report symptoms that meet clinical criteria for depression, and about 50% of parents report severe stress reactions consistent with a need for clinical care up to 1 year after their baby’s diagnosis.9 These rates far exceed documented rates of perinatal depression and anxiety in the general community10 and as health care providers, we often markedly underestimate the severity and potential consequences of these symptoms.

There is now overwhelming evidence that depression and anxiety in the perinatal period (from conception to the end of the first postnatal year) can have devastating consequences, not only for the person experiencing it, but also for his or her children and family. Parents with high distress report poorer physical health,11 greater parenting burden,12 higher health service use13 and more suicidal ideation14 compared with parents of sick children with lower distress. At least 14 independent prospective studies have demonstrated a link between maternal antenatal stress and child neurocognitive, behavioural and emotional outcomes.15 Acknowledging these findings is not to blame parents — not in any way, not at all. But to not talk about this, to not address the significant emotional toll of CHD, is to not provide optimal care.

Early life experiences can have profound consequences

Diagnosis of a life-threatening illness during a child’s formative years can have far-reaching effects that ripple through the family and across a lifetime. Infants with complex CHD experience a range of uncommon and painful events, such as separation from their mother at birth, urgent transfer to specialised intensive care, frequent invasive medical procedures, feeding difficulties and withdrawal from narcotic pain relief. These early life experiences can have profound consequences for the developing child, shaping brain development, the body’s immune system and responses to stress. Studies of individuals exposed to high levels of stress early in life consistently show that the experience of early adversity is associated with disrupted child–parent attachment and with alterations in the developmental trajectories of networks in the brain associated with emotion and cognition.16

From a neurodevelopmental perspective, children with CHD experience greater difficulties compared with their healthy peers. The risk and severity of neurodevelopmental impairment increases with greater CHD complexity, the presence of a genetic disorder or syndrome, and greater psychological stress. During infancy, the most pronounced difficulties occur in motor functioning. By early childhood, studies show that children with complex CHD have an increased risk of neurodevelopmental impairment, characterised by difficulties in fine and gross motor skills, speech and language, attention, executive functioning, emotion regulation and behaviour.17 Emotionally, 15–25% of parents report significant internalising (eg, anxiety, depression, somatisation) or externalising (eg, aggression) difficulties in their child.18 Few studies have used validated clinical assessments, but those studies that have included a clinical assessment report psychiatric illness in more than 20% of adolescents and young adults with CHD. There is also a diagnostic rate of attention deficit and hyperactivity disorder up to four times higher than in the general population.18

Navigating the transitions of adolescence

Young people must not only navigate the typical transitions of adolescence and early adulthood, they also face the challenges that come with developing a sense of identity and autonomy in the context of CHD while, at the same time, breaking the bonds formed with their paediatric team and transitioning to adult cardiovascular care. Clinicians lose their “clinical hold” on so many patients during this process, with an alarmingly high proportion of adults with CHD (24–61%) not receiving the recommended cardiac care.5,19,20 This can have catastrophic health consequences,5 yet our understanding of the factors that influence transition is wanting. In 2013, the Cardiac Society of Australia and New Zealand published a statement outlining best practices in managing the transition from paediatric to adult CHD care.21 This statement recognises the role that psychological factors play in shaping young people’s capacity to manage their heart health care, in addition to clinical, familial and practical factors.

Living with CHD into adulthood

Our understanding of the psychology of adult CHD lags decades behind our knowledge of children’s experiences. While neurodevelopmental clinics have been established at several paediatric cardiac centres across Australia, little attention is paid to neurocognitive health in adult CHD care. Without effective intervention, hardships encountered during infancy and childhood can persist for years after diagnosis and treatment. It is also possible for difficulties to emerge for the first time in adulthood, with heart failure, atrial fibrillation, cardiac surgery and recurrent strokes increasing vulnerability to neurocognitive impairment in adults with CHD. A meta-analysis of 22 survey-based studies of emotional functioning in adolescents and adults with CHD found no differences from the norm;22 however, studies using clinical interviews have found that one in three adults with CHD report symptoms of anxiety or depression warranting intervention.23 The vast majority of these adults go untreated.

An integrated psychology service dedicated to CHD

In 2010, we established an integrated clinical psychology service dedicated to CHD. Located across the Sydney Children’s Hospitals Network, we provide a statewide mental health service for children and young people with all forms of heart disease and their families (Box). Evidence-based, psychologically informed care and a variety of interventions can prevent or relieve psychological morbidity.24 National (beyondblue, 2011) and international (International Marcé Society, 2013) authorities now recognise and endorse psychosocial assessment for depression and anxiety in the perinatal period as part of routine clinical care. Integrating psychosocial assessment within existing health services has been shown to improve treatment uptake, as well as mental health and parenting outcomes, up to at least 18 months postpartum.24 Indeed, integrating psychosocial assessment within a clinical setting with which families are already engaged is a key factor distinguishing successful and unsuccessful early mental health interventions. Providing tailored skills-based training and support to staff also has the potential to overcome a range of patient (eg, stigma, cost), provider (eg, limited awareness, low confidence), and health system (eg, cost, under-prioritisation) factors that can prevent access to care. Moreover, there are costs to not offering mental health care. In neonatal intensive care, for example, targeted interventions significantly reduce maternal depression and anxiety, increase positive parent–infant interactions, and reduce health service costs by reducing the length of stay at the neonatal intensive care unit and total hospital admission.25

A call for national standards of mental health care in CHD

While there may be deep sadness associated with many aspects of CHD, there may also be deep hope and, for many, good health. Early intervention can make a profound difference for families and influence a lifetime of outcomes for a child. To transition CHD to “congenital heart health”, equal emphasis must be placed on both physical and mental health so that the successes in physical care are not undermined by the absence of adequate emotional care. Across the CHD continuum, there are still huge gaps in access to mental health services. To start to address these gaps, we call for the formation of a multidisciplinary working group to develop national standards of mental health care in CHD. We also advocate strongly for more Australian research across the discovery-to-translation pipeline such that, from early life in the womb through to adulthood, we can better understand — and prevent or assuage — the difficulties that our patients and their families experience.

Box –
Integrated model of psychological care dedicated to congenital heart disease and based at the Heart Centre for Children


National Institute for Health and Care Excellence. Antenatal and postnatal mental health: clinical management and service guidance. NICE clinical guidelines, no. 192 (updated edition). London: NICE, 2014.

[Perspectives] Transgender community voices: a participatory population perspective

Understanding the global health burden and needs of transgender communities necessitates meaningful engagement and involvement of transgender people. Against the backdrop of widespread social and economic exclusion facing people of diverse gender identities and experiences, community empowerment is essential for clinical services, public health programmes, and human rights efforts that seek to design and implement effective services and population-level interventions to improve the health and wellbeing of transgender people.

Doctors challenge Border Force gag laws

Image: paintings%20/%20Shutterstock.com“>paintings / Shutterstock.com

Controversial Federal Government laws to suppress information regarding the operation of immigration detention centres are being challenged by a group doctors who claim they are being used to intimidate health workers.

The group Doctors for Refugees and the Fitzroy Legal Service have jointly launched action in the High Court challenging the constitutionality of secrecy provisions in the Australian Border Force Act which threaten up to two years imprisonment for workers who disclose conditions in detention centres.

In a Statement of Claim filed with the High Court on 27 July, Doctors for Refugees said it was bringing the action to “advocate for the public’s right to know what their Government is doing in their name, and to support the public health imperative of transparency to mitigate harm occurring in detention centres on and offshore”.

The action asks for the High Court to rule on whether the public disclosure of information regarding the operation of detention centres, including conditions, health care, mandatory detention and offshore detention, are protected by the freedom of political communication implied in the Constitution, and whether the ABF Act invalidly prohibits such communications.

The Act, which was introduced last year, includes provisions which make it a criminal offence for those contracted to provide services to the Department of Immigration and Border Protection to record or disclose information obtained in the course of their work. The penalty is up to two years’ imprisonment. The legislation was passed with support from Labor.

The Act was introduced amid widespread concern regarding conditions in detention centres, including reports of widespread sexual abuse and significant physical illness and mental health problems, particularly among children.

The Moss review substantiated allegations of sexual abuse at the Nauru Detention Centre, and operator Transfield Services reported 67 claims of child abuse, 33 allegations of sexual assault or rape, and five alleged instances of sexual favours traded for contraband.

Soon after being elected, the Coalition Government abolished an independent panel of medical experts that was overseeing health care in detention centres, and has so far ignored AMA calls to replace it with a group of health experts empowered to investigate and report on detention centre conditions directly to Parliament.

Doctors have protested that the secrecy provisions in the ABF Act conflict with their ethical duties and their obligations under the Medical Board of Australia’s Code of Conduct, most particularly their paramount obligation to the health of their patients.

These concerns have been magnified by a number of cases in which, it is claimed, authorities have sought to intervene in or override clinical advice on the transfer of detainees in need of medical attention, including the death of Omid Masoumali, who was medically evacuated to Australia from Nauru more than 24 hours after setting himself alight.

Suspicion that the Government has sought to interfere in the clinical decisions of doctors has been heightened by documents obtained by The Australian under Freedom of Information laws showing Immigration officials devised a strategy to prevent detainees from being evacuated to Australia for medical treatment because of a “propensity of those transferred to Australia to join legal action which prevents their subsequent return to PNG or Nauru”.

The Government has denied that the intention of the law is to prevent doctors from speaking up on behalf of their patients, and Immigration Minister Peter Dutton has indicated he thinks it unlikely that health practitioners would be prosecuted under the Act.

But it has since been revealed that Dr Peter Young, who oversaw the mental health care of detainees for three years, was the subject of Australian Federal Police investigation, including access to his electronic communications.

At its most recent Naiotnal Conference, the AMA passed an urgency motion asking the Federal Council to “look into the matter” of AFP surveillance of doctors.

In its Statement of Claim, Doctors for Refugees said the Government’s assurances had “not altered the perception that the ostensible intent of the ABF Act is to silence doctors, teachers, social workers and others working in detention centres”.

“Regardless of whether prosecutors exercise a discretion to charge health practitioners working with refugees and asylum [seekers], the law remains in place,” the Statement said. “Practitioners speaking out are subject to a Sword of Damocles, unsure when or if they might be investigated or charged for adhering to their ethical (and moral) obligations.”

Doctors for Refugees said that even if the High Court found that the ABF Act’s secrecy provisions served a legitimate purpose, it would also have to decide whether the constraint they imposed on political communication was “proportionate”.

“The ultimate question is whether the secrecy provisions…undermine the proper functioning of our democracy and the right of electors to be informed accurately, openly and truthfully about matters of national political importance,” the group said.

Adrian Rollins


Time to bury “hypertension”

An absolute cardiovascular risk approach will better target patients who need pharmacotherapy

The publication of the Systolic Blood Pressure Intervention Trial (SPRINT), sponsored by the United States National Institutes of Health, has left physicians claiming that systolic blood pressure targets of < 120 mmHg are too low and unobtainable, and that the results are not generalisable to their “real” patients.1 Although it was ostensibly a “hypertension optimal treatment” trial, it was also, in effect, a quasi-trial of the treatment for elevated blood pressure in high risk individuals who would otherwise remain untreated. This can be argued because the study population were all high risk patients determined by age, clinical conditions or Framingham risk score, and the entry-level systolic blood pressure was 130 mmHg rather than the normal treatment threshold of 140 mmHg. The low entry level, with a mean systolic blood pressure of 139.7 mmHg, probably explains the low targets achieved in the intensive treatment group. The study demonstrated not only that the reduction of systolic blood pressure leads to benefits in decreasing the rates of all-cause mortality and cardiovascular morbidity and mortality, but also that this reduction could be achieved with relative safety, even for older patients, as there was no overall difference in serious adverse event rates between the intensive treatment group and the standard treatment group. This conclusion had also been arrived at in the Hypertension in the Very Elderly Trial, a randomised controlled study of blood pressure lowering in very old patients, where serious adverse events were actually lower in the treatment group compared with the placebo group.2 The accepted wisdom of “it only takes one broken hip to wipe out all that gain in cardiovascular risk” does not seem to hold true.3

The predictable criticism of the findings reflects the entrenched clinical concept of hypertension — that there is a magic figure above which you have the condition and below which you do not. SPRINT reinforces that lowering blood pressure to at least 120 mmHg may be beneficial for a high risk individual as no J-curve nadir was demonstrated. It is opportune to return elevated blood pressure to its continuous variable risk factor status rather than treat it as a dichotomous disease. After all, the very term “hypertension” is confusing to patients.4

Who should we treat with blood pressure-lowering drugs?

Initiation of pharmacotherapy should be reserved for those who will probably benefit in terms of preventing a major adverse cardiovascular event, and when this benefit clearly outweighs the potential harms of side effects and costs of treatment. Candidates are therefore those at moderate to high risk of such events in what is an asymptomatic condition. A simple algorithm populated by the most important determinants of cardiovascular disease risk is sufficient to identify the individuals who do not have a manifest disease. This is readily accessible with the Australian absolute cardiovascular risk calculator.5 Such an approach recognises that drug therapy should be considered in the context of the whole person, while acknowledging that action on risk stratification can be challenging and complex for many.

Implementing the absolute cardiovascular risk factor approach in Australian health care

Australian clinical practice has not yet widely adopted the absolute cardiovascular risk factor approach,6 despite the development of evidence-based guidelines by the National Vascular Diseases Prevention Alliance (NVDPA). These guidelines are the result of a collaboration of four peak bodies — Kidney Health Australia, the National Heart Foundation, the National Stroke Foundation and Diabetes Australia — and have the endorsement of the National Health and Medical Research Council (NHMRC).7,8 The NHMRC has also recently adopted the absolute cardiovascular risk approach as one of its priority cases for research translation.9

With such an approach, the recommended pharmacotherapy regimen will need to be changed for high risk “normotensive” patients and for low risk “hypertensive” patients. The first group comprises individuals who are at a high risk due to a clinical manifestation of cardiovascular disease or clustering of risk factors, but whose blood pressure has not crossed the 140/90 mmHg threshold. The National Prescribing Service, as part of its MedicineWise program, and the NVDPA have addressed this group through educational programs which use case vignettes of the unexpected fatal myocardial infarction of a late middle-aged male smoker who did not have hypertension or hypercholesterolaemia (http://www.nps.org.au/media-centre/media-releases/repository/latest-program-from-nps-medicinewise-targets-blood-pressure). SPRINT reinforces the benefits of treatment in this group.

The second group comprises those (often younger) patients with mildly elevated blood pressure, who are low risk but hypertensive and for whom drug treatment is not recommended. For this group, there is a concern that such individuals may be harmed due to a delay or absence of treatment, allowing irreversible pathological damage to occur, that is, to accrue adverse legacy effects. While research in this area is ongoing and has yet to demonstrate such effects, it does contrast with another clinical concern, that of overdiagnosis.10,11 Diagnosing an individual with a medical condition has adverse effects for those who have an asymptomatic condition where intermediate benefit is very unlikely; this also has opportunity costs to society because of the misdirection of limited resources. Such individuals do not remain untreated, just unmedicated, as attention is paid to adverse health behaviours, which, when addressed, have benefits beyond the cardiovascular system. In practice, such individuals are likely to delay rather than avoid drug therapy, as age is the most important determinant of risk; however, their years on therapy will be truncated without affecting their lifespan and quality of life. Evidence suggests that reassessment of risk is not required for most low to moderate risk individuals within 8–10 years of the diagnosis, with the exception of those close to treatment thresholds, for whom annual review is recommended.12

Given the limited uptake of the absolute risk approach to date, how can we encourage its increased use? One possible way is through the Pharmaceutical Benefits Scheme (PBS). The current PBS indication for blood pressure-lowering agents is hypertension, rather than a specified blood pressure threshold. Hence, prescribing would seem to be unimpeded by the absolute risk approach, given that such a definition is likely to be deferred to expert guidelines. Cholesterol-lowering agents, on the other hand, have a complex set of criteria for eligible prescribing on the scheme that are not solely based on a single serum cholesterol threshold (http://www.pbs.gov.au/info/healthpro/explanatory-notes/gs-lipid-lowering-drugs). To advance cardiovascular health care in Australia, the NHMRC Primary Health Care Steering Group recognised that uptake of the absolute risk approach could be enhanced by changing PBS criteria for statins from these criteria to one based more simply on an absolute risk threshold.9 To this end, the NHMRC is asking the Pharmaceutical Benefits Advisory Committee to consider aligning their prescribing conditions to the NHMRC-approved absolute cardiovascular disease risk guidelines.8 This would mean that all physicians would need to become familiar with the Australian cardiovascular risk calculator in order to access statins for their primary prevention patients. Once habituated, they may be more willing and able to apply it in the setting of treating elevated blood pressure.

With benefit demonstrated at lower thresholds and to lower targets, there is a greater imperative to move away from the hypertensive model of care as these thresholds and targets approach the ideal blood pressure of 115 mmHg,13 which would capture most of the population. Taking the absolute risk route will, on the other hand, target those who have a covert cardiovascular disease most likely to manifest clinically in the foreseeable future and, therefore, benefit from pharmacotherapy.