In teaching generations of registrars, a recurring theme is the conflation of the concepts of validity and precision, resulting in an erroneous understanding of the role of statistics. In this article, we clarify the definition of these two concepts, looking at what drives these measures and how they can be maximised.
Understanding error
Clinical epidemiology is the science of distinguishing the signal from the noise in health and medical research. The signal is the true causal effect of a factor on an outcome; for example, a risk factor on a disease outcome or a medication on disease progression. The noise is the variation in the data, which has traditionally been referred to as error.
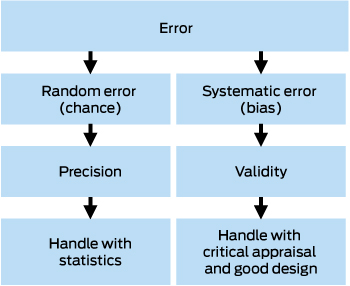
There are two types of errors: random error, also called chance or non-differential error, and systematic error, also known as differential error or bias (Box 1). Random error is the scatter in the data, which statistics uses to estimate the central or most representative point, along with some plausible range, known as the confidence interval. Increasing the sample size shrinks the confidence interval so that we have greater precision in our estimate. However, no statistical test can tell us how close that estimate is to the truth, which is a matter of validity — also known as study validity, to distinguish it from measurement validity or accuracy. Study validity can only be judged by critical appraisal of the design.
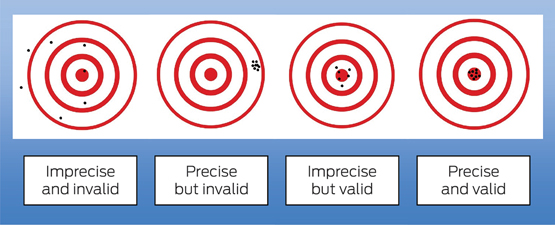
In the widely used Robin Hood analogy of precision and validity (Box 2), Robin Hood represents the researcher, and aiming the bow and arrow at the target represents the study that seeks to find the truth about some cause and effect in medicine. Each arrow fired at the target is the study results and is launched by a bow, which represents the study design. The scatter where the arrows hit the target represents the random error. Statistics can be used to analyse the random error and estimate the most representative point (ie, the effect size of the association under investigation) with its confidence interval. However, statistics do not tell us how far that estimate is from the truth (the bullseye). Systematic error (bias) in the design can be visualised as a warp in the bow (the study design), which causes the arrows to systematically hit off target, missing the bullseye. No matter how many arrows are fired (ie, large sample size) and how precise the estimate is, the estimate is still no closer to the truth.
Validity also has two components: internal validity, which is how accurate or close to the truth the result is; and external validity or generalisability, which is how applicable the result is to the population that the study is investigating.
These concepts, when understood correctly, are very powerful and can lead to some revelations:
-
large sample sizes do not ensure validity;
-
P values do not provide information about the design of a study or the validity of the result;
-
complex statistical models will not necessarily remove bias;
-
critical appraisal skills are the only way to judge validity;
-
small studies can be closer to the truth than large studies if designed better; and
-
study results may be internally valid but not generalisable.
Understanding bias
Epidemiology provides a framework to understand how a design can be biased. Since Sackett1 published his classic article naming 35 different kinds of bias, various authors have updated the list and one recent review listed 74 individual biases.2 All these biases can be classified into three main categories,2 although their use is not always consistent:3
-
selection bias, which is a warp in the way participants are identified or recruited;
-
measurement bias, which is a warp in how information is measured or collected; and
-
confounding, which is a warp in the measure of association or conclusion about causation, due to improper or incomplete analysis.
Selection bias
In general, the process by which study participants are identified or recruited will affect the external validity (generalisability) of the study, but not the internal validity. For example, a study that targets people with dementia by advertising through local media will attract those with less severe dementia (spectrum bias) or with an interest in their health and who are therefore healthier (volunteer bias). Although the results of the study may be true (internally valid) for this group of people with dementia, they may not be applicable to the wider population with more severe dementia (externally invalid).
In some cases, however, selection bias may severely affect the internal validity of the trial. Recruitment via advertising through local media excludes those who have died (survivor bias). If we are exploring the link between smoking and dementia, those who participate in the study may be selectively depleted of smokers, who are likely to die of many other causes before recruitment (eg, heart attack, stroke, chronic obstructive pulmonary disease, cancer). This may then lead to a situation where smokers are under-represented in the dementia group compared with the control population. The study would then erroneously indicate that smoking is protective for dementia, as was published in a 1991 article.4 A prospective study, which avoided survivor bias, subsequently showed the correct result: that smoking increases the risk of dementia.5
Berkson’s bias6 is another example of how selection bias can influence internal validity. In a study of the association between obesity and dementia, one might choose to identify people with dementia from hospital records. Apart from selecting those with more severe dementia, this might also create a spurious association with obesity, given that those with obesity are more likely to end up in hospital because of other health problems compared with those with dementia and no obesity.
Measurement bias
A warp may occur in how the measurements are made, whether these are measurements of the exposure of interest, the outcome of interest or another variable that could be adjusted in the analysis. This source of error will always affect internal validity and hence external validity. In the study investigating the association of smoking and dementia, we can contemplate how we measure smoking (exposure) and dementia (outcome). It is possible that participants with dementia systematically under-report their smoking due to their memory problems (recall bias), which will lead to an underestimate of the true effect or even a reversal. Alternately, a systematic bias that overcalls vascular dementia in smokers (eg, making smoking or vascular disease part of the definition of the outcome) may overstate an association with smoking where there is none in reality.
Analytical bias or confounding
Confounding is a warp in the measure of association or conclusion about causation due to improper or incomplete analysis. A confounder is a variable (or set of related variables) associated with the exposure of interest and the outcome of interest, which causes a spurious or distorted estimate of this association, without being an intermediate between the two. Whereas selection and measurement bias are handled by good design and choice of measures, confounding differs in that, if it is measured accurately, it can be handled in the analysis. As an example, in the study of the association between smoking and dementia, we can postulate a third variable, drinking alcohol, that goes hand in hand with smoking and which may actually be responsible for causing dementia. If this variable (alcohol) is not measured and included in the analysis, the effect of alcohol and smoking on dementia will be inseparable and the effect size will be falsely attributed entirely to smoking. It is in fact possible that smoking does not contribute at all to the risk of dementia but that confounding makes it appear to have an effect, or that smoking has an effect but this is overestimated or underestimated by alcohol. A future article in this series will be devoted to confounding, including relevant information on study design, measuring potentially confounding variables and adjusting for them in the analysis.
Handling selection and measurement bias
The possibilities of selection bias and measurement bias must be anticipated during the planning phase of a study. A good study design will minimise these biases to the point where they are tolerable, that is, unlikely to alter our findings to a clinically meaningful extent. When reading a study, one must make a judgement about the magnitude and direction of the bias. If the bias is likely to be towards the null, meaning that the effect size is smaller in magnitude than it is in reality, then this should be taken into account when interpreting the results. If the study shows an effect despite this bias, then the real effect must be larger and robust. If the bias is likely to be away from the null — meaning that the study will overstate the effect size — then one must be wary of the result.
Conclusion
Differentiating the concepts of validity and precision will help clinicians understand the role of statistics and the importance of critical appraisal when reading articles.

 more_vert

