×

Government targets quality in proposed PIP overhaul

The AMA has expressed concern that a proposed major shake-up of the Practice Incentives Program is not being supported by increased investment in general practice.

The Health Department has unveiled plans to “refresh” the 18-year-old PIP system by slashing the number of incentive payment categories on offer, reducing the administrative burden on practices and intensifying the focus on quality.

Under the proposal, outlined in a discussion paper released by the Department, seven existing payments covering asthma, cervical screening, diabetes, aged care access, prescribing, Indigenous health and procedural GP incentives would be axed; four existing payments, covering rural loading, after hours services, teaching and e-health – would be maintained; and a new Quality Improvement Incentive payment would be introduced.

The AMA has welcomed the increased focus on quality, and is in consultation with the Department over the proposal to collapse the PIP payment categories.

But it voiced concern that the changes were not being supported by an increase in financial support for GPs, particularly given that many practices are being pushed to the financial brink by the Medicare rebate freeze and the prospect of cuts to pathology collection centre rents.

The Department has indicated that there will be no extra money injected in the PIP scheme.

It said the quality incentive payment would be used to “give general practices increased flexibility to improve their detection and management of a range of chronic conditions, and to focus on issues specific to their practice population”.

The push to overhaul the PIP system comes at the same time the Government is launching the initial stage of its Health Care Home model of care and undertaking a comprehensive review of the 5700 services listed on the MBS.

The Department said the initiatives together would “take the health system towards services that are aligned with contemporary practice”.

The case for changes to the PIP has been mounting in recent years, with a number of organisations including the Australian National Audit Office, the Organisation for Economic Co-operation and Development and the Grattan Institute all raising concerns that the system imposed an unduly heavy administrative burden on practices and was failing to keep up with evolving health needs and priorities.

The Department said the evidence showed that many existing incentives might be no longer appropriate, and that the more could be achieved by intensifying the focus on quality, including by making better use of data.

“Redesigning the PIP would enable it to move away from process-focused funding towards a simpler system that encourages quality improvement and innovation, and allows practices to see improvements in measures that are important to them,” it said.

Precisely how this could be achieved was up for consultation and debate, the Department added.

It suggested two options. One would be to merge all five PIP items (including the new Quality Improvement Incentive) into a single payment administered by the Department of Humans Services – essentially building on and adapting existing arrangements. Eligible practices would receive sign-on and quarterly payments, to be used to make quality improvements of their choosing.

Under the second option, the Department would no longer directly fund practices. Instead, practices would use PIP funds to engage third-party providers to support their quality improvement work.

Whatever the option chosen, practices would be required to regularly share data to map quality improvements, individually, locally and nationally.

The Government is inviting submissions on the proposed PIP overhaul. The deadline is 30 November.

The Department’s consultation paper can be downloaded here.

Latest news

Gene tests on ‘don’t do’ list

Medical experts have taken aim at ‘direct to consumer’ genetic testing services amid concerns that they are causing unnecessary expense and alarm.

Medical experts have warned that patients should not initiate genetic tests on their own, particularly for coeliac disease and for the genes MTHFR and APOE, which are, respectively, associated with levels of folate and susceptibility to Alzheimer’s disease.

The Gastroenterological Society of Australia has recommended against genetic tests for coeliac disease because the relevant gene is present in about a third of the population and “a positive result does not make coeliac disease a certainty”.

Similarly, Human Genetics Society of Australasia Clinical Professor Jack Goldblatt said variants of the MTHFR gene were “very common in the general population [and] having a variant in the gene does not generally cause health problems”.

Additionally, Professor Goldblatt said that although the APOE gene was considered a risk factor for Alzheimer’s, “having a test only shows a probability, so people undertaking [the test] can also risk being falsely reassured”.

“Unnecessary genetic testing can lead to further unnecessary investigations, worry, ethical, social and legal issues,” he said. “In particular, we caution people to not initiate testing on their own. Genetic tests are best performed in a clinical setting with the provision of personalised genetic counselling and professional interpretation of test results.”

Related: Multiple gene testing: boon and dilemma

The recommendations are among 20 made by the Gastroenterological Society of Australia (GESA), the Royal Australian and New Zealand College of Radiologists (RANZCR), the Human Genetics Society of Australasia and the Australasian Chapter of Sexual Health Medicine, as part of program being coordinating by the Choosing Wisely Australia campaign to improve the use of medical tests and treatments.

The advice includes cautioning women against self-medicating for thrush, improved use of radiation therapy to treat cancer, and careful use of colonoscopies.

Professor Anne Duggan from GESA said colonoscopies had a “small but not insignificant risk of complications”, and those undertaken for surveillance placed “a significant burden on endoscopy services”.

Professor Duggan said surveillance colonoscopies should be targeted “at those most likely to benefit, at the minimum frequency required to provide adequate protection against the development of cancer”.

The RANZCR said radiation treatment was “a powerful weapon” in the treatment of cancer, and half of those diagnosed with the disease would undergo radiation therapy.

But the College advised that such treatment should be provided within clinical decision-making guidelines, “where they exist”.

In particular, it has recommended sparing use of radiation to treat prostate cancer.

Dean of the College’s Faculty of Radiation Oncology, Dr Dion Forstner, radiation oncology might not be immediately required where prostate cancer is diagnosed.

“Patients with prostate cancer have options including radiation therapy and surgery, as well as monitoring without therapy in some cases,” Dr Forstner said.

Related: The scandal of prostate cancer management in Australia

The College also advised that while whole-breast radiation therapy decreased the local recurrence of breast cancer and improved survival rates, recent research had shown that shorter four-week courses of therapy could be equally effective “in specific patient populations”. It said patients and doctors should review such options.

The Chapter of Sexual Health Medicine made several recommendations, including advising against tests including herpes serology and ureaplasma in asymptomatic patients, and the use of serological tests to screen for chlamydia, because of frequent inaccuracy and the possibility of false-positive results.

In addition, it flagged concerns about the treatment of thrush.

Chapter President Dr Graham Neilsen said it was concerning that many women with recurrent and persistent yeast infections self-administered treatment, or were prescribed topical and oral anti-fungal treatments.

Dr Neilsen said it was important that patients had “good conversations” with clinicians about appropriate care.

“It is important to rule out other causes…such as genital herpes or bacterial vaginosis, so that other infection are not left untreated,” he said. “As well as the importance of ruling out other causes before commencing anti-fungal agents, inappropriate use of antifungal drugs can lead to increased fungal resistance.”

The 20 recommendations are the latest instalment in an ongoing program, coordinated by Choosing Wisely, in which 23 medical colleges and societies are working to improve the use of tests and treatments based on the latest evidence.

The process is separate from the Federal Government’s MBS Review, which is examining all 5000 items on the Medicare Benefits Schedule.

Latest news


AMA at the table on health insurance reforms

The Federal Government continues with its reforms to health care, shifting focus to the private health sector.

Health Minister Sussan Ley has recently established a Private Health Ministerial Advisory Committee (PHMAC) to develop recommendations across a range of policy areas relevant to private health.

The PHMAC follows on the work earlier in the year of an industry working group on reforms to the Prostheses List. The Prostheses List sets out the reimbursement amounts for thousands of prostheses used in the private health system.

The Minister has announced reductions in the benefit amounts for some prostheses to support a reduction in cost to private health insurers and a consequential reduction in private health insurance premiums for consumers.

The benefits for a small number of prostheses will be reduced from February 2017, including a:

  • 10 per cent reduction across the cardiac devices category;
  • 10 per cent reduction to the ophthalmic (intraocular lenses) category;
  • 7.5 per cent reduction across the hip product category; and
  • 7.5 per cent reduction across the knee product category.

In total, these reductions are expected to deliver savings of $86 million to health funds in the first year, and $394 million over five years. The Minister has also announced moves towards a more transparent pricing model with open disclosure.

The work of the PHMAC is now underway as the second part of the reforms.

The Committee’s terms of reference include a closer examination of private health insurance (PHI) product design with simplified consumer products; standard product categories; the role of exclusions and restrictions; appropriate excess levels; and the scope of services covered by PHI.

The Committee will also look at consumer information; premium setting; second tier default benefits; risk equalization; single billing; lifetime health cover; and providing better value for rural and remote consumers.

The first meeting of the PHMAC considered some early thinking from the private health insurers on product design and a potential ‘Gold/Silver/Bronze’ product classification model.

These are all important areas for review.

The AMA has a strong interest in the work of the Committee and its outcomes.

The AMA has a commitment to a viable private health sector and sees the work of the Committee as key to strengthening the sector and maintaining its relevance and attractiveness to patients into the future.

I am representing the AMA on the PHMAC, using a reference group of senior clinicians to provide advice in the lead in to each meeting.

The AMA will make available on its website the outcomes from each meeting (which are circulated for publication).

I welcome comment and input from members. The work of PHMAC will inform the shape of private health care funding for years to come. It is important that the AMA voice is heard.

Antimicrobial use in Australian hospitals: how much and how appropriate?

Antimicrobial agents play a central role in modern health care, especially in the hospital setting. Many of the modern advances in health care such as intensive care, neonatal care, cancer chemotherapy, complex surgery and prosthetic joint replacement depend on the ongoing effectiveness of antimicrobials. However, antimicrobial resistance (AMR) has emerged in the most common and important pathogens, and as resistances have accumulated, multiresistant strains have arisen. The impact of resistance and multiresistance is being felt worldwide.1

In Australian hospitals, some multiresistant organisms were epidemic and have now become endemic in many facilities, particularly those delivering tertiary and quaternary care. Much of this resistance is driven by hospital antimicrobial use. Because antimicrobials are necessary for providing safe care in hospitals, questions arise about what factors in antimicrobial use may be adjusted in order to deliver both low levels of resistance and low prevalence of multiresistant organisms. Factors to consider include relationships between volumes of antimicrobials used and AMR; patterns of use and AMR; and appropriateness of prescribing.

The Australian Commission on Safety and Quality in Health Care (the Commission) has produced a range of resources regarding antimicrobial stewardship, now considered to be the most effective tool in promoting rational antimicrobial use. Antimicrobial stewardship is a term that describes a suite of activities designed to maximise the rational use of antimicrobials and minimise the selection pressure for AMR. In 2011, the Commission released a blueprint for antimicrobial stewardship in Australian hospitals.2 In 2012, the Commission released the National Safety and Quality Health Service Standards (NSQHSS) for hospital accreditation. Within Standard 3: Preventing and controlling healthcare associated infections3 there is a requirement for hospitals to develop and implement an antimicrobial stewardship program, and regularly review its effectiveness (Standard 3.14). Subsequently, the Commission has developed a clinical care standard for antimicrobial stewardship, designed to provide a basic set of nine standards that prescribers of antimicrobials should follow.4

In 2013, the Commission also commenced the task of coordinating the development of a national surveillance system for antimicrobial resistance and antimicrobial use — the AURA (Antimicrobial Use and Resistance in Australia) project (http://www.safetyandquality.gov.au/national-priorities/amr-and-au-surveillance-project). Two key elements of the system are passive and targeted surveillance of antimicrobial use in hospitals. In this context, passive surveillance refers to the collation of data primarily collected for other purposes (such as pharmacy dispensing data), while targeted surveillance refers to data gathered for a specific purpose — for example, data on appropriateness of prescribing and compliance with guidelines.

The AURA project was in a good position to develop both of these types of surveillance by building upon existing initiatives. The National Antimicrobial Utilisation Surveillance Program (NAUSP), established in 2004 and funded by the Australian Government Department of Health, forms the basis of the passive antimicrobial surveillance. The program built on a South Australian initiative to incorporate data from other Australian states. Targeted surveillance is based on the National Antimicrobial Prescribing Survey (NAPS), a 2011 initiative of clinicians at Royal Melbourne Hospital to establish a national auditing tool for hospital stewardship teams to use in assessing appropriateness of prescribing in their own hospitals using published methodology.5 This has matured into an online tool that was rolled out nationally in 2013. Although both programs are built on voluntary participation (there are currently no mechanisms available to mandate participation), by 2014 NAUSP had 129 participants and NAPS had 248 participants.

Data sources and representativeness

The data presented here are from the 2014 NAUSP report6 and the 2013 and 2014 NAPS reports.7,8 All these results must be interpreted with caution, given the voluntary nature of participation in the programs.

We examined the representativeness of participation in both programs in 2014 using the data provided in the Australian Institute of Health and Welfare (AIHW) publication on hospital peer groups in November 2015, to which we added two hospital sites that had provided data in 2014 but did not appear on the AIHW list.9 Of the 748 public hospitals in Australia, the NAUSP program collected data from 14.8%, and the NAPS program collected data from 26.3%. The percentages from the 497 private hospitals were 3.6% and 10.3% respectively. The Northern Territory did not provide usable data to NAUSP in 2014. In addition, NAUSP did not collect data from children’s hospitals (see below). Participation was greatest from principal referral hospitals, and public and private acute hospitals in groups A and B of the AIHW peer group list; NAUSP collected data from 61.0% of 195 hospitals in these categories, while NAPS also collected 61.0%; of these 45.1% were in common. The majority of participants were from remoteness groups “major city” and “inner regional” (93.0% for NAUSP and 76.0% for NAPS), reflecting the availability of resources in larger/hospitals and centres. Overall, 92 hospitals contributed data to both programs in 2014. A more detailed analysis of representativeness is given in Supplementary Tables S1–S3 in the Appendix at mja.com.au. Information on the types of data collected in each program, including their limitations, is given in the volumes of use and appropriateness sections below. The imbalances created by voluntary participation are found in these tables.

Volumes of antibacterial use, including variations and trends

NAUSP collects data from public and private hospitals, excluding paediatric hospitals and paediatric wards. These exclusions are because there is no internationally agreed measure equivalent to that used for adults, namely defined daily doses (DDD) per 1000 occupied bed days (OBD). It reports on use of antibacterials, but not antifungals or antiviral agents, dispensed to adult, acute care inpatient wards and emergency departments. Data from psychiatric services, rehabilitation, dialysis and day surgery units are not included in order to align with international definitions of somatic care, and outpatient data are also not included. The data also exclude most topical formulations, as well as antimycobacterials (except rifampicin) and antimicrobials prepared as infuser packs. NAUSP undertakes data validation at the time of receipt, including outlier detection. All suspect data are queried with the relevant participant, and corrections made if errors are confirmed.

Across all Australian hospitals participating in calendar year 2014, the total aggregate use rate of systemic antimicrobials was 936 DDD/1000 OBD, ranging from a low of 330 to a high of 2040 DDD/1000 OBD — more than a sixfold difference. The overall rate compares with 597 DDD/1000 OBD in Sweden,10 747 DDD/1000 OBD in the Netherlands,11 and 944 DDD/1000 OBD in Denmark.12 These are the only countries currently publishing comparable data.

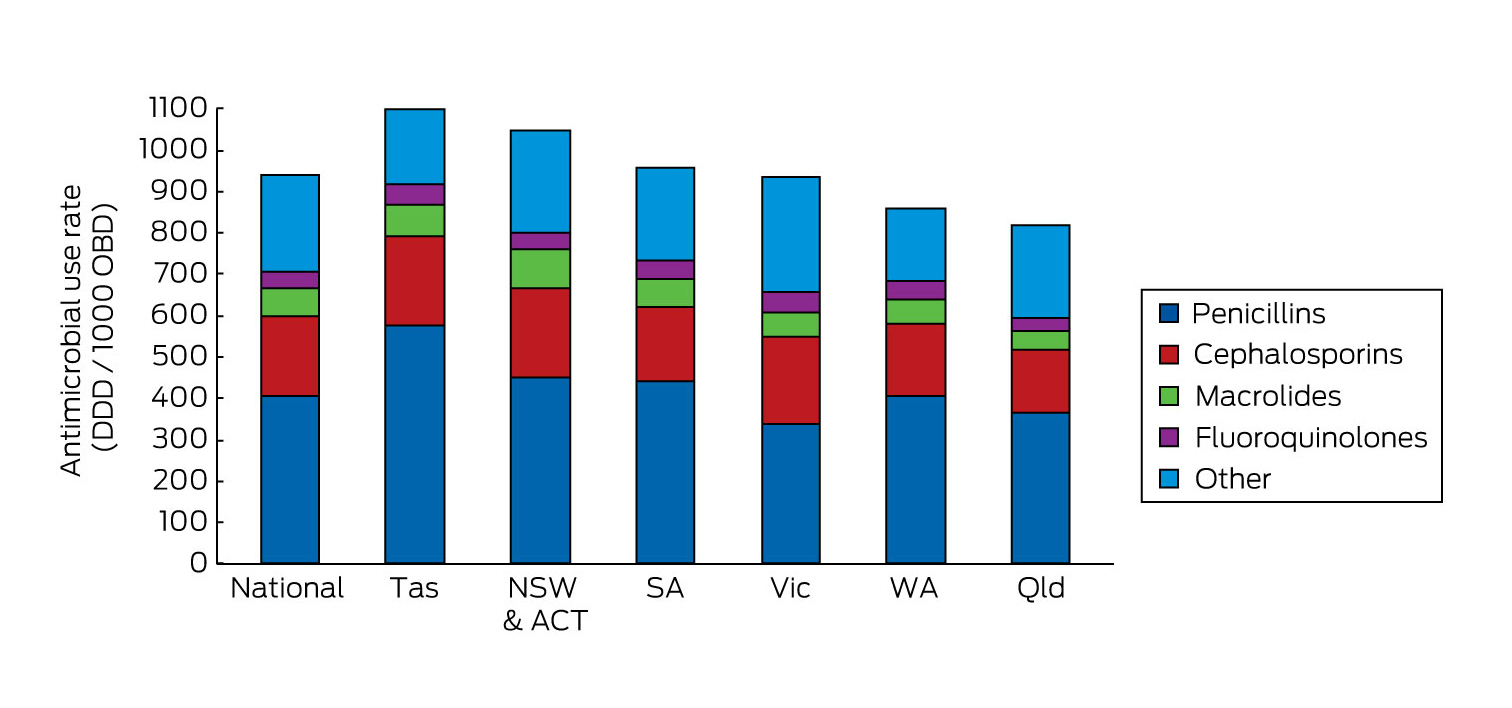
There were noticeable variations between states (Box 1), the highest rates being in Tasmania. The reasons for such variations are not clear. While there is likely to be less antimicrobial use in small states and territories due to lack of availability of highly complex interventions, this would not seem to account for the pattern observed. Higher use in Tas may have been related to statewide adoption of combination narrow spectrum antimicrobials for urinary and intra-abdominal infections (eg, amoxicillin + gentamicin + metronidazole = 10–12 DDD compared with ceftriaxone + metronidazole = 2 DDD). Imbalances in representativeness between states (see Supplementary Table S2 in the Appendix at mja.com.au) are also likely to have contributed to the variation, although even greater variation has been observed nationally between hospitals in the same peer group.13

There is also some variation in use related to hospital type. Using the new peer group classification of public hospitals promulgated by the AIHW,9 aggregate rates of usage in principal referral hospitals in 2014 were 927 DDD/1000 OBD (range, 544–1511), 985 DDD/1000 OBD in large public acute hospitals (range, 451–2050), and 872 DDD/1000 OBD in medium public acute hospitals (range, 504–1345). This variation was different to what might have been expected, given the assumption that principal referral hospitals would have the most complex patients and procedures and therefore require the highest antimicrobial use. This may also be a reflection of the presence of more mature stewardship programs in principal referral institutions.

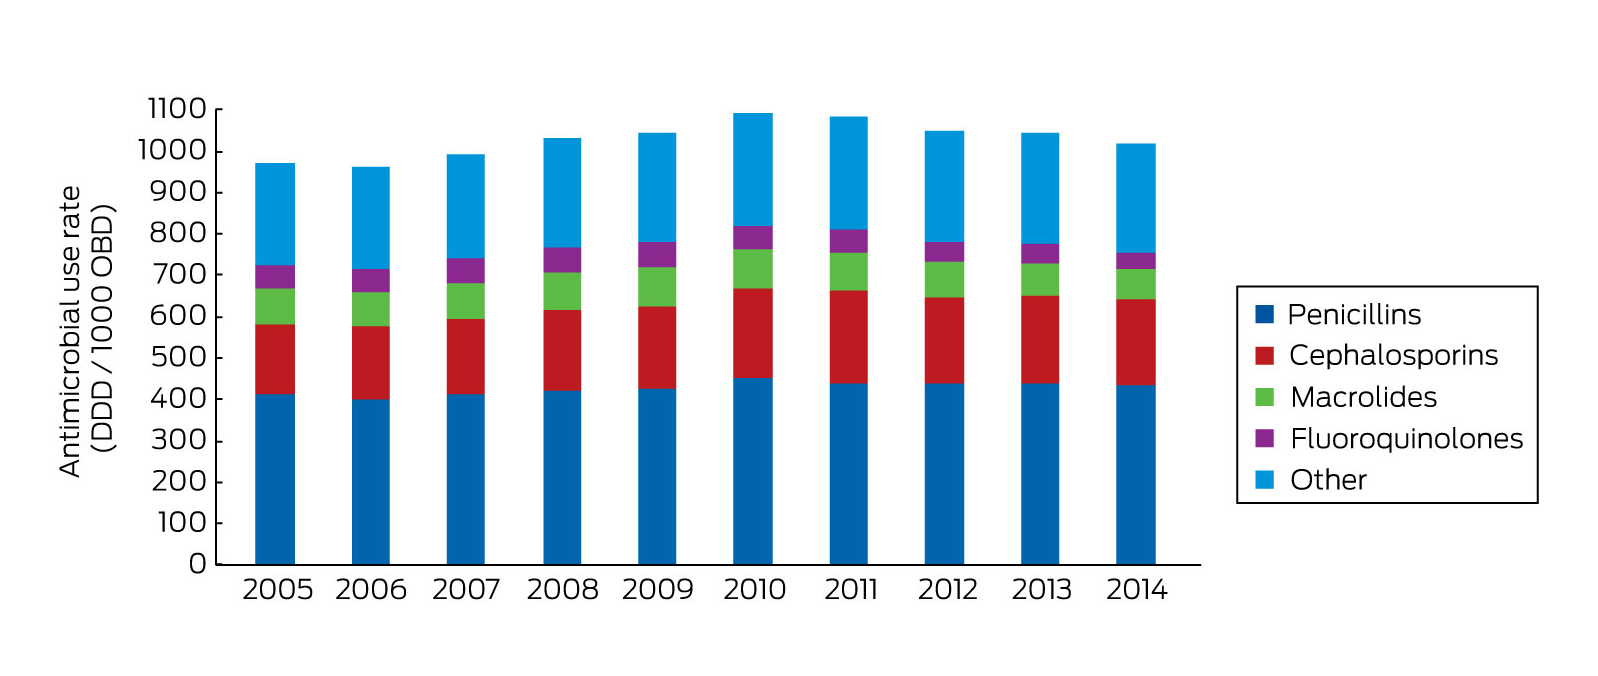
Box 2 shows usage rates of the various classes of antimicrobials over the ten years to 2014. There has been a steady decline in total usage nationally since 2010. Some of this can be attributed to the increasing numbers of smaller institutions joining the program, but it is thought that at least some part of the reduction can be attributed to an increasing focus on antimicrobial stewardship. During the period from January to December 2014, the aggregate antibacterial usage rate for all participants (n = 129) was 936 DDD/1000 OBD (Box 2). Compared with a rate of 961 DDD/1000 OBD for the previous year (n = 113), this represents a 2.6% decrease. Excluding the new participants, the decrease was still 1.6%.

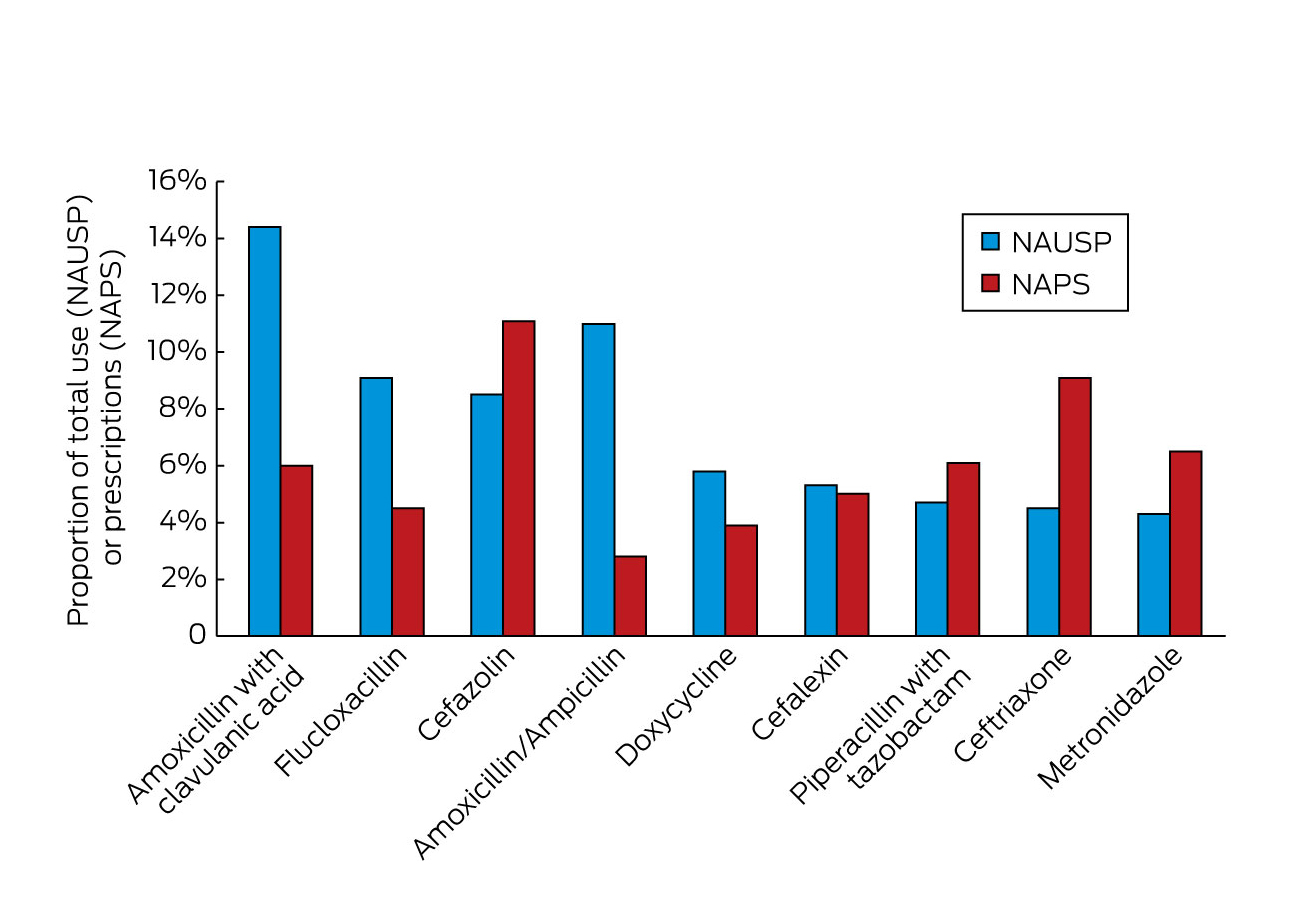
The most commonly prescribed antibacterials in Australia are shown in Box 3 as a percentage of all use or prescriptions. The differences in data collection methods between NAUSP and NAPS mean that there are differences in many of the percentages: NAUSP captures all use throughout the year and provides output as a percentage of total DDD/1000 OBD. NAPS output is cross-sectional data at a point in time or over a short time interval. Hence, agents such as cefazolin, which is prescribed frequently but often for very short durations, features prominently in NAPS, but less so in NAUSP. Of note is the significant proportion of use/prescriptions for ceftriaxone (4.5% in NAUSP and 9.1% in NAPS), an agent that many antimicrobial stewardship teams would consider should be reserved for specific indications and should only be prescribed with stewardship team approval.

Appropriateness of antimicrobial use, including variations

The principal aim of the NAPS tool is to provide data to antimicrobial stewardship teams on the rates of appropriate use and compliance to guidelines in their own hospitals. The stewardship teams are able to use the data to identify local issues and prioritise their stewardship activities. The utility of the online collection and storage of data allows individual teams to compare themselves with their peers, and provides the opportunity to gain better insight into national and regional rates. Participation is voluntary, but has been significantly boosted by the release of Standard 3.14 in the Commission’s hospital accreditation standards. Participation resource requirements are significantly lower than for NAUSP, because NAPS surveys are conducted annually, largely as a point prevalence survey to coincide with antimicrobial awareness week in November. The survey methods have been developed to support hospitals of all sizes and complexity, so that point prevalence surveys (single and repeated), period prevalence surveys, and random patient selection surveys are all available to hospitals. Benchmarking is only available for point prevalence and random selection surveys. The NAPS tool has been developed using published methods5 modelled on those developed and applied in Europe,14 and which are now being applied internationally.15,16

To ensure data validity, participants are required to follow a structured assessment guide. In addition, training is provided to all participants and phone advice is offered by the NAPS team for participants who have uncertainties or questions about specific prescriptions. To reduce the impact of lack of expertise in sites that do not have direct access to expert advice from infectious diseases physicians or microbiologists, remote support is provided by skilled antimicrobial stewardship personnel.17 The validity of this approach has been reinforced by the consistency of findings between the years 2013 and 2014 (Box 4). In 2014, 248 hospitals participated, including 197 public hospitals (26.3% of all public hospitals in Australia) and 51 private hospitals (10.3%). This was a 64% increase on the number of participants in the previous year. The most popular method, a whole-of-hospital point prevalence survey on a single day, was conducted by 42.3% of participants, followed by a whole-of-hospital repeated point prevalence survey (with the time between surveys varying from consecutive days to several months) by 28.6%. Together, these two methods accounted for 70.9% of hospitals but 79.9% of all prescriptions reviewed. The remaining 29.1% of hospitals chose to survey selected wards or specialties, collected a random sample, selected antimicrobials or indications, or used other methods. The total number of prescriptions reviewed by all hospitals was 19 994. The variation in data collection methods means that the data presented here should be considered at best indicative.

Box 4 shows the overall findings for the key indicators of appropriateness and compliance with guidelines, comparing results from 2014 with those found in 2013. For these indicators, all participants were provided with standard recommendations for assessing appropriateness, and the Therapeutic guidelines: antibiotic18 or locally developed guidelines/protocols were used to judge compliance. Best practice rates for some of these indicators were included. Among the results were:

  • Only 74% of prescriptions had an indication documented in the medical record (best practice, >95%). If prophylaxis indications were excluded, that figure rose to 79.2%.

  • The prescription was considered inappropriate in 24% of cases where a satisfactory assessment of the prescription could be made.

  • Non-compliance with guidelines was detected in 26% of cases where compliance was assessable.

In 2014, there were some differences between states in rates of appropriate prescribing, with the Australian Capital Territory having the lowest rate (68.2%) and Queensland the highest (79.2%). Similarly, rates of compliance with guidelines had differences across states, with ACT having the lowest 65.2% and Queensland the highest (72.5%). There was little variation in rates of appropriate prescribing across hospital peer groups, but there was a tendency for compliance with guidelines to be lower in smaller hospitals. Remoteness had little impact on either appropriateness or compliance with guidelines. Rates for both were slightly lower in private hospitals (75.1% and 65.2% respectively) compared with public hospitals (77.2% and 70.6% respectively).8

A notable finding was the frequency with which surgical antimicrobial prophylaxis was administered for more than 24 hours. For most surgical procedures where antimicrobial prophylaxis is warranted, a single dose of the agent at the time of skin or mucosal incision, or less than 1 hour before the procedure, is known to be adequate.18 In 2013, more than 40% of surgical prophylaxis courses lasted longer than 24 hours, falling to 36% in 2014. The findings of the 2014 survey also identified that surgical prophylaxis was not indicated at least 20% of the times that it was prescribed.

Antimicrobial agents that are often used as directed therapy, for instance flucloxacillin for staphylococcal infection, or antimicrobials prescribed as part of treatment protocols for cancer chemotherapy, tended to have high rates of appropriate use in 2014. For prescriptions that could be adequately assessed, five antimicrobials (cefalexin, amoxicillin–clavulanate, azithromycin, cefazolin and ceftriaxone) all had rates of inappropriate use above 30%, with that for cefalexin exceeding 40%.

Apart from surgical prophylaxis as discussed above, the other notable condition for which antimicrobials were frequently prescribed inappropriately in 2014 was infective exacerbations of chronic obstructive pulmonary disease, with a rate of appropriate prescribing of only 62%. For the latter condition, appropriate prescribing involves the use of oral amoxicillin or doxycycline, and not broader spectrum or intravenous antibacterials.

Possible areas for action and intervention

Despite the voluntary nature of participation in the NAUSP and NAPS, a picture of antimicrobial practices in Australian hospitals is now emerging from these datasets. Before the emergence of these programs, there was no information about antimicrobial use across Australia. The datasets indicate that there are major opportunities for improvement for antimicrobial stewardship programs, and provide strong evidence for their introduction in hospitals where stewardship systems have not yet become established,. Stewardship programs should focus on the implementation of the Antimicrobial Stewardship Clinical Care Standard,4 and also ensure that prescribers have access to treatment guidelines, especially the national Therapeutic guidelines: antibiotic.18

The most important benefits of NAUSP and NAPS are that they provide stewardship programs with the capacity to benchmark and identify issues peculiar to their own institution. This greatly assists in directing efforts to the areas of greatest need at the local level. Nevertheless, NAUSP has identified high rates of use across Australia (57% higher than Sweden for example), albeit with a trend downward. NAPS is the only published antimicrobial prescribing survey that includes appropriateness of use as a composite measure of prescribing quality. This is important because clinical guidelines cannot cover all aspects of empirical and directed therapy. Recent reports show that the number of hospitals participating in NAPS well exceeds those participating in point prevalence surveys in other countries.15,16 Further, NAPS has identified major areas for intervention, such as the appropriate use of surgical prophylaxis, and prescribing for infective exacerbations of chronic obstructive pulmonary disease. The Commission believes that surgical prophylaxis is worthy of a national approach and has contacted several peak bodies such as the Royal Australasian College of Surgeons to drive improvements in this area.

The adoption of the NSQHSS has provided a significant boost to participation in NAUSP and NAPS. Stewardship programs are now able to compare their performance with overall use and prescribing practices. The findings of these two programs are already generating benefits for the participants. However, participation is still voluntary. Ultimately, all hospitals will be required to generate data of this kind for accreditation against Standard 3 of the NSQHSS. Participation in these national programs will be a simple method for them to achieve this.

The voluntary nature of participation in these programs has necessarily created imbalances in participation between hospital types and jurisdictions. Participation requires time and effort from hospital pharmacists, including stewardship pharmacists, infectious diseases physicians, microbiologists and often infection control staff and other nursing staff. Hospitals vary greatly in their size, throughput and resources (see separation rate variation in Supplementary Table S1 in the Appendix at mja.com.au). In some circumstances, particularly in outer regional and remote areas, pharmacy services are delivered offsite, and the hospital does not have access to the data required for NAUSP participation. Nevertheless, the Commission will continue to promote participation in both programs for all hospitals because the principles of antimicrobial stewardship apply everywhere that antimicrobials are used.

Both NAUSP and NAPS have identified specific issues and gaps in their data collection. For NAUSP, the single most important issue is the measure used — DDD/1000 OBD. While this measure is suitable for international comparisons, there are a number of instances where the internationally agreed DDD does not concur with the most commonly prescribed daily dose in Australia. Another important issue is the lack of DDDs for children, leading to underreporting of total volumes of use in the paediatric population. Moreover, generating totals for antimicrobials does not reveal how many patients are exposed to antimicrobials during their stay. This is likely to be a more relevant measure of selection pressure for antimicrobial resistance. The NAPS data are also vulnerable to the level of expertise of the participants in assessing appropriateness of use and compliance with guidelines, although, as noted above, strenuous efforts are being made to overcome this problem. Ultimately, all participants will be trained and skilled to undertake these surveys. As the AURA project moves from establishment to maintenance, it will be necessary to fill in the gaps and solve the issues found in both programs, as well as to encourage both ongoing and increased participation.

The building of workforce capacity and competence to undertake antimicrobial stewardship is an essential requirement to meet the objectives of the National Antimicrobial Resistance Strategy.19 The evolution of pharmacy and clinical information systems, and the introduction of electronic medical records and electronic medicines management, will improve data capture and interpretation for NAUSP and NAPS significantly and will enhance the quality of data contributing to national surveillance of antimicrobial use.

Box 1 –
Total hospital antibacterial use by state (all NAUSP hospitals, all antibacterial classes), 2014*


DDD = defined daily doses. NAUSP = National Antimicrobial Utilisation Surveillance Program. OBD = occupied bed days. * Northern Territory did not provide usable data in 2014.

Box 2 –
Total hospital antibacterial use by year (all NAUSP hospitals, all antibacterial classes)


DDD = defined daily doses. NAUSP = National Antimicrobial Utilisation Surveillance Program. OBD = occupied bed days.

Box 3 –
Top ten antimicrobials in 2014 — proportion of total use (NAUSP) or prescriptions (NAPS)


NAPS = National Antimicrobial Prescribing Survey. NAUSP = National Antimicrobial Utilisation Surveillance Program.

Box 4 –
Results of key indicators in 2013 and 2014 for all participating hospitals8

Key indicator

% of total prescriptions


% change from 2013

2013

2014


Indication documented in medical notes (best practice, > 95%)

70.9

74.0

+ 3.1

Appropriateness

Appropriate (optimal and adequate)

70.8 (75.6)*

72.3 (75.9)*

+ 1.5

Inappropriate (suboptimal and inadequate)

22.9 (24.4)*

23.0 (24.1)*

+ 0.1

Not assessable

6.3

4.7

– 1.6

Compliance with guidelines

Compliant with Therapeutic guidelines: antibiotic18 or local guidelines

59.7 (72.2)

56.2 (73.7)

– 3.5

Non-compliant

23.0 (27.8)

24.3 (26.3)

+ 1.3

Directed therapy

na

10.4

na

No guideline available

11.0

4.6

− 6.4

Not assessable

6.3

4.5

− 1.8

Surgical prophylaxis given for > 24 hours (best practice, < 5%)

41.8

35.9§

− 5.9


na = not applicable * Figures without parentheses apply to all prescriptions. Figures in parentheses apply to prescriptions where appropriateness was assessable (12 001 prescriptions in 2013; 18 998 prescriptions in 2014); the denominator excludes antimicrobial prescriptions marked “Not assessable”. † Figures without parentheses apply to all prescriptions. Figures in parentheses apply to prescriptions where compliance was assessable (10 599 prescriptions in 2013; 15 899 prescriptions in 2014); the denominator excludes antimicrobial prescriptions marked “Directed therapy”, “Not available” or “Not assessable”. ‡ Introduced in the 2014 survey as a new classification category. § Where surgical prophylaxis was selected as the indication (2785 prescriptions).

Clinical care standards: appropriate care everywhere — acute coronary syndromes as an example

Australian practice data from clinical audits and other research have clearly shown that dissemination of high quality clinical practice guidelines is not enough to ensure everyone with a particular clinical condition receives appropriate care.13 Even for clinical conditions with established networks of care, such as acute coronary syndromes (ACS), variations in care persist, not all of which can be explained by patient needs or preferences. In this article, we explore the features and underlying principles of clinical care standards (looking at the example of ACS) and the improvements in delivery of appropriate care that a clinical care standard may help to make.

The National Health Reform Agreement signed by the Council of Australian Governments in 2011 (http://www.federalfinancialrelations.gov.au/content/npa/health/_archive/national-agreement.pdf) determined that clinical standards would be developed by the Australian Commission on Safety and Quality in Health Care (the Commission) to help ensure appropriateness of care for specific clinical conditions nationally. Clinical care standards are small sets of concise recommendations (quality statements) that focus on specific gaps in evidence-based practice for a clinical condition. Their aim is to drive delivery of appropriate care, reduce unwarranted variation and to promote shared decision making between patients, carers and clinicians.

What’s different about a clinical care standard?

Unlike a clinical practice guideline, a clinical care standard is not a comprehensive management guide. Instead, it targets areas of care where both divergence from evidence and the opportunity for improvement are greatest. In collaboration with a working group of clinicians, researchers, health care organisations and consumers, the Commission uses practice data to identify key areas for improvement, which become the focus of each quality statement.

Clinical care standards are developed using a process designed to optimise the uptake and reach of the care they describe. First, each topic requires the agreement of representatives of state and territory health departments. Second, before public consultation, the draft standard is considered by representatives from private and public health sectors. Third, each draft is released for broad public consultation, with feedback sought from all levels of the health system as well as from key organisations. Finally, before it is released, the standard is submitted to the Australian Health Ministers Advisory Council and then to Australian Health Ministers. This highly collaborative and consultative method of development not only assists in ensuring the relevance of the standard to the health care system but builds engagement of both clinical and policy decision makers at multiple levels within the system. In prompting review of existing initiatives, the standard acts as a focus for integrated whole-of-system efforts to improve the quality of care.

Putting patients at the centre of care is an integral part of clinical care standards and is ensured in several ways:

  • the quality statements are written from the patient’s perspective, describing the care that patients can expect to be offered by the health care system;

  • a consumer fact sheet accompanies each standard describing in lay terms what the quality statement means; and

  • the standards align understanding and expectations of patients, clinicians and health services about what good care is, how it should be delivered, and what needs to be put in place to ensure it happens.

Indicators are an important part of implementation support for each clinical care standard. Each standard has a set of indicators for local use by health services to monitor adherence and to identify areas for improvement. The National Stroke Foundation’s 2015 national audit recently showed how the process indicators from a standard can be used to track performance over time.2 The indicators can also be used by health services to show they are providing high quality evidence-based care, a requirement of the National Safety and Quality Health Service Standards.4 The indicators are not mandatory, as some services may have other measures in place to demonstrate they are delivering the care described within a standard.

Australia is the second country to develop national clinical standards. In 2009, the National Institute for Health and Care Excellence (NICE) established a program to develop quality standards across health care, public health and social care, for use in England. As of December 2015, NICE had developed over 100 quality standards. The Commission’s Clinical Care Standard program began in 2013. Standards on ACS, antimicrobial stewardship, acute stroke, delirium and hip fracture care have been released. Standards for osteoarthritis of the knee and heavy menstrual bleeding are under development.

Improving care for patients with acute coronary syndromes

The ACS Clinical Care Standard was developed to address substantial heterogeneity in the use of treatments known to reduce risk of cardiac events, which could not be explained by clinical complexity or patient needs.1 Research into the sources of this variation offers insights into potential targets for improving ACS care throughout Australia, and was used to inform the quality statements of the Standard (Box 1).

Practice-related factors

Translation of knowledge into practice has been identified as a major practice-related issue affecting quality of ACS care.6 In a 2009 survey, Australian clinicians reported high levels of agreement with, and adherence to, the existing (2006) ACS guidelines. However, these views correlated poorly with observed practice, with often striking overestimation by clinicians of their use of treatments recommended in the guidelines.6

Clinician misperception about patient risk of recurrent cardiovascular events and uncertainty about applying evidence for patients with complex clinical needs appear to be contributors to the variation. Cardiovascular risk stratification is a critical decision point in the appropriate provision of cardiac care. Compared with assessment using validated cardiovascular risk tools, clinical intuition more frequently overestimates the risk for low risk patients and underestimates that for high risk patients.7,8 Underappreciation of cardiovascular risk is worse for females with myocardial infarction (MI) than for males with MI and is associated with delays in providing invasive management, lower use of evidence-based drugs and an increase in the risk of late mortality.9

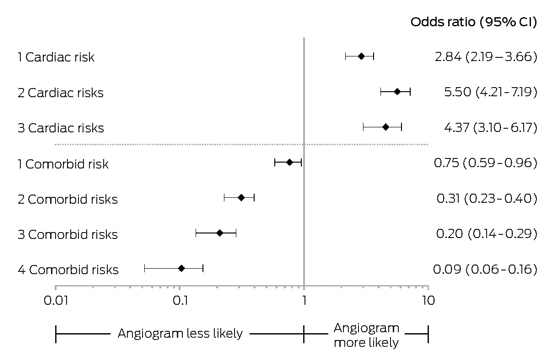
Even when risk is accurately estimated, challenges remain in applying the ACS evidence base among patients with complex clinical needs. Australian data show that patients with comorbidities are less likely to receive evidence-based treatments than patients at the same level of cardiovascular risk without comorbidities.10 Age and clinical comorbidities, such as prior cerebrovascular disease, lung disease and impaired renal function, elevate the risk of adverse events from invasive management (eg, reperfusion) and cardiovascular therapies (eg, antiplatelet drugs). However, the marked divergence in care for these patients suggests that intervention-related risks are not being objectively weighed up against treatment benefits (Box 2).10

Risk stratification and discussion of these risks and the benefits of coronary angiography for non-ST-segment-elevation ACS are the focus of quality statements 4 and 5 of the Standard (Box 1).

System factors

There are several important system-related contributors to ACS practice variation. The absence of systematic processes to improve the timely provision of reperfusion in ST-segment-elevation MI (STEMI) results in longer “door to balloon time” and is associated with increased rates of mortality and recurrent MI.11,12 In a survey of 35 hospitals examining implementation strategies for reducing time to reperfusion, those with at least one strategy delivered reperfusion on average 21 minutes faster than those without any strategy, and this was associated with a reduced rate of 12-month death or MI (12.8% v 22.1%, respectively; P = 0.006).12

The need for systematic processes to improve the timeliness and accuracy of diagnosis is highlighted in quality statements 1 and 2 of the Standard; quality statement 3 focuses on systems to support the timely provision of reperfusion (Box 1).

The vastness of Australia’s geography and the nation’s cultural diversity are both possible contributors to ACS practice variation and to patient outcomes. Mortality and complication rates due to MI are higher in rural and regional areas than in metropolitan areas;1,13 lack of access to clinical expertise and to timely invasive management for non-ST-segment-elevation ACS may contribute to variation in these areas of care.14 Variation in prescription of secondary prevention medications and lifestyle modifications, and in the engagement of patients to adhere to them, are likely to be particularly challenging gaps to address in the diverse demographic profile of modern Australia, yet they are important targets for well-designed interventions.

Quality statement 6 of the Standard focuses on use of an individualised care plan to improve the transition of care, including the ongoing need for secondary prevention measures (Box 1).

Impact of reducing variation

Attempts to estimate the impact of quality initiatives suggest there are substantial gains associated with making system-wide improvements to ACS care.15 Several observations are worth highlighting:

  • The gains to be had from rectifying omissions of care (eg, missed opportunities in timely reperfusion) far exceed the benefits to be gained from choices between therapies (eg, immediate fibrinolysis versus transfer for percutaneous coronary intervention in STEMI).

  • Improving the application of secondary prevention therapies is likely to have a much greater impact on late clinical outcomes than a focus on invasive management.

  • The incremental benefit of new treatments and strategies applied to patients who are already optimally treated is relatively small and is dwarfed by the gains to be had for all by small improvements in the delivery and reach of evidence-based care across the whole system.11,12

Economic evaluation of strategies to improve the quality of ACS care in Australia are limited. Yet the fact that half of all cardiovascular events occur in patients with prior documented coronary artery disease, and that the estimated yearly costs of MI to the Australian community is $1.14 billion dollars, suggests that even modest systems improvements in ACS care are likely to be highly efficient.16

Efforts to redesign the provision of care in various parts of Australia have been promising, showing meaningful improvements in patient outcomes. For example, several health networks have sought to move the identification of STEMI into the ambulance, through the transmission of initial echocardiographic data to the emergency department, ensuring patients are brought to hospitals with appropriate clinical teams and facilities, as well as shortening the time to response when these teams are on remote call.17,18

Similarly, clinical networks that provide remote clinical support combined with access to metropolitan-based invasive services have been shown to reduce heterogeneity in clinical care and improve short term outcomes for patients residing in rural areas.14

Complementary to these initiatives, approaches to secondary prevention that embrace the individuality of patient needs and tailor education and care to these have shown significant promise in improving adherence, as well as the achievement of risk factor targets known to lower overall risk of future cardiovascular events.19,20

The uptake of the ACS Clinical Care Standard is not yet known, and neither is that of the UK’s corresponding quality standard, also released in 2014. However, substantial improvements in the care and survival for older people with hip fracture in England have been attributed to initiatives underpinned by a national clinical standard, including a national registry to support audit and feedback, and a financial incentives program.21 In December 2014, NICE reported on the uptake of 28 published quality standards. While data were limited, uptake of care could be tracked over time for many quality standards using selected process indicators.22

What the ACS Clinical Care Standard adds

The ACS Clinical Care Standard is a significant step forward in supporting clinicians and health services to realise all of the gains promised by the ACS evidence base.23 It focuses on the areas of care that are known to be most associated with variation in outcome. It supports patient involvement in critical decisions that affect their care, refocuses clinicians on the priority areas of ensuring appropriate ACS care, and informs health services about the systems required to deliver evidence-based care. The revised ACS clinical practice guidelines released in August 2016 remain consistent with the ACS Clinical Care Standard and specifically support its use for quality improvement.24

Ensuring effective and equitable care of patients with ACS across Australia is complex. For the first time, a common vision for care of patients with ACS provides an opportunity for alignment and coordination of local, state and national efforts to improve consistency of care. In doing so, the ACS Clinical Care Standard may just represent the keystone for evidence translation in Australian ACS care.

Box 1 –
Acute Coronary Syndromes Clinical Care Standard5

  1. 1. A patient presenting with acute chest pain or other symptoms suggestive of an acute coronary syndrome receives care guided by a documented chest pain assessment pathway.
  2. 2. A patient with acute chest pain or other symptoms suggestive of an acute coronary syndrome receives a 12-lead electrocardiogram (ECG) and the results are analysed by a clinician experienced in interpreting an ECG within 10 minutes of the first emergency clinical contact.
  3. 3. A patient with an acute ST-segment-elevation myocardial infarction (STEMI), for whom emergency reperfusion is clinically appropriate, is offered timely percutaneous coronary intervention (PCI) or fibrinolysis in accordance with the time frames recommended in the current National Heart Foundation of Australia/Cardiac Society of Australia and New Zealand Guidelines for the management of acute coronary syndromes.In general, primary PCI is recommended if the time from first medical contact to balloon inflation is anticipated to be less than 90 minutes, otherwise the patient is offered fibrinolysis.
  4. 4. A patient with a non-ST-segment-elevation acute coronary syndrome (NSTEACS) is managed based on a documented, evidence-based assessment of their risk of an adverse event.
  5. 5. The role of coronary angiography with a view to timely and appropriate coronary revascularisation is discussed with a patient with a non-ST-segment-elevation acute coronary syndrome (NSTEACS) who is assessed to be at intermediate or high risk of an adverse cardiac event.
  6. 6. Before a patient with an acute coronary syndrome leaves the hospital, they are involved in the development of an individualised care plan. This plan identifies the lifestyle modifications and medicines needed to manage their risk factors, addresses their psychosocial needs and includes a referral to an appropriate cardiac rehabilitation or another secondary prevention program. This plan is provided to the patient and their general practitioner or ongoing clinical provider within 48 hours of discharge.

Box 2 –
Impact of cardiac risk and comorbid risk on the likelihood of angiography in acute coronary syndromes10

English lessons: can publishing an atlas of variation stimulate the discussion on appropriateness of care?

Health systems around the world are facing the twin pressures of increasing demand for services, caused by the impact of ageing populations and medical science developments, and a lack of resources as a consequence of economic slowdown in many countries.1 In these circumstances, it should not be surprising that there is an increased focus on using available resources to deliver high quality care and addressing variation in the provision, uptake and costs of health care2 with a view to identifying and reducing unwarranted variation.

The ubiquity of recognition of variation35 continues to raise the profile of variation, capturing the imagination of researchers and policy makers6 to pose a challenge to those planning and delivering health care. That challenge runs much deeper than the undemanding observation and recording of variation, to one which must stimulate clinicians, managers and patient groups across the health care system into urgent and necessary action to identify and reduce unwarranted variation. That action is essential, not only as a means of enabling the health care systems to close their funding shortfalls, but more importantly to reduce harm to patients, improve the quality of services and increase value from resources. This is the focus of the NHS Right Care initiative (www.rightcare.nhs.uk) and the genesis of the NHS Atlas of Variation series in England.

The NHS Atlas of Variation series

The NHS Atlas series is a comprehensive view of health care from a geographic perspective, principally using formal NHS administrative organisations to measure a range of indicators including spend and outcomes. The work to produce the NHS Atlas series was greatly influenced by the philosophy and experience of Professor John Wennberg of Dartmouth College in the United States, who knew the full impact of publishing variation and the concept of unwarranted variation, which he defined as “variation in the utilization of health care services that cannot be explained by variation in patient illness or patient preferences”.7

The first Atlas was produced in 2010, and was followed by a series of themed Atlases and two other compendium Atlases (Box 1). NHS England is not alone in producing an atlas of variation; a number of other countries are following the lead from America, Canada and Spain, including Australia, Germany, the Netherlands, Norway and New Zealand.

Preparation phase

There are as many lessons to learn from the pre-publication phase of the Atlas series as there are in the post-publication phase. The first lesson is the need for engagement and sponsorship from the very “top of the office”, from both policy makers and senior clinicians. That support is critical to the credibility and sustainability of Atlas production and necessary to mitigate any undue political or managerial interference regarding the main purpose of the Atlases. The Atlas editorial team was convinced that the publication of the Atlas series was much more than just about assisting the NHS deal with the increasing need and demand, which is rising faster than the resources available or the political challenges of the day; namely, meeting targets too frequently designed around organisational objectives not patient need. As important as they may be, it was considered that the publication of the Atlas series is an essential process to jolt the culture of health care away from assuming that existing patterns of care are right and that more resources are always required to improve outcomes. We knew that the culture of the medical and nursing professions, and the behaviours within the NHS, would need to change. The Atlases were designed for emotional impact as well as the transmission of information to prompt all clinicians in primary and secondary care to work together with their population to agree what services should look like, what needs to stop and what services need to start doing to provide higher value health care.

The second lesson from this phase is to remember that the purpose of sharing data on variation is not to claim what is the right or wrong rate of, say, an intervention, but to stimulate the discussion and to prompt the search for unwarranted variation, where resources are being wasted and shift those resources to more appropriate care where patients and the population achieve better outcomes. Indeed, we are reminded that it is not right to use variation data alone to determine which rate is “right” but should acknowledge that the presence of too much variation is a sign of health service delivery problems.8 These are two fundamental concepts and the Atlas production team frequently challenges itself about the use of data, how those data should be presented and to be clear about what it signals.

A way of mitigating that issue introduces the third lesson. It is critical to engage and maintain a constructive relationship with the most senior clinical leaders — in the case of NHS England, the National Clinical Directors (NCDs). This is important when selecting the indicators and agreeing the commentary for the Atlas. The leadership shown from NCDs in NHS England cannot be underestimated and should never be undervalued as an important step in the process of deciding which indicators and which dataset should be applied and what narrative to transmit. This positive relationship also enhances the credibility of the Atlas and increases the focus of attention to those indicators that have been declared as being of such importance by the NCDs, which can also lead to improved uptake and use of the Atlas series through the medium of both the printed versions and the interactive Atlases. These early lessons endorse the notion that stimulating interest and curiosity is the first step toward action and a reduction in unwarranted variation.

Publication phase

It is important to be clear that the publication of the Atlas of Variation is not a blunt performance tool, and the Atlas team is careful not to use any data that the health system does not already have access to. Therefore, available data are always used, in a novel way, to produce commentaries and illustrations, with maps, about the extent of variation for all sorts of provision, spend and outcome. The lesson is that the publication of the maps needs to be both stimulating and dramatic to draw a response from the health care system to investigate the known variation in each area of health care; an objective which appears to be achieved by organisations’ inquisitiveness to understand their position in relation to their peers and then to use that information as formative learning9 for future planning and decision making.

A key message from this phase is the involvement and engagement of other stakeholders, beyond the NCDs, in both the preparation and participation of the launch of the Atlas. It has previously been declared that the engagement of senior clinicians and policy makers is an important part of the whole process, particularly during the publication process. There are other key stakeholders to engage here too; perhaps the most important are patient representative groups and third sector organisations that can create a powerful and positive narrative about what the Atlas is displaying, remembering the message that not all variation is bad — if it were, it would be easier to take action.10 The involvement of patient representatives also helps the shared decision making (SDM) agenda, which is an important part of the transformation process, enabling the active involvement of patients with their clinicians to make the right decision about the choice of treatment.

NHS Right Care has long advocated and continues to promote the use of SDM as a way of empowering patients to become part of the solution to the challenge of delivering high quality care. The transformational program has developed and published 35 patient decision aids (PDAs) to complement the Atlas series. PDAs are specially designed resources to help patients make informed decisions about their care. People who have used the PDAs report that they understand their problem and the choices they have more clearly.

The ambition of NHS Right Care is to use the Atlas of Variation to stimulate a search for unwarranted variation in the NHS and its underlying causes, by providing a tool for learning and exploration of potential deficits in local resource allocation. That ambition is amplified when using the PDAs as a tool to engage and support patients in decision making about what is right and appropriate for them.

Public services, including health services, are under pressure to control increasing costs, and the NHS has been challenged to adapt to evolving demands and “shine a light on variation in care and unacceptable practice”11 to improve the quality and safety of care. A significant lesson is that the production and publication of an atlas of variation is not an end in itself but an essential component of a large scale transformation initiative to increase value, improve quality and reduce harm.

Next phase

The domains of quality and safety have strongly influenced the shape and delivery of the NHS for more than a decade, but is this the right paradigm for the next decade and beyond? We ask this as we are reminded that the issue of variation in health care is not a new phenomenon. Indeed, it could be argued that variation has been met with a level of inertia and confusion for many years and by raising the awareness of variation, through the publication of the NHS Atlas of Variation series, we aim to stimulate the search for unwarranted variation but also to further advance the focus of attention toward value.

If health care systems are to meet rising demand with reducing resources, there needs to be a shift from traditional patterns of planning and contracting around established organisations and clinical processes to one that is focused on “doing the right thing — for the right patient — at the right time”, where we need to think about value. The Right Care initiative has set out to promote value by encouraging organisations to aim for optimal care, declaring that it is not a process that can be done in isolation of other organisations, and to remember that no one professional group has all the necessary information or knowledge to plan and deliver optimal care.

Rather, health care systems need to look at their processes, working with their populations to decide if the balance is right between prevention, screening, diagnosis, intervention and long term care. The search for unwarranted variation plays an important part in that quest and the time has arrived for us to enter the “value era”, in which a population perspective and patient views of value are adopted to improve the health outcomes for both populations and individual patients.

Reducing variation to increase value

Possibly the simplest way to think of value is from an economic perspective. The word “value” is, like many words, slippery to define and can have a range of meanings to different people. In the plural, as in the terms “values”, the word has a moral meaning — for example, “we value diversity and equality.” In the singular, however, the meaning is largely economic.

The Right Care approach identifies three types of value:

  • Allocative value — to optimise allocative efficiency by taking responsibility for the resources allocated.

  • Technical value, or efficiency — it is essential that all organisations work across the health care system to maintain a good understanding of what is being delivered, including whether some services are now being delivered at a rate that could be classified as overuse.

  • Personalised value — determined by the degree to which the outcome relates to the particular problem that the individual brought to the health service, where shared decision making becomes the norm for that population.

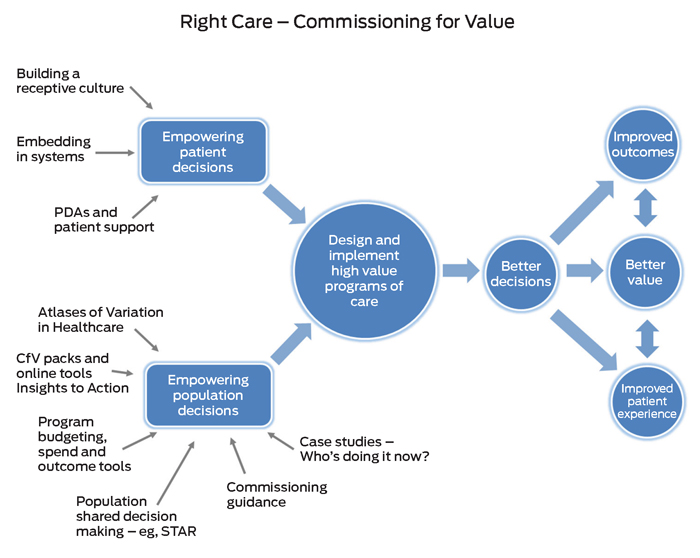
The primary focus of the Atlas series has been to create a tool to raise the profile of variation, at a population level, as part of a much bigger transformation initiative. What quickly emerged was the need to think of both population and personalised health care as being two sides of the one coin. The agenda now is to focus on increasing the value of health care to the whole population as well as on the optimal care for the individual patient. This is summarised in the Right Care approach (Box 2), which clearly offers an insight into why atlases of variation are important, but recognises that they cannot be the singular answer to transforming health care.

Conclusion

This article has demonstrated how the production and publication of an atlas of variation can be an important step in the journey toward increasing value in health care — for patients, for populations and by directing resources to higher value health care, for tax payers. The article has described how the preparation stage, which includes many conversations, negotiations and lengthy discussions (eg, deciding the indicators and narrative) leads to improved engagement of all stakeholders. Working hard to build a positive relationship at the preparation stage pays dividends during the publication phase, where all stakeholders can contribute to the overall message and purpose of the Atlas. It is not sufficient, however, to publish an atlas of variation in isolation from other tools (eg, patient decisions aids) and expect it to have remarkable impact. An atlas of variation needs to be an integral part of a larger transformational change program.

Box 1 –
NHS Atlas of Variation series titles

Year

Title


2010

NHS atlas of variation in healthcare

2011

NHS atlas of variation in healthcare 2.0

2012

NHS atlas of variation in healthcare for children and young people

2012

NHS atlas of variation in healthcare for people with diabetes

2012

NHS atlas of variation in healthcare for people with kidney disease

2012

NHS atlas of variation in healthcare for people with respiratory disease

2013

NHS atlas of variation in healthcare for people with liver disease

2013

NHS atlas of variation in diagnostic services

2015

NHS atlas of variation in healthcare 3.0


Box 2 –
NHS Atlas of Variation series illustrated as an essential part of a large scale transformation initiative to increase value and reduce unwarranted variation


CfV = Commissioning for Value. PDAs = Patient Decision Aids. STAR = Socio-Technical Allocation of Resources.

Clinical variation: why it matters

Understanding variation in care is an important step in improving patient health outcomes through appropriate care

Variation in health care usage is a troubling feature of contemporary medicine. For similar populations, usage of medications, interventions and procedures may be very different and lead to variation in outcomes. The following articles discuss why exploring unwarranted variation is a priority for health care systems; how atlases of health care variation act as catalysts of change and what health care systems can do to increase appropriate care. In this context, the Australian health care systems’ response to the problem of unwarranted health care variation is considered.

In November 2015, the Hon Sussan Ley, federal Minister for Health, launched the Australian atlas of healthcare variation.1 The Atlas, the first in a series, looks at variation in health care use at population level for 36 clinical activities including medication dispensing, diagnostic and surgical interventions and interventions for chronic diseases. International data, where available, are included and provide context. For example, Australia’s rate of dispensing of antibiotics is almost double that of Canada. This variation is consistent with a large body of evidence including that from a recent Organisation for Economic Co-operation and Development report, which included Australian data.2,3

In a number of countries, variation is being explored as a way to define and promote appropriate care and thereby value in the health care system. In this Supplement, DaSilva and Gray argue that atlases of clinical variation are catalysts for change by stimulating debate, engaging all participants in the health system so that patient-focused care can be achieved.4 The authors argue that no one group has all the necessary information, knowledge or capacity to plan and deliver appropriate care. For this reason, the Australian Commission on Safety and Quality in Health Care (the Commission) and the National Health Performance Authority developed the Australian atlas with input from the states and territories, and clinician and consumer groups. The Atlas’s recommendations require action from many parts of the health care system.

Variation is not bad per se. As Buchan and colleagues note, some variation in health care delivery is warranted and desirable, such as meeting differences in patients’ health needs or health preferences.2 For example, patients with knee pain from osteoarthritis may choose physiotherapy, knee replacement or lifestyle changes. The focus must be on variation that is inexplicable by either patient need or preference and is therefore unwarranted, such as would occur in the above example if treatment options were not offered. Unwarranted variation means people are exposed to real harm from not receiving care that they need or potential harm from receiving care that they do not need and cannot benefit them.

Atlases as such do not demonstrate the impact of unwarranted variation on patient outcomes. Atlases highlight variation such as, in this case, the seven-fold variation in dispensing rates of antipsychotics in people aged over 65 years. Clinical experts, for example, can analyse the data for unwarranted variation, distil the evidence for change into a clinical care standard and thereby effect widespread reduction in unwarranted variation and increase appropriate care.5

Research literature often focuses on the harms of not receiving evidence-based care. However, there is increasing awareness that people can be harmed from overdiagnosis and overtreatment, an example being antibiotic treatment of all infections.6 “Winding back the harms of too much medicine” (http://www.preventingoverdiagnosis.net) and “choosing wisely” (http://www.choosingwisely.org.au) are two recent catchphrases.

In the era of evidence-based medicine, defining what is right should be easier but remains challenging. Evidence of effectiveness is limited and can change over time, particularly for emerging technology, pharmaceuticals and patients with multiple comorbidities. Where evidence exists, implementation science needs improving. Glasziou, a recognised evidence-based medicine expert, describes a leaking evidence-to-practice pipeline.7 For evidence-based care to occur, evidence needs to be available, applicable and accepted, and able to be implemented, acted upon and agreed to by the patient. Achieving this requires multiple strategies; organisational prioritisation of the issue as important; resources to achieve the objective; systems to support clinician and consumer adoption of best practice; outcome measurement; and feedback for improvement, as Turnidge and colleagues describe in relation to antimicrobial use in Australian hospitals.8 The Commission’s work to support clinician and consumer adoption of best practice includes developing clinical care standards, clinical quality registries and patient-reported outcome measures (PROMs). Articles in this Supplement discuss the emerging evidence for these initiatives.9,10 For example, mechanisms to measure patient outcomes such as PROMs can assess the effectiveness of care.10,11 Clinical quality registries can improve clinical appropriateness and clinical care standards reduce unwarranted variation in treatment, such as for acute coronary syndromes.9,10

There is urgency for improving appropriate care because of increasing demand for services from an ageing population, medical science developments and cost escalators.4 Mechanisms to define, communicate and continually measure value to the patient may improve patient outcomes, and thereby increase the appropriateness of individual care and the sustainability of health care for populations. Future atlases that provide time-trended data will help. Exploring variation is the first step.

Appropriateness of care: why so much variation

Broad descriptions of variation are a useful way of finding disparities, but to generate change they need to be carefully analysed and applied

The Supplement accompanying this issue of the MJA addresses variation in health care delivery as an important theme in ensuring appropriate care across the health system. While all would agree that health care should be provided as and where needed, and that only appropriate care should be delivered, difficulties arise when seeking consensus on what variation is “appropriate” and what should be done about it.

Complex systems are inherently variable. Indeed, a multitude of data shows variation in clinical practice but there is less consensus on its implications. For example, while one focus is high utilisation, there is also an issue with underutilisation, raising issues of equity. Aboriginal and Torres Strait Islander people receive fewer interventions for a range of major health conditions than non-Indigenous Australians; the age standardised rate of coronary procedures is 40% lower.1 Overall, the lowest quintile by socio-economic status of area of residence has 78.8 elective hospital admissions involving elective surgery per 1000 population compared with 91.5 for the highest quintile.2

Geographic variation is the focus of the recent Australian Atlas of Health Care Variation,3 summarised in the Supplement by Buchan and colleagues.4 The Atlas compares extreme high and low rates of interventions, using about 350 areas. An earlier report by the Australian Commission on Safety and Quality in Health Care (ACSQHC) and the Australian Institute of Health and Welfare calculated a systematic component of variation and provided a comprehensive picture covering 60 Medicare Locals, which were in place at that time.5

The two reports focus attention on variation, emphasising unwarranted variation, but crucially they do not define “unwarranted”. While presenting a high profile call for action, priority areas for action are not suggested.

In their Supplement article, DaSilva and Gray,6 noting English experience, point out that an atlas can be used to draw attention to variation, but engagement with clinical and health management leadership is essential for an effective response. Drawing on United States experience, they warn that the transformative promise of variation can disappoint without clinical and political commitment. The authors conclude that:

It is not sufficient to publish an Atlas of Variation … and expect it to have remarkable impact. An Atlas of Variation needs to be an integral part of a larger transformational change program.6

The limited available evidence indicates that public reporting alone has minimal impact on changing clinical practice.7 Change may also be facilitated by considering local factors.8 Atkinson and colleagues identified 13 factors required for system change, including microsystem capacity, credible evidence, engagement, peer support and integration into routine practice.9

In 2016, the Grattan Institute released an analysis of variation in preventable conditions across Victoria and Queensland.10 The report set the bar higher for addressing variation, noting the need for a time series when targeting action. The Institute found that 15% of areas exceeded their variation benchmark each year, but only 5% exceeded it for 3 successive years. It proposed identifying areas showing sustained variation and developing response strategies in consultation with all stakeholders.

Financial incentives are another approach. In the Supplement, Hall and van Gool report disappointing evidence that financial incentives improve quality, and note possible unintended effects through gaming or patient selection.11 Moreover, complex Australian health care financing arrangements make it difficult to share the economic benefits of reductions in practice variations among the various stakeholders. Caution is therefore necessary in considering financial incentives.

A weakness of variation data is that they are always explicable by specific variables, such as patient factors or legitimate process differences. One way to deal with this is to use variation data to identify where change may appear warranted, and then focus on the development of mutually agreed standards of best practice care. Contributions in the Supplement reflect the important work that the ACSQHC has undertaken in this regard: Chew and colleagues describe the process for developing clinical care standards in Australia;12 important examples are provided by Caplan and colleagues (cognitive impairment)13 and Turnidge and colleagues (antimicrobial stewardship).14 However, as noted above, these need to be incorporated into broader micro and macro change strategies.

Wilcox and McNeil argue that clinical registries can play a role in identifying quality interventions and clinical pathways, and indeed the ACSQHC has published guidelines for clinical registries.15 Registries are potentially a link between high level policy and practice variables of interest to a given clinical community. A strategy is now needed to link clinical registries with national hospital data collections, to better inform understanding of in-patient activity variation and performance.

In conclusion, broad descriptions of variation are a useful way of finding disparities, but will not of themselves generate change. To point the way to useful policy change, they need to be carefully analysed and applied.

Variation needs to be addressed as part of the broader quality and safety agenda, where political commitment has been hard won over the past 20 years. Regular, considered reporting of variation may assist, but is not in itself a magic bullet.

Restructuring primary health care in Australia

When appropriately resourced, medical homes can deliver the system-wide benefits of truly integrated primary care

For patients with chronic and complex conditions, optimal care involves a range of clinical skills other than those provided by doctors (eg, a social worker, a clinical nurse specialist or a home care team), some of which are generally not available through Medicare. Patients experience fracturing of their care — such as the need to obtain referrals to consult other health practitioners — and significant out-of-pocket expenses, on which Australians spent around $27.5 billion dollars in 2013–14.1

If both doctors and patients are dissatisfied2 with the current primary care system, what do we wish to offer in the future? Imperatives include a highly personalised service that improves the patient’s health literacy and capacity to better care for themselves and their dependants; continuity of care, important for early detection of problems before they become chronic and complex; the availability of in-house teams to provide most of the services required to efficiently manage chronic, complex illness; and care in a community setting for many patients who would currently be sent to hospital.

In the international setting, the evidence suggests that primary care delivered via the medical home model has been most successful in achieving the goal of truly integrated primary care.3,4 However, international experience demonstrates that the success of the model requires the availability of a specific supportive infrastructure.5,6

The medical home

A key factor in the success of this model involves patients identifying with a practice that assumes responsibility for the holistic care of patients. The voluntary enrolment by the patient in a practice of their choice and the psychology associated with it are also important.7 A sense of belonging to a facility where all health problems can be managed is reassuring and promotes adherence to the advice given.5 Medical homes foster a culture of partnership and expectation and those enrolled accept the obligation to deal with problems that might produce illness or compromise its management. Likewise, the medical team is responsible for helping their patients to avoid or manage health problems.8,9

The staff of a well resourced medical home might include doctors, nutritionists, a social worker, various nurse specialists, physiotherapists, occupational therapists and a dental hygienist. For example, in a new suburb with young families, the medical home might have paediatric nurse specialists and pregnancy management experts, but elsewhere with an older demographic, nurses with geriatric and palliative care expertise might be essential. The exact nature of a given team is determined by the needs of the patients enrolled in the practice. In other countries, the most successful medical homes use electronic health records and offer members electronic connectivity with their team. The Kaiser Permanente group in the United States has turned two million face-to-face consultations with a general practitioner into email-based consultations over the past 10 years to the satisfaction of all parties.10

Because of the continuity of care, which involves appropriately scheduled visits, the team is aware of patients whose health is fragile and who need care in their homes or other community setting. Outreach to such patients can markedly reduce deteriorations that might require hospital admission.5 An effective community intervention in the 3 weeks before patients require hospital care may reduce the number of preventable admissions, which are estimated to be about 600 000 per year in Australia.11 Electronic connectivity — using platforms such as email, Facebook or FaceTime with patients, their carers and local hospitals — is imperative for this model.12

Specialists may wish to affiliate with medical homes, but if international trends are followed, more specialists will visit or practice near medical homes creating what has been referred to as the “patient-centered medical neighbourhood”.13

The model focuses on mutual respect for the skills of different health professionals and a commitment to the central role of the patient with an emphasis on prevention.

After 2009, many countries (eg, the United Kingdom, US and New Zealand) using well resourced medical homes have reported reductions in hospital admissions of 20–24%.5,6

Introduction of the medical home model to Australia

The Australian government has recently announced plans to establish a trial of health care homes with the aim of “[providing] continuity of care, coordinated services and a team based approach according to the needs and wishes of the patient”.14 The trial of this model, for which the government is providing $21 million, is due to start in July 2017, and finish 2 years later. Few details have been provided, but the concept is far from the fully resourced medical homes, whose effectiveness is supported by a strong evidence base. The government’s model relies heavily on some services, such as allied health, being provided outside of the medical home by the 31 Primary Health Networks.

Clinical and consumer champions of the initiative, who have embraced the concept, have convinced others to try the model. Government support, but not imposition, is critical and was a feature of the successful development of integrated primary care in New Zealand.15 Persuasion not regulations are needed and the old will for some time co-exist with the new.

In Australia, the introduction of better integrated primary care delivered from well resourced medical homes as a taxpayer-funded service will require professional, community and political support. The Royal Australian College of General Practitioners,2 the Royal Australasian College of Physicians16 and the Australian Medical Association17 have endorsed the need for trials of the model in Australia. The opposition to the move from all Medicare payments being a fee-for-service has dissipated.17 The model is easily understood by consumers and enthusiastically embraced in many countries.12,18

Remuneration and structure

Remuneration for GPs will occur via a blended payment model, where the majority of income is derived from salaried or contractual arrangements, not fee-for-service payments. Since 2009 in New Zealand, 85% of the public have enrolled in a primary health care program and 85% of GPs are being remunerated via this model.19 Similar initiatives have occurred in the US since 2011, where in many areas, around 65% of GPs are being remunerated using a blended payment model.5,20

Looking at international trends and the history of provision of primary care by the private sector in Australia, we envisage that most medical homes will be independent, privately run organisations. Many of them may be established as companies limited by guarantee or as not-for-profit organisations.12 Consumer involvement will be enhanced by representation on the boards of such companies. Clinicians will be financially rewarded for keeping patients healthy. Through their efforts, the clinical team will build up a business that is valuable and their equity in the endeavour improves their overall financial wellbeing.12

Costing and funding

Pricing skills have been developed in Australia over the past decade to support activity-based funding for hospital care, where the hospital is funded for the casemix of patients it treats. Similar methodology will be needed as we develop new costing and payment systems for primary care services.

There is evidence that the medical home model of care can be adequately funded, with overall expenditure on health remaining in the range of 10–12% of the gross domestic product.21 Over time, the growth in the amount of funding required will be offset by the increased productivity of a healthier population.

A continuous effort to reduce health system-wide inefficiency will be equally important as we move to implement the new model of primary care. Ongoing work of agencies, such as the Agency for Clinical Innovation, to standardise optimal regimens for disease management must continue.22 Dissemination and uptake of these recommendations will reduce variations in clinical care and improve cost effectiveness. Savings will also come from reductions in rates of hospital admission and specialist visits.5,23

Experience from the implementation of this model, in Australia and internationally, will provide a constant stream of learnings that may lead to refinements of the outlined blueprint. However, there is an acceptance among countries in the Organisation for Economic Co-operation and Development that contemporary health systems need to emphasise and resource both prevention strategies and team management of chronic disease if health care is to be equitable and cost-effective.

Health care variation: time to act

Why are knee replacement rates in Australia over four times higher than they are in Israel? Or the rate for caesarean deliveries nearly twice as high as in Finland? These findings come from an Organisation for Economic Co-operation and Development report that highlighted substantial variation in the rates of several common health care interventions both across and within 13 countries.1 These types of geographic variations in health care use have been consistently demonstrated over long periods of time and for a vast range of clinical interventions.26

Variation in health care use across Australia has now been mapped in the recently published Australian atlas of healthcare variation, produced by the Australian Commission on Safety and Quality in Health Care (ACSQHC) and the National Health Performance Authority.7 Health care use by location of patient residence is mapped using standard geographic regions. Rates are standardised by age to adjust for age differences between different geographic populations. Data used to produce the Atlas have come from three datasets: the Admitted Patient Care National Minimum Data Set (APC NMDS), covering patients admitted to public and private hospitals; the Medicare Benefits Scheme (MBS) claims database (use of medical services, procedures and tests covered under this scheme); and the Pharmaceutical Benefits Scheme (PBS) claims database (use of subsidised prescription medicines). This is the first time that data from all these datasets have been used to explore variation across health care settings.

Information on dispensing of antimicrobials, use of diagnostic investigations, interventions for chronic disease, mental health interventions (including use of psychotropic medicines), opioid dispensing and use of surgical procedures are presented in the Atlas. For most hospital admissions, the data are from the 2012–13 financial year. MBS and PBS data are for 2013–14. In Australia, there is high overall use of some drugs, such as antimicrobials and antidepressants, and considerable variation in the rates of some interventions, even when outliers are excluded (Box). Marked regional variation is apparent in rates of surgical interventions such as hysterectomy, endometrial ablation and MBS-funded cataract surgery. There are differences between states in use of psychotropic medicines. The patterns of hospital admission for chronic conditions, with higher rates in rural and regional Australia, contrast with the patterns seen for many elective surgical admissions. Some interventions are used more in areas of higher socio-economic status or, like knee arthroscopy, are known from previous work to be provided mainly in private settings.2 There is no public/private breakdown provided in the Atlas — this would be a useful next step in order to explore the extent to which there are discrepancies in access because of people’s ability or willingness to pay for health care.

Reasons for observed variation

Some variation will reflect differences in need for health care because of differing disease prevalence or severity. Studies of variation aim to account for demographic differences in disease prevalence by standardising results for age and sex. Variation in disease severity is more difficult to adjust for at the population level or to determine using routinely collected health care data. The same limitation applies to risk factors for disease.

Some observed variation may be explained by differences in patient preferences for type of care; for example, choice of medical rather than surgical treatment or for “aggressive” rather than “conservative” management.

Variation may reflect problems with datasets such as incomplete capture of information or inconsistency in coding practices. It may also be random variation — a particularly important consideration when analysing small populations.

Use of health services is clearly related to their supply and accessibility.1,8 High intervention rates for some types of care may reflect poor access to alternatives. One reason for the marked variation in dispensing of psychotropic medicines noted in the Atlas may be a lack of access to alternative mental health care. Similarly, decreased access to community care among rural and remote populations may explain some of the higher rates of hospitalisation in these communities for chronic diseases examined in the Atlas. Less use of elective surgery may be due to lack of local service capability or the inability of patients to pay for private care. Methods for funding or reimbursing costs of health care can markedly influence service provision. Remuneration methods that reward greater volumes of procedures provide incentives to both individual health care providers and organisations for higher rates of servicing.

Clinical decisions are a key driver of health care variation. Practice patterns of individual doctors are influenced by their knowledge, skills, experiences and differences in beliefs about the benefits or harms of specific interventions.9 Even when robust evidence on effectiveness is widely disseminated and well publicised, practices that are at variance with the evidence may remain entrenched in some areas. The personal preference of surgeons for certain types of procedures, irrespective of published literature on effectiveness, can exert a marked effect on rates of use.1013 Thousands of Australians aged 55 and over continue to have knee arthroscopy, with markedly different rates across the country, despite evidence that arthroscopy for treatment of uncomplicated degenerative disease is no better than placebo and potentially harmful.7,1416 Practices known to be effective, such as foot care for people with diabetes, are not consistently employed.17 Such variation highlights problems with the way research on effectiveness is translated into routine practice.

Variation may also result from “indication creep” when a treatment shown to be beneficial within a narrow set of indications (eg, for younger patients with severe disease and few co-morbidities) becomes used in patients with a broader set of indications (eg, for people with less severe disease or older patients with multimorbidity) where there is little or no evidence of effectiveness.

While there is general agreement about the usefulness of operations such as total knee replacement in patients with severe osteoarthritis, there are controversies in the literature about how some patient characteristics affect operative outcomes. Doctors differ in their opinions about which patients will benefit most, leading to different patient selection and different practice patterns.13,18 While studies comparing the long term results of different treatment strategies for the same condition in “real world” patients are starting to be reported,19 the lack of use of routine measures of patient outcome, and the risk of confounding by selection bias, mean considerable uncertainty remains about the true effects on patients of these differences in practice.

Differential use of new therapies with uncertain or unproven benefit also drives variation. The need for a system for controlled introduction and evaluation of new surgical techniques and medical technologies in Australia has been recently highlighted.20

Warranted versus unwarranted variation

Substantial variation in health care use that cannot be explained by patient needs or preferences is often referred to as unwarranted variation.1 It may reflect both underuse of care of proven benefit, raising concerns about equity and the unrealised potential for better health, or overuse of care that is ineffective or likely to confer net harm, thus posing a needless threat to patients and an opportunity cost to a society with limited resources.

Identifying the rate of use of an intervention that is most appropriate within a defined patient population is a major challenge in studying warranted versus unwarranted variation. Routine data collection currently captures a large amount of information about what care is delivered in the health care system, and how long people wait to receive it, but very little about the indications for care and patient outcomes achieved as a result.

Patient-reported outcome measures are mandated for some types of surgery in the United Kingdom21 but are not routinely used in Australia. Linkage of data from different sources to follow up patient health status (while ensuring privacy protection) is another means of determining information on outcome, but while there are some state-based systems for record linkage — for example, in Western Australia data linkage has been undertaken for several decades22 — such linkage is not routine at the national level.

Accurate measurement of the outcomes for people who undergo common or costly interventions would help clarify which types of patients (outside of research settings) are most or least likely to benefit from care. It would also help determine the appropriate population rate of intervention use for specific clinical indications, and would allow for comparisons of variation in outcomes, in addition to variation in use, of interventions.

Defining benefit thresholds is also particularly important in avoiding the natural inclination to assume that, when confronted with a range of low or high use outliers, the mid-point or average value is necessarily the one that reflects the most appropriate rate of use.

Analysing variation

Datasets used to explore variation should satisfy certain requirements. Comprehensive population coverage provides confidence that any observed variation is not due to differential capture of information across geographic areas. Age, sex and residence of the person receiving care are required for standardisation and mapping. The geographical regions used to report variation must have a population of sufficient size to prevent identification of individual patients and health care providers.

The three datasets used for analysis (APC NMDS, MBS, PBS) were established for administration and reimbursement purposes and currently have some limitations when used to investigate geographic variations in health care use. MBS and PBS data do not contain diagnostic information or the reason for provision of the service. Information on most public hospital drug usage, private prescribing or over-the-counter sales is not captured by the PBS data, nor is information on some medicines dispensed by Aboriginal health services. Pathology testing data are only captured on the three most expensive tests ordered for each patient and, as with medicines, information on most of the tests provided free of charge to public patients in hospitals is not captured. The APC NMDS contains detailed diagnostic and procedural information on admissions to a public or private hospital in Australia, but does not include details of tests ordered or drugs prescribed.

As a result, some types of care provided in the system are not consistently captured by any of these three datasets. For example, it is not possible to obtain an accurate picture of variation in total use of magnetic resonance imaging across public and private sectors. The lack of standardised hospital admission policy means some observed variations may be due to differences in admission practices rather than differences in care provided.

Despite their limitations, these three datasets provide the best available information in Australia for identifying variations in health care use. They could be rendered even more useful if some of the issues noted were remedied. Linking individual-level data across these datasets, and with death registries and other clinical or population datasets (while ensuring patient confidentiality), would provide better information about outcomes. It would also help highlight areas where care could be improved; for example, whether there is variation in secondary preventive care for specific conditions after discharge from hospital.

Responses to evidence of variation

The aim of publishing data showing variation in health care is to prompt investigation into why variation is occurring and to ensure that patients receive appropriate care. Reasons for variation need to be examined at a local level using information about service provision that is not available nationally and data sources such as registries that contain clinically richer collections of information about patient care delivery and its outcomes. Within the Atlas, there are 67 recommendations for action. States and local health care organisations should review data and practices in their region, particularly where they are outliers. Some findings have been referred for review by national bodies such as the Pharmaceutical Benefits Advisory Committee; for example, the use of topical quinolones and access to amoxicillin-clavulanate on the PBS. For some items, review of the need for evidence-based guidelines or for new Clinical Care Standards23 is identified; for example, a clinical care standard for the management of osteoarthritic knee pain. Mandated adherence to the National Safety and Quality Health Service Standards24 provides a mechanism for increasing use of evidence-based practice. The Australian Health Practitioner Regulation Agency and national boards are asked by the Commission to consider what can be done to ensure registered health professionals have up-to-date knowledge of prescribing guidelines.

Some recommendations focus on improving patients’ understanding of their care options. Evidence suggests shared decision-making approaches enable people to better choose among different options with associated benefits in terms of better knowledge and more accurate expectations of the likely effects.25,26

Medical colleges and clinical groups may investigate and respond to the data in the Atlas in a variety of ways, including via guidelines, performance measures, audit and feedback and various behavioural incentives.27

Researchers have documented large and persistent variations in health care use, far beyond that explainable by patient need or preference, for many decades.28,29 Research into causes and consequences of variation has been less prolific and linking research to action on unwarranted variation has been problematic. The involvement of policy agencies and clinical organisations in the generation and use of the Australian Atlas offers the opportunity to link investigation of variation with policy levers and actions by health care organisations and clinical groups to reduce unwarranted variation.

Box –
Selected data items from the Australian atlas of healthcare variation7

Data item

Data source

Rate per 100 000 people*

Times difference

Times difference excluding outliers

No. of procedures performed/prescriptions dispensed


Fibre optic colonoscopy

MBS

146–4374

30.0

4.1

589 748

Computed tomography of the lumbar spine

MBS

209–2464

11.8

2.7

314 033

Knee arthroscopy (people aged ≥ 55 years)

APC

185–1319

7.1

4.2

33 682

Tonsillectomy (people aged ≤ 17 years)

APC

254–1640

6.5

3.0

38 575

Hysterectomy and endometrial ablation

APC

131–687

5.2

3.3

34 181

Antidepressant medicines, prescriptions dispensed (people aged 18–64 years)

PBS

14 981–175 380

11.7

2.8

14 933 534

ADHD medicines, prescriptions dispensed (people aged ≤ 17 years)

PBS

382–28 642

75.0

7.3

544 218

Anticholinesterase medicines, prescriptions dispensed (people aged ≥ 65 years)

PBS

1843–28 261

15.3

3.7

427 211

Opioid medicines, prescriptions dispensed

PBS

10 945–110 172

10.1

2.9

13 905 258

Diabetes-related lower limb amputations (people aged ≥ 18 years)

APC

8–91

11.4

2.5

4402


ADHD = attention deficit hyperactivity disorder. APC = Admitted Patient Care National Minimum Dataset (financial year 2012–13); includes public, private and day hospital admissions. MBS = Medical Benefits Schedule (financial year 2013–14). PBS = Pharmaceutical Benefits Schedule (financial year 2013–14). * Range across local areas: rates standardised based on the age structure of the Australian population in 2001; local area refers to Australian Bureau of Statistics standard geographic region known as Statistical Area Level 3 for all items except diabetes-related lower limb amputations, which was analysed at Statistical Area Level 4 because of confidentiality requirements given the low number of admissions. † The difference in rates between the areas with the lowest and highest rates for the specific procedure/medication.