×

Aboriginal community controlled health services: leading the way in primary care

The disparity in health between Aboriginal and Torres Strait Islander people in Australia and their non-Indigenous peers is core business for the Aboriginal community controlled health service (ACCHS) sector. The Closing the Gap framework commits to reducing this disadvantage, with cross-government-sector initiatives and investment, reflecting the need to improve the social and emotional wellbeing of the Aboriginal community.1 Activity in the primary health care sector, with its focus on prevention, early intervention and coordination of care complements these efforts to build healthier communities. With their model of comprehensive primary health care and community governance, ACCHSs have reduced unintentional racism, barriers to access to health care, and are progressively improving individual health outcomes for Aboriginal people.

So what is known about the performance of ACCHSs and mainstream general practice? Why should support for ACCHSs be both continued and enhanced?

Models of care and program delivery

The models of comprehensive primary health care, developed with government and research partners, that are used in ACCHSs are well described.2,3 Clinical services, health promotion, cultural safety, community engagement all underpinned by research, evaluation and planning activity are the essential components in these models. In addition, particularly for maternal and child health, models of family-centred primary health care35 extend comprehensive team-based care of individuals to members of families or households, often with outreach services. These models complement the resources, time and evidence base needed to manage more problems of greater complexity at each consultation6 than are usually seen in mainstream general practices.

The patient-centred medical home (PCMH) model,7 now suggested as best practice for general practice,8,9 is not dissimilar to the model used by ACCHSs since their inception in the 1970s.10 Leadership in ACCHS involves both ACCHS management and the community, and the care model is more team-based than general practitioner-focused. Nonetheless, the ACCHS and PCMH models have much in common. Care: is patient-focused; may encompass the family; has significant physician input; is integrated with allied health specialists, mental health professionals and community services, preferably delivered in the home; and is underpinned by participation in clinical quality-improvement programs. Importantly, with increasing regionalisation and with government policy supporting more community-driven models of care (with the advent of Medicare Locals and Health and Hospital Networks), the ACCHSs provide prototypes for community-operated health services.

Access

Do Aboriginal people use general practices more than ACCHSs as is sometimes claimed?11 In Queensland, 27 ACCHSs are spread across a diverse, decentralised area of 1.7 million square kilometres. The service data suggest that, in regional areas, the use of ACCHSs by people identifying as Aboriginal may be higher than the 50–50 split with general practice indicated by Medicare Australia data.12 Employing various strategies such as the Practice Incentives Program copayments, social marketing campaigns and targets set in a clinical quality-improvement (CQI) collaborative, ACCHSs in Queensland have been increasing their patient enrolments.

Based on Australian Bureau of Statistics-estimated catchment data for the Queensland services by local government areas or by drive time,13 the number of Aboriginal patients making one visit in 2 years to these regional ACCHSs is higher than the resident Indigenous population (Box 1). For 11 of 17 services, over 60% of Aboriginal people living in their catchments within a 30-minute drive had visited in the 2 years to September 2012; for six of these ACCHSs, all classified Remoteness Area 2 or 3, the data suggest up to 100% of the Aboriginal population living within a 30-minute drive are using their services, with many patients travelling longer than 30 minutes. Coverage is lower in the large metropolitan centres, for example in Brisbane where three ACCHSs serve a population of 40 000.

Access to services is critical and, where ACCHSs exist, the community prefers to and does use them,14 suggesting that patterns of use reflect patchy supply.

Need

There are ongoing drivers of ill health among adult Aboriginal patients who use ACCHSs. In Queensland, 49% of adults remain current tobacco users, over 70% are overweight or obese, 25% have hypertension, and 18% have type 2 diabetes mellitus.15 These problems must be tackled by individuals, families and the community. To effect change, health providers need well resourced allied health teams, preferably operating from their clinics, where people feel respected and are given assistance with transport.4 Sustaining programs run by the Tobacco and Health Life Style teams established in ACCHSs from 201016 will continue to support downward trends, for example, in tobacco use.

Traditional general practice is ill equipped to deal with ongoing problems in Aboriginal health and the necessary complex challenges in behaviour change.

Quality of care, evaluation and performance

The medical literature has many reports of well implemented research programs, often integrated with everyday care in ACCHSs, showing improved health outcomes. Sexual health,17 maternal and child health,18 smoking cessation19 and cardiovascular programs20,21 have been successfully run and monitored in ACCHSs. Recently ACCHSs have been building their capacity to collect and use health service data, enabling review of service delivery, performance tracking and monitoring of the health status of their patient cohorts.

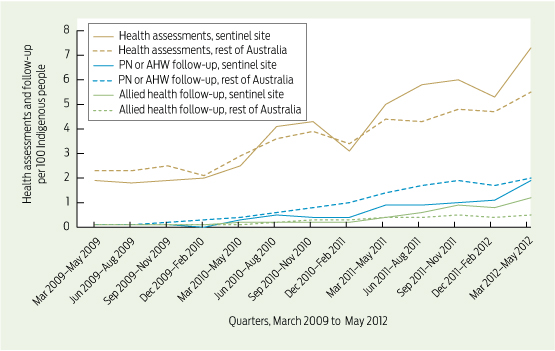
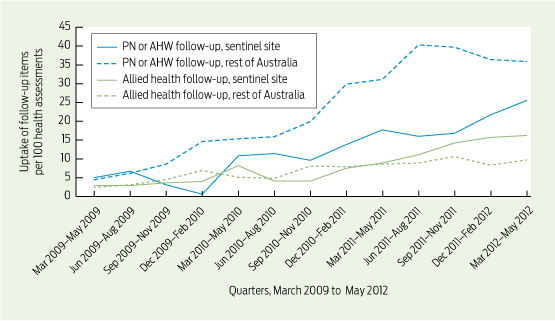
Care delivered in ACCHSs for prevention and chronic disease management appears to be equal to if not better than that delivered by general practices. Queensland Aboriginal and Islander Health Council (QAIHC) data show good performance in risk factor monitoring and the management of hypertension and chronic disease.15 Box 2 shows improving performance in completion of health assessments — a first step in prevention activity— over the past 4 years.22 The Torpedo study, a randomised controlled trial of the use of an electronic decision-support system measuring absolute cardiovascular risk, shows ACCHSs outperforming general practices in managing risk.21 Data collected in late 2011 show that the ACCHSs sites had significantly more patients at high risk being prescribed best-practice medications than the general practice sites at baseline, and this gap was sustained through the intervention period (Box 3).23

Data from the Australian Primary Care Collaboratives (APCC) program, often not published, can examine performance between ACCHSs and general practice clusters. Data for 2012, from Wave 2 of the APCC e-health program, show that ACCHSs in Queensland had more diagnoses coded (as opposed to use of free text) in medical histories and a higher proportion of medications on their current medication lists prescribed within the preceding 6 months than their general practice counterparts (Box 4). This pattern is similar to that reported for cardiac and diabetes care in 20113 and seen in recent years in the QAIHC Closing the Gap Collaborative, where ACCHSs were the higher performers in identification of risk factors and completion of health checks (K Panaretto, unpublished data). These data reflect the commitment to delivering evidenced-based care by clinical teams and the voluntary participation in clinical quality-improvement programs seen in ACCHSs, resulting in these services leading the primary health care sector in monitoring clinical performance.

Workforce and training

ACCHSs are significant employers of Indigenous people. In 2012, the 150 ACCHSs employed nearly 4000 people nationally. Of these, some 95% of health workers, 85% of drivers and 32% of allied health professionals (55% overall) identified as Aboriginal and/or Torres Strait Islander. The proportion of Indigenous doctors and nurses remains low (5% and 10%, respectively).24 The Leaders in Indigenous Medical Education (LIME) Network has recently signed an agreement with the National Aboriginal Community Controlled Health Organisation seeking to increase Aboriginal medical student placements in Indigenous primary health care settings with a view to increasing participation in and enhancing the effectiveness of the medical workforce. Similar initiatives are underway in nursing, including innovative programs that are graduating new cohorts of Indigenous midwives.25 In addition, the ACCHSs have always had a major role in Aboriginal health worker (AHW) training, and the introduction of national AHW registration will standardise the quality of this important component of the health workforce.26 The services’ ability to deal with the impact of social determinants and lower health literacy is due, in part, to ACCHSs being significant providers of Aboriginal employment and training.

The way forward

When challenged to deliver best-practice care, ACCHSs have risen to the task, assuming a rightful place in the broader Australian health system. Based on the evidence available, health care delivered by ACCHSs is of a high standard, compares favourably with mainstream services on key aspects of clinical care and warrants continued funding support. ACCHSs are committed to improving the health of their communities, leading the way with improved governance and use of data to ensure they deliver the best evidence-based services possible today. They are focused on delivering systematic patient-centred care and are embracing innovations in e-health, the personally controlled electronic health record and electronic prescribing, to promote continuity of care and coordination across ACCHSs and mainstream services.

In view of the possible cuts to funding to the ACCHSs sector with the rationalisation of Indigenous programs announced in the recent Budget, the data suggest that to enhance the quality of care and reach national targets requires:

  • policy and funding support to provide additional ACCHSs in both regional and metropolitan areas, where there are currently large populations with poor access to comprehensive primary health care;
  • recurrent funding support for initiatives to sustain clinical and administrative quality-improvement programs; and
  • mainstream primary health care providers continuing to enhance their recognition of their Aboriginal patients through clinical quality-improvement initiatives and by partnering with the community controlled sector to monitor performance and value across both sectors.

In conclusion, ACCHSs are key players in the Indigenous community in exercising self-determination, taking responsibility in action, improving Aboriginal and Torres Strait Islander health, and setting the frameworks to underpin the shift to healthy or well communities. The government must acknowledge and continue to support ACCHSs as leaders in Aboriginal primary health care.

1 Aboriginal and Torres Strait Islander patients with one recorded visit to an Aboriginal community controlled health service in Queensland in the 2 years to September 2012


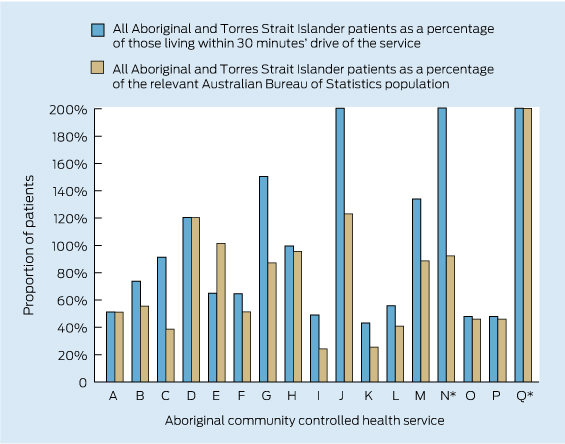
* Services N and Q are shown with the values for all patients as a proportion of those within 30 minutes’ drive truncated (actual values, 211% for N and 479% for Q). Service Q is also shown with the value for all patients as a percentage of the relevant Australian Bureau of Statistics population truncated.

2 Aboriginal and Torres Strait Islander adults who regularly attended participating health services in Queensland between February 2010 and January 2014 and who had a current health assessment*22


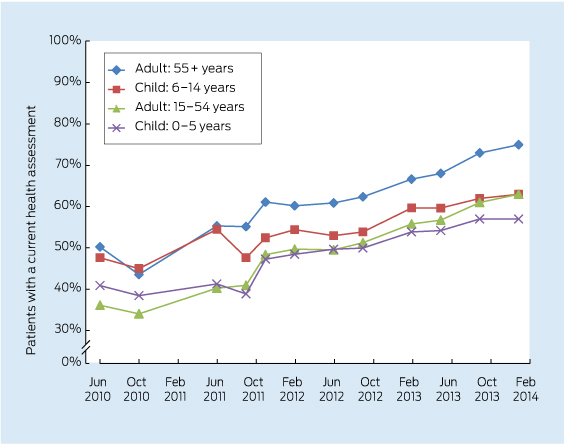
* A comprehensive review of patients’ health (Medicare Item 715) within the past 2 years (formerly the Aboriginal and Torres Strait Islander health check).

3 Baseline data for the Torpedo study23 before random allocation — management of patients with high cardiovascular risk or established cardiovascular disease in 40 general practices and 20 Aboriginal community controlled health services for the 12 months to May 2012


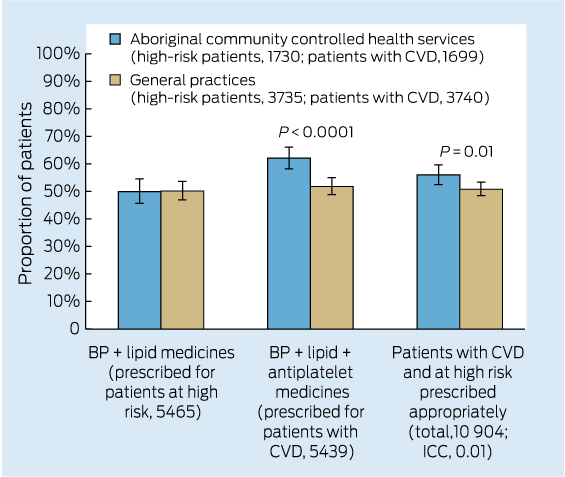
BP = blood pressure. CVD = cardiovascular disease. ICC = intraclass correlation coefficient.

4 Comparison of participating general practices with participating Queensland Aboriginal and Islander Health Council (QAIHC) services for performance in coding of diagnoses and currency of the medication list*


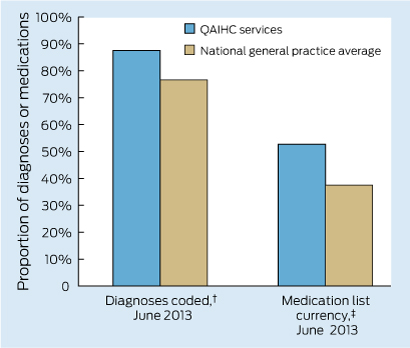
* Unpublished data from Australian Primary Care Collaborative e-health program, Wave 2, 2012–13. † Proportion of total diagnoses in past medical history that are coded. ‡ Proportion of medications on the current medication list that have been prescribed in the past 6 months.

Follow-up of Indigenous-specific health assessments – a socioecological analysis

Preventive health assessments have become a feature of health policies internationally.1 In Australia, Medicare-funded Indigenous-specific health assessments (herein referred to as “health assessment”) and follow-up items have been progressively introduced since 1999 as a means to improve the limited preventive health opportunities and reduce high rates of undetected risk factors among Aboriginal and Torres Strait Islander people (respectfully referred to hereafter as Indigenous people) (Box 1).3,4

A recent systematic review shows that while health assessments may increase new diagnoses, there is a lack of evidence of their effect on morbidity and mortality.1 While the reasons for lack of impact of health assessments are not well understood, it is clear that health assessments have limited potential to impact on health outcomes in the absence of appropriate follow-up care.57 The $805 million Indigenous Chronic Disease Package (ICDP) introduced by the Australian Government in 2010 included program funding and a new workforce to help increase the delivery of health assessments and appropriate follow-up.8

Analysis of Medicare data shows an increase in the uptake of health assessments, but relatively limited billing for Indigenous-specific follow-up items.5,9 The limited use of follow-up items raises questions about the effectiveness of health assessments as a catalyst for enhancing access to preventive care and chronic disease management,10,11 and highlights the need for further research on how to increase follow-up after a health assessment.12

This paper reports on patterns of uptake of health assessments and associated follow-up items, and examines the barriers and enablers to delivery and billing of follow-up care over the first 3 years of implementation of the ICDP.

Methods

The analysis presented here draws on the mixed-methods Sentinel Sites Evaluation (SSE) of the ICDP. SSE methods are detailed elsewhere.5 The SSE was a formative evaluation covering 24 urban, regional and remote locations in all Australian states and territories. Data were collected, analysed and reported in 6-monthly intervals over five evaluation cycles between 2010 and 2012.

Data on uptake of health assessments and follow-up items were derived from administrative billing data provided by the Department of Health from 1 May 2009 to 30 May 2012. The period May 2009 to April 2010 was used as a “baseline” period, as it preceded implementation of the ICDP. Health assessment data include Medicare Benefits Schedule (MBS) items, and are presented as health assessments claimed by services within the site boundaries per 100 Indigenous people aged ≥ 15 years. Similarly, the follow-up data include MBS items for follow-up of health assessments (see Box 1 for health assessment and follow-up items included in this analysis). Population data are based on Australian Bureau of Statistics projections from the 2006 Census according to the statistical boundaries used to define the sites.

Qualitative data on barriers and enablers to delivery of and billing for follow-up were obtained from individual and group interviews with a range of key informants from Aboriginal Health Services (AHSs), which include community controlled and government managed health services, and the general practice sector, which includes employees of Medicare Locals and general practices (Appendix 1). Interviewees were purposively sampled for their knowledge and experience with the ICDP. Interviews and analysis were informed by data on state of implementation of the ICDP at site level, as reflected in Department of Health reports. Repeated 6-monthly cycles of interviews and feedback of data between 1 November 2010 and 30 December 2012 allowed review and refinement of our understanding of delivery and billing of health assessments and follow-up items.

Community focus groups were conducted to explore community perceptions of accessibility and quality of services. Data from community focus groups were related to access to health services in general rather than being specific to follow-up of health assessments.

For the purposes of this paper, we conducted an analysis of SSE data using a socioecological framework.13,14 We reviewed the themes that were identified through the SSE as barriers and enablers to follow-up of health assessments,5 and used an iterative approach to categorise these themes according to various levels of influence: patient, patient–health service relationship, health service or organisation, community and policy environment. Some themes could be interpreted as a barrier or an enabler, and some were relevant to more than one level. We have therefore described each theme according to the predominant direction and most important level(s) of influence.

Ethics approval for the SSE was granted through the Department of Health Human Research Ethics Committee, project 10/2012.

Results

Of the 581 individual interviews done through the SSE, 63 contained specific information about the follow-up of health assessments. Of the 58 group interviews, 31 contained information relevant to this paper. These 31 group interviews included 103 participants. Of the 72 community focus groups, 69 provided data on access to services (Appendix 1).

Uptake of Indigenous-specific health assessments and follow-up Medicare items

Aggregated data show a general improvement in uptake of health assessments and follow-up items after the baseline period, with some differences in trends between the sentinel sites and the rest of Australia (Box 2 and Box 3). The uptake of follow-up items was disproportionately low compared with health assessments. There were marked differences in trends between individual sites (Box 4) — more marked than differences between sites according to rurality.5

Levels of influence

Barriers and enablers to delivery and billing of follow-up care using a socioecological framework were identified at five levels of influence: patient, interpersonal, health service, community and policy. Findings at each level of influence are summarised below and exemplar quotes illustrating each theme and sub-theme are provided in Appendix 2.

Patient level

Strategies to create community demand and incentives for patients to undergo health assessments were evident at the local level. These strategies did not appear to include attention to increasing follow-up of health assessments, and there was little evidence of patient demand for follow-up after health assessments in the sentinel sites overall. People working in ICDP-funded support roles with responsibility for encouraging patients to attend for follow-up reported that patients frequently appeared to lack information about the reasons for their follow-up referrals.

Interviewees in some sites identified relatively frequent movement of people, with no regular residential address and limited options for contacting patients by phone, as constraining follow-up care. Limited access to transport was consistently identified by community focus groups as a barrier to accessing services. Concerns were expressed about the cost of accessing follow-up services, with out-of-pocket costs to patients for allied health care in particular being unpredictable.

Interpersonal level

Negative past experiences affected patients’ willingness to attend follow-up appointments. Community focus groups and interviewees shared personal stories that reflected perceptions of racist attitudes among health service staff — commonly reception staff.

Outreach workers, funded through the ICDP, played a key role in educating and supporting allied health providers and clinicians to provide culturally appropriate care in isolated pockets, but overall, allied health professionals had relatively limited access to cultural awareness training. General practitioners and practice staff were reluctant to refer patients to allied health professionals who they could not be confident would act in a culturally appropriate way.

Some GPs reported reluctance to refer patients for follow-up unless critical because they believed the patient would not attend, or they provided referrals with no expectation of attendance. Some patients appeared to resist adherence to follow-up referrals and treatment due to what they regarded as the “pushy” nature and communication style of some health professionals, and lack of adequate explanation of their health problem and treatment needs.

External support by regional support organisations including Divisions of General Practice (and subsequently Medicare Locals) helped improve awareness of the Indigenous-specific follow-up item numbers in health services and among allied health providers.

Health service level

Health service providers felt that short consultation times meant they had limited opportunity to explain reasons for referral for follow-up care to patients. This was related in part to shortage of service providers, including GPs, allied health professionals, Aboriginal Health Workers (AHWs) and practice nurses. Limited numbers of allied health professionals in particular constrained referral for allied health services. In some settings, eligibility requirements meant that some AHWs appeared to be ineligible to bill for relevant follow-up services, constraining use of these item numbers.

Organisations tended to have a greater focus on health assessments — partly for financial reasons rather than potential health benefit — with less attention to follow-up. This imbalance was also evident at policy and patient levels. Small numbers of Indigenous patients in many general and allied health professional practices were associated with a reluctance to reorient systems to address the needs of relatively few patients.

A general orientation within some health services to acute rather than chronic illness care limited the availability and interest of many nurses in providing follow-up services. This was particularly the case in remote settings, where acute care skills are an important criterion in recruiting nurses. GP-centric models of care, lack of clarity about roles and lack of confidence in co-workers were associated with limited opportunities for practice nurses and AHWs to manage patient lists and appointments and deliver follow-up consultations.

Another constraint on the uptake of follow-up items was the lack of established systems to organise and bill for follow-up, and a perception that the steps required for completion and correct billing of follow-up services were complex and required highly organised patient records and information flow. The need for changed work patterns, reorientation to preventive health and enhanced staff training and support in the use of clinical information systems presented significant challenges to health services in delivering and claiming these Medicare items. Leadership and management were vital to system change: where leadership lacked commitment, management practices did not support system change to implement this aspect of the ICDP. Where GP-centric models of care were entrenched, it was particularly difficult to reorient systems to enhance uptake of follow-up items.

Lack of capability in using clinical information systems, such as patient recall and reminder systems, also constrained follow-up. Ineffective use of these systems to support patient care was commonly reported in AHSs and general practices, and was also evident in allied health professionals’ practice systems.

Staff turnover and use of locum staff (both nursing and GP) were associated with limited use of follow-up items. GPs were found to have varying knowledge and skills in relation to accessing appropriate Medicare items and working within a multidisciplinary team. Fluctuating staff numbers and variable knowledge among staff of the service operations made it difficult to reorganise systems to enhance follow-up.

Interviewees commonly reported that follow-up consultations were frequently billed as a standard consultation rather than the correct Indigenous-specific Medicare item number.

Lack of private allied health providers, and a tendency — for cost reasons — for clinicians to refer to salaried allied health professionals, where these professionals were available, also limited the use of the Medicare follow-up item numbers. Lack of easy access to information and transparency around gap payments, and entrenched perceptions that services would be expensive and require numerous repeat visits, were a barrier to health service staff referring patients to allied health professionals.

Community level

Barriers related to Indigenous social and economic disadvantage included poor availability of transport to attend follow-up appointments and high or unpredictable cost of allied health services. These were exacerbated in the context of general social and financial disadvantage. ICDP-funded outreach workers played an important role in helping patients overcome transport barriers in some sites.

Policy level

At the policy level, the relatively low value of the MBS reimbursement for follow-up (relative to health assessment), reflected in the large gap payments that patients are faced with, appears to be an important constraint to greater uptake of the financial incentives available for follow-up. Increased and ongoing funding to support preventive care through Medicare encouraged uptake of follow-up care. The impact of this was constrained by relative emphasis on health assessments. There was confusion over eligibility of AHWs to claim the use of the follow-up items. Funding of positions and programs (including through the ICDP) to assist with provision of information to providers and community members and to overcome barriers to access enabled uptake of follow-up items.

Discussion

While there has been a substantial increase in the uptake of health assessments over recent years, delivery of follow-up care and billing for Medicare Indigenous-specific follow-up items was disproportionately low, particularly given the evidence of the high levels of need for follow-up.6,12,15,16 Our study identified multiple influences on uptake of follow-up care at various levels of the system — many related to actual delivery of follow-up care and some related to billing for Medicare items numbers. The influences identified in our analysis are consistent with the research on barriers to implementing health assessments and on access to health services more generally.3,6,7,1719 It appears that people receiving health assessments may be those who use health services more frequently,5 those of higher socioeconomic status, those with lower rates of morbidity and mortality and those with lower risk of chronic disease.1,20 Thus, health assessments may not be reaching those who need them most, reducing potential benefits at a population level. This “inverse care law”21 is likely to also be relevant to follow-up of health assessments, indicated by the access and cost barriers to follow-up identified in this analysis.

Strengths of the analysis in this paper include the mixed-methods approach, numbers and diversity of interviewees, geographic scope and diversity of study sites, and long-term repeated engagement with stakeholders, including feedback and member-checking of data and interpretation by local stakeholders. The socioecological analytical framework highlights that there are a number of factors at different levels of the system that enable or constrain choices made by individuals about access to health care.13,14

Limitations of this study include that sites were selected on the basis of early and relatively intense ICDP investment, and interviewees were selected because of their knowledge and interest in Indigenous health. The data provide a broad perspective of service settings across Australia, but this perspective may not necessarily be representative. Other limitations include that administrative data reflect billing for Medicare items, but do not necessarily accurately reflect the provision of clinical care. There is some evidence that follow-up may be happening, but that it is not being billed accurately. However, many of the identified barriers related to delivery of follow-up care rather than billing for follow-up items. Ecological models require themes to be categorised, and this process may be overly Western-centric.22 In conducting the analysis our team (which included Indigenous members) was sensitive to this risk. The strong links and interrelationships between themes need to be recognised. More general limitations of the SSE have been described elsewhere.5

Overcoming barriers to follow-up and strengthening enablers is vital to achieving health benefits from the large financial and human resource investment in health assessments. Our findings point to the need to support health services in developing systems and organisational capability to undertake follow-up of health assessments, but more importantly to reorient to high-quality, population-based and patient-centred chronic illness care. Drawing on our findings, we propose actions at various levels of the system to enhance both delivery of follow-up care and billing for follow-up items (Box 5). The diversity of contexts in which health services operate, the wide variation in current levels of follow-up between sites and the relevance of different contextual factors to barriers to uptake in different sites mean that strategies will need to be tailored to local circumstances.

1 Medicare Benefits Schedule (MBS)-rebated items for Indigenous-specific health assessments and follow-up2

Item characteristic

Health assessment

Follow-up by a PN or registered AHW

Follow-up by an allied health professional


Description

Available to all Indigenous people and may only be claimed by a general practitioner

After a health assessment, a follow-up item can be claimed by GPs for follow-up services delivered by a PN or registered AHW on behalf of the GP

After a health assessment, if the GP identifies a need for follow-up by an allied health professional, a referral is made and the allied health professional can claim this item

MBS item number

704, 706, 710 to 1 May 2010; thereafter 715

10987

81300–81360

MBS rebate

$208.10

$24.00

$52.95

Notes

Changed to simplify claiming by streamlining MBS item numbers to one item and making all claimable annually. This came into effect from May 2010 and coincided with implementation of the ICDP

Introduced in 2008, this MBS item allowed five follow-up services per patient per calendar year. This was expanded in 2009 to allow 10 follow-up services per patient per calendar year

Introduced in 2008, on referral from a GP, a maximum of five follow-up allied health services per patient per calendar can be claimed


AHW = Aboriginal Health Worker. ICDP = Indigenous Chronic Disease Package. PN = practice nurse.

2 Health assessments provided by a general practitioner, and follow-up services provided by a practice nurse (PN), registered Aboriginal Health Worker (AHW) or allied health professional

3 Follow-up services provided by a practice nurse (PN), registered Aboriginal Health Worker (AHW) or allied health professional in Indigenous people who had a health assessment

4 Uptake of practice nurse (PN), registered Aboriginal Health Worker (AHW) or allied health professional follow-up items in all urban sentinel sites and in the rest of urban Australia


NSW = New South Wales. Qld = Queensland. SA = South Australia. Vic = Victoria.

5 Potential strategies for strengthening follow-up of health assessments

Approaches to enhancing follow-up are presented for each level of the socioecological model. It is important that strategies to enhance follow-up use approaches across the range of levels, with attention to maximising synergies between approaches at different levels.

Patient level

  • develop locally relevant evidence-based approaches to create community demand for follow-up of adult health assessments;
  • address transport and other barriers to access to follow-up care; and
  • strengthen linkages between health services and local communities to enable recall of patients who require follow-up.

Interpersonal level

  • ensure that cultural awareness training reaches relevant providers, including allied health professionals and service support staff, such as receptionists.

Health service level

  • continue efforts to raise awareness of the follow-up Medicare Benefits Schedule (MBS) item numbers among health service staff and allied health professionals, including how item numbers complement each other and why the correct Indigenous-specific item numbers should be used (eg, additional numbers of items available with specific item numbers);
  • strengthen capability of health service staff to make effective and efficient use of clinical information systems, specifically including use of recall and reminder systems. Ongoing training and workforce development is required to address staff turnover and locum staff needs;
  • support service reorientation from models suited to acute care to models suited to patient-centred and long-term care;
  • develop and assess effectiveness and efficiency of alternate models of provision of allied health services and “what works for whom and in what circumstances”; and
  • identify and communicate cost implications of referral for follow-up care, and address cost barriers to follow-up care.

Community level

  • raise awareness of the need for ongoing chronic illness care and the importance of follow-up of issues identified in health assessments; and
  • identify relatively high-need and hard-to-reach groups in local communities, and develop strategies to overcome the barriers to these groups accessing follow-up care.

Policy level

  • clarify the Aboriginal Health Worker role in provision of services, including provider number eligibility;
  • ensure that the policy intent of having an Indigenous-specific MBS item number for follow-up services is clearly understood at different levels in the system; and
  • emphasise the health-relevance of health assessments and the importance of follow-up care, and refine incentives to maximise potential health gain.

Cost of best-practice primary care management of chronic disease in a remote Aboriginal community

The health of Australian Aboriginal and Torres Strait Islander people is very poor, and their access to primary care is inadequate, especially in remote areas.13 Prevalence of and mortality from type 2 diabetes (hereafter diabetes) and chronic kidney disease (CKD) are extremely high in remote Aboriginal communities in the Northern Territory.4 Chronic disease is responsible for 80% of the mortality gap between Indigenous and non-Indigenous Australians, with diabetes accounting for 12%.5 For all Indigenous Australians, the self-reported prevalence of diabetes is more than three times, and the incidence of end-stage CKD six times, the non-Indigenous rates.3 In remote Aboriginal communities in the NT, CKD prevalence is up to 25% of the population,4 or 46% of adults.6 Diabetes prevalence is in the order of 13%7 to 16%4 of the population, or up to 29% of adults.6 Both conditions are major contributors to cardiovascular disease, the greatest single contributor to the mortality gap.5

The origins of the chronic disease epidemic in Indigenous populations and, more broadly, the health gap are complex,3,6 and actions addressing both the social determinants of health3,4,7,8 and systematic primary clinical care6,9 are needed. In this study, we focused on the need for systematic clinical care, which is essential to reduce complications and delay the progression of diabetes and CKD.6,9

The rate of avoidable hospitalisations, a key marker of access to and effectiveness of primary care, is highest in remote communities.10 Australian and international evidence shows strong primary care systems result in better health outcomes, lower rates of avoidable hospitalisations, avoidance of dialysis, and significant cost savings.913 Many hospitalisations for complications of diabetes and CKD can be avoided through systematic primary care treatment, with significant medical cost savings.10,1315 However, there are few estimates of the resources required to sustain primary care management of these conditions.

Particular difficulties for remote primary care include isolation, long distances to services, understaffing and a high turnover of clinical staff.16 Remote health care also requires special skills in chronic disease management, acute care, public health and intercultural communication.13,14,16,17

Our study was initiated by an Aboriginal community controlled remote health service because, despite its own perceptions of competent staff and clinical systems, staff still struggled to satisfy existing clinical protocols within given resources. The service received funding primarily from the then federal Office for Aboriginal and Torres Strait Islander Health and the then NT Department of Health and Families. Other sources included Medicare and a small university research grant. The aim of our study was to estimate the resources required by a remote health service to optimally manage diabetes and CKD — with adherence to the local Central Australian Rural Practitioners Association Standard Treatment Manual (CARPA STM) guidelines15 and with full population coverage.

Methods

The study took place between July 2010 and May 2011 in a remote Central Australian community. The methods were adapted from the models of care health service planning approach18 and an earlier NT cost study.10 Using the models of care approach, Segal and colleagues18 began with local best-practice protocols and estimated the staff time required to complete each of the recommended tasks for a given population. The population health status was assessed and the best-practice health care tasks required for that population were defined for each health profession involved. The time required per patient per year for each task was then determined, and the health care staffing resources then calculated for the population. Zhao and colleagues10 used an analogous approach to estimate the total operating costs of a “reasonably efficient” remote Aboriginal health service. Population needs were defined in terms of the CARPA STM protocols.15 The time estimate given in the definition of each linked Medicare Benefits Schedule item was used in quantifying the population’s staffing needs.10

The target population was resident adults (> 18 years of age) with diabetes or CKD. Best practice was defined in terms of the CARPA STM protocols.15 These protocols are used by all NT primary care providers: government clinics and Aboriginal community controlled health services.19 The tasks recommended by the CARPA STM include history taking, health promotion, education, physical examination, biochemical investigations and prescription of medication.15

First, prevalence of diabetes and CKD was estimated using the health service electronic health record, which represents not only patients presenting for diabetes and CKD management but also those identified in community screening. Prevalence at multiple levels of severity was estimated for both conditions. For CKD, levels of severity were stages 1–5 (estimated glomerular filtration rate range, > 90 [stage 1] to < 15 mL/min/1.73 m2 [stage 5]), with early CKD defined as stages 1–3. For diabetes, early was defined as non-insulin-treated and advanced was defined as insulin-treated. This enabled us to calculate, at the community level, the total annual number of diabetes and CKD care tasks recommended by the clinical protocols.

Second, semistructured interviews informed two aspects of the study. Clinicians were asked to estimate the time required for each protocol task, as well as any unremunerated out-of-hours time essential for the chronic disease management program. Clinicians’ descriptions of their role in chronic disease care helped to structure the final staff-funding model and also to identify other barriers to best-practice care.

Third, the daily work and chronic disease consultations undertaken by a cross-section of clinicians were directly observed in a detailed time-and-motion study. We measured the time taken by each clinician for each task defined by the relevant CARPA STM protocol. We then used a combination of these observations and interview data to estimate an average time for each item (such as measuring blood pressure or discussing diet). Supplies were itemised for each protocol and costed using the clinic’s supply orders or representative prices.

Fourth, financial records provided clinicians’ wage rates and administrative fixed costs. The wage rates, together with the estimates of time-per-task and annual community care requirements, were used to calculate the total cost of clinical staffing for primary care of diabetes and CKD.

We considered costs that, while non-clinical, are part of the overall cost footprint of diabetes and CKD care. Using data from direct observation of clinicians’ workdays, we estimated the proportion of total clinical time spent on diabetes and CKD. This proportion was then applied in a top-down fashion to the health service’s non-clinical costs, so that part of the cost of clerical staff and clinic vehicles was attributed to diabetes and CKD. These data collection and cost estimation methods are summarised in the Appendix.

Finally, we compared the estimated 2009–10 expenditure on diabetes and CKD with the projected annual expenditure using our best-practice model, reflecting full protocol compliance. For this, we assessed the level of clinicians’ adherence to the guidelines using the One21seventy health record audit tool, which is widely accepted in Indigenous health services in Australia and is based on the CARPA STM protocols.20 Per capita figures were calculated as total staff hours required for tasks specific to each group (eg, staff hours per patient per week to manage insulin treatment) divided by the number of patients with CKD or diabetes.

We distinguished between costs met out of the health service budget and expenses met directly by the federal and NT governments and other agencies. Examples of the latter are medications provided free to Indigenous patients under s 100 of the National Health Act 1953 (Cwlth), and visiting allied health services. The increased cost of such items in our model of care was separated from any additional funding needed by the health service to provide that model.

For comparison with the study by Zhao et al we adjusted the 2003–04 NT-wide figures for inflation occurring between financial years 2003–04 and 2009–10 (using the Consumer Price Index for health care in Darwin), and only included comparable aspects of our study (eg, insulin treatment was excluded).10,21

Approval was received from the remote community’s health board and the Central Australian Human Research Ethics Committee (ref: 2010.08.07). Written consent was obtained from all individual participants. Verbal and written feedback was provided to the health board at the conclusion of the study.

Results

In this remote community with a population of 542, 519 (96%) were Aboriginal.22 Of the 297 adults, 74 (25%) had diabetes and 86 (29%) had CKD; 45 (15%) had both conditions. Thirty-one adults (10%) had CKD stages 3–5. Of the 74 adults with diabetes, 13 (18%) were prescribed insulin.

The clinic was staffed by four Aboriginal health workers (AHWs), three remote area nurses (RANs), a general practitioner, a chronic disease educator (CDE) and an exercise physiologist. Twelve staff interviews were completed, and 14 workdays and seven clinical consultations were directly observed.

Quarterly chronic disease checks with an AHW or RAN were recommended for most patients with diabetes or CKD. A GP reviewed clinical findings and investigations, prescribed medication where necessary, and oversaw treatment planning. A full-time CDE educated individual patients and groups and managed insulin treatment. Interviewed staff identified education as crucial for patients’ control of their chronic disease. Locating patients in the community and delivering and explaining their medications were also a significant part of clinicians’ work. According to the medical record audit, 75% of all recommended protocol tasks for diabetes management and 79% for CKD were completed in 2009–10. Based on 2009–10 staffing, our model results in 29% of total clinical hours being used for diabetes and CKD care.

The total projected annual primary care cost of clinical management of diabetes and CKD management with full adherence to the protocols for all patients would be $900 792 (Box 1). On average, the annual cost per patient would be $7856, ranging from $4062 (for people with previously diagnosed early CKD without diabetes and without high cardiovascular risk) to $15 241 (for people with stage 5 CKD and advanced diabetes, with a recent diagnosis of either condition) (Box 2). Including only the costs met through the health service-allocated budget, the projected cost to the centre would be $645 313, or $5628 per patient on average, based on estimated total annual direct clinical staff hours specifically for diabetes and CKD of 4226 hours, or 2.37 full-time equivalents. (The difference between the cost to the centre and the total projected annual cost consists of costs met directly by other sources, including the federal and NT governments, rather than through the health service budget.) Expenditure in 2009–10 by the remote health service for diabetes and CKD care was estimated at $446 585, or $3895 per patient (Box 1). The health service would thus require an additional $198 728 (ie, an additional $1733 per patient) for best-practice management of diabetes and CKD. Overall funding received by the health centre in 2009–10 was $3413 per patient.

Interviews with staff identified a number of other barriers to optimal care. The high turnover of RANs necessitated frequent intensive orientation and teaching for new staff. The clinic was also rarely fully staffed. On-call night work, cross-cultural communication and cultural differences can present difficulties for RANs. AHWs may face a conflict of duties and values between the community and the health centre and a heavy responsibility in the role. A high acute caseload and the reticence of many patients to attend checks, for reasons including low health literacy and long waiting times, also hinder adequate management of chronic disease. There is a perceived need to allow more time for clinicians and patients to build relationships and for community-building work.

Discussion

Our study identified a high prevalence of diabetes and CKD in a remote community. As this is the community’s only clinic and the community health screening coverage is high, the clinic-based prevalence approximates population prevalence and is consistent with other remote community studies.4,13

This service is relatively well funded compared with other NT primary care services. Expenditure in 2009–10 was $3413 per capita per annum. The mean per capita figure for NT Government remote clinics for 2011–12 was $2329. This service has a higher than average compliance with the protocols for CKD and diabetes (77%, compared with the territory-wide figure of 73% for clinics participating in the One21Seventy audit). In response to low health literacy and patient mobility, the clinicians engage in very active outreach, health education and opportunistic screening. Most remote communities do not employ a CDE or exercise physiologist.

Despite these positive factors, 2009–10 expenditure was insufficient to provide optimal management by a margin of 44%, or an average of $1733 per patient with diabetes or CKD. Quantitative data were consistent with clinicians’ perceptions at interview that additional staff members were required to work with the CDE and AHWs to adequately meet community needs. Additional staff could increase the crucial quarantining of AHWs’ and RANs’ chronic disease care time from acute care time, possibly contributing to enhanced retention of staff. It would also allow greater allied health coverage, increasing exposure of patients to consistent health messages, and additional informal staff education.

The costs calculated in our study were higher than the inflation-adjusted (2003–04 to 2009–10) NT remote community estimates produced by Zhao et al.10,21 Possible reasons include the conservative estimates by Zhao et al of clinical time needed in remote health services for chronic disease care and staff training, and the higher administrative and salary costs at the studied remote clinic compared with those used in the earlier study.10

Strong primary care systems result in better health outcomes and significant cost savings.9,1113 There is a strong argument for adequate funding of primary care services like the subject of our study. Our findings also highlight the lack of benchmarks that might indicate appropriate levels of funding to meet community needs and provide cost-effective care.

The strength of this study is its rigour and comprehensiveness, using multiple data sources (qualitative and quantitative). However, the methods are resource intensive and replication at other locations or with other disease groups would be expensive. Other limitations include the fact that costs were kept constant in our modelling. It is likely that unit and, possibly, fixed costs will increase as 100% community coverage and adherence to protocols is approached. It may be that 100% coverage and compliance is uneconomical.

Limitations to generalising these findings to other remote Indigenous health centres are the wide variation in transport costs, the availability of allied health care, and the feasibility of indicated insulin treatment given limited staffing resources. The small sample size also means that caution must be taken in generalising the results.

Nevertheless, this community is not unrepresentative of many remote Indigenous communities, and our study provides the best available evidence about the funding gaps for optimal management of two prevalent chronic diseases in such communities. It documents a significant shortfall even in a relatively well funded and effective primary care service, close to the regional centre. We would expect that the documented shortfall is a conservative estimate. These findings should inform funding bodies in their allocation of health resources for remote Indigenous communities. It may also be of use to this and other remote communities in advocating for their health care needs.

1 Estimated 2009–10 and projected annual costs* for the primary care management of type 2 diabetes and chronic kidney disease in a remote Aboriginal community


Annual costs ($)


Category

2009–10

Projected


Remote health centre costs


Clinical staff

228 906

340 392

Remote area nurses and Aboriginal health workers

62 011

68 592

General practitioners

38 799

74 439

Chronic disease educators and visiting dietitians

128 096

197 362

Administrative staff

76 383

108 507

Medical supplies

4079

5795

Other operating costs

137 217

190 618

Maintenance

1240

1762

Vehicles

27 758

35 123

Other supplies

1635

2322

Other administrative (including computers, power)

106 584

151 411

Total

446 585

645 313

Direct costs to federal and NT governments

234 424

255 479

Grand total

681 008

900 792


NT = Northern Territory. * Full coverage and full adherence to protocol. † Includes dental (NT), and optometry, non-vehicle and vehicle capital costs, and medications provided to Indigenous patients under s 100 of the National Health Act 1953 (federal).

2 Total projected annual costs per patient* for the primary care management of type 2 diabetes and chronic kidney disease (CKD) in a remote Aboriginal community, by stage of disease and comorbidity


Cost, by severity of CKD ($)


Condition and case type

No CKD or stage 1–3

Stage 4

Stage 5


CKD without diabetes


New cases

4345

4547

5200

Existing cases


Without high cardiovascular risk

4062

4175

5042

With high cardiovascular risk

4125

Non-insulin-treated diabetes


New cases

4428

4601

5252

Existing cases


Without high cardiovascular risk

4133

4228

5093

With high cardiovascular risk

4196

Insulin-treated diabetes


New cases

14 417

14 590

15 241

Existing cases


Without high cardiovascular risk

14 122

14 218

15 083

With high cardiovascular risk

14 185


* Full coverage and full adherence to protocol. † Dialysis costs excluded.

What can circle sentencing courts tell us about drug and alcohol problems affecting Aboriginal communities?

In New South Wales, circle sentencing courts take place outside of the courthouse, in a more informal community setting. The circle is made up of the magistrate, prosecutor, victim, offender (and his or her supporters), four respected Aboriginal Elders (who are significant to the offender), a representative of the support agencies and a lawyer from the Aboriginal Legal Service. The group talks about the impact of the crime on the victim and looks at the background of the offender and what caused him or her to get on the wrong path. The discussion can last up to 3 hours, after which the group develops a circle sentencing outcome plan, upon which all parties agree. The most important recommendations are made by the Elders. The outcome has to be acceptable to the magistrate. Nowra’s circle sentencing court has been operating for close to 12 years and the magistrate there has never yet disagreed with the Elders. The circle outcomes also need to suit the ability of offenders to comply with the conditions, as we don’t want them to fail.

How the circle relates to the Aboriginal traditional way of dealing with offenders

Up until the 1860s in the Shoalhaven region, we had a council of karadji men to administer tribal law. A locally known karadji man was Johnny Burriman. Keith Campbell wrote of him in the South Coast Register:

The work of Johnny Burriman to gain recognition for an important place for Aboriginal law in the Australian legal system failed, but the issue has remained. A significant step taken appropriately in the Shoalhaven district in recent years has been the introduction of circle sentencing.1

I believe this was a small but significant step towards recognition of the authority of a council of Elders, if not our traditional lore.

The Nowra circle sentencing court provides for sensitivity in reaching a sentence with as much compassion as the crime allows, but without frustrating Parliament’s intention. The justice carried out is a combination of criminal law and traditional values. Whereas the criminal justice system regards crime as something to be punished, Aboriginal people view it as something that requires healing. The regular courts have recently adopted a similar approach: their concept of it is therapeutic jurisprudence.2

How effective has it been?

The greatest achievements of the circle sentencing courts have been bringing down the barriers between the courts and the Aboriginal community, gaining mutual respect and also gaining a great deal of knowledge around the root causes of crime within Aboriginal communities, especially as it relates to alcohol and drug misuse.

The knowledge that has been obtained through open and honest dialogue between the Elders, the offenders and the victims could be regarded as revolutionary. Information is received “from the horse’s mouth” — from the people who have committed the crime, who are experiencing the disadvantages and suffering of alcohol and drug misuse. They are open and honest about it. Sometimes they break down and cry and volunteer insights about their lives. Some circle members even reveal information about themselves for the first time in their lives.

Aboriginal Elders effectively use the Koori way of obtaining comprehensive information from offenders, through the narrative form rather than questions and answers, as it is our cultural way of communicating. The Elders are also very clever in their use of shame: they make the offenders ashamed of their actions rather than of themselves. They say to an offender, “Be a proud Koori: you come from a good family and a rich culture, but you have got to be ashamed of your actions; this is bad”.

Understanding what underlies drug and alcohol problems

It is well known that the underlying causes of crime are unemployment, poor housing, poor education and poor health. As a result of the honest and open dialogue in each circle sentencing case, we have been able to identify some of the further underlying causes of this for Aboriginal people. We have discerned much self-depreciation, low confidence and low self-esteem, derived from 200 years of demonisation by the media and government and only learning about the negativity of Aboriginality. There is also direct trauma from sexual abuse, assault, other types of violence and racism. Being told you are lazy and good for nothing becomes a self-fulfilling prophecy over time. Additionally, there is indirect transgenerational trauma. Many of our offenders are from the Stolen Generations or are affected by family members who were. Aboriginal and Torres Strait Islander people who have been removed from their families often suffer feelings of abandonment and rejection. Their reactions take numerous forms, including anger, grief, loss of identity, alcohol and substance misuse, violence and other socially unacceptable behaviour, problems in relationships, psychological difficulties and isolation. Lack of identity can be linked to mental illness. As Aboriginal people operate on a collective or community level, the extended family is integral to the recovery process. Many often find themselves feeling caught between two worlds — their Koori heritage and the white world they grew up in. This can lead to a sense of not belonging, or feeling unwelcome in either world, with a crippling sense of isolation.

Problems like these need to be taken into account by the court system. This information does not supply the court with an excuse for an offence but it does supply an understanding of the root causes of crime, which is subsequently helpful in developing and delivering crime prevention programs. It is our belief that if clients have the opportunity to work on these problems, it gives them a chance to heal and not repeat the behaviour that led them to the court.

Often Aboriginal people use alcohol and drugs as an anaesthetic for the pain, fear and loss of cultural identity they are experiencing. The “dual diagnosis” which may result does not just refer to clients with hard-core drug problems and schizophrenia. It also refers to clients with a lifetime history of alcohol use disorder and coexisting mental or other drug disorder. The most common mental disorders among offenders with any drug use disorder are anxiety disorders. Some evidence of the intensity of this problem was provided in the 2009 NSW Young People in Custody Health Survey, which found, among other important and disturbing findings, that 92% of young Aboriginal people in custody had a psychological disorder and 83% were risky drinkers.3 Young Aboriginal people make up 49% of the juvenile population in custody.4 Drug and alcohol problems are not easy to overcome if you don’t know much about the causes. Service providers can learn more about the underlying causes of this problem and how to deal with them by participating in cultural awareness training.

After the circle — providing care

In circle sentencing courts, most offenders, and particularly those who commit the more serious offences, are people with a dual diagnosis. This is where the crime problem really becomes a health problem. To deal with it, Justice Health provides liaison nurses who work in courts and corrective services. We also have drug courts to deal with drug-addicted criminals. However, there still appears to be a problem in dealing with offenders with dual diagnosis, mainly because they don’t recognise or accept their illness. Within our Koori communities, there is a stigma around mental illness that leads to self-medicating with illicit drugs. There are also cultural barriers in accessing mental health services in NSW. Clients move between drug and alcohol and mental health services, and dual diagnosis clients are at risk of falling through the gaps. Most importantly, we need a model to promote community-based recovery rather than reliance on inpatient services, as Aboriginal people won’t remain away from their families for long periods of time.

Overcoming the root causes of drug and alcohol use and resultant crime

We need to develop wellbeing programs that focus on physical, psychological, spiritual and personal wellbeing, so that offenders are able to overcome their drug and alcohol dependency and move on to employment, housing, education and good health. We need to tackle the root of the problem if we are to break the cycle of welfare dependency and drug taking that ends in crime and despair.

In a circle, Elders can only direct offenders to do something about their problems; but these directions are taken seriously by the offenders because they are delivered by their respected Elders. However, Aboriginal and mainstream support services are needed to assist offenders to heal afterwards. Aboriginal organisations act as a link between clients and professional and mainstream services and are able to advocate, refer and liaise as necessary. But mainstream services can be limited by a lack of resources and training of support workers about the cultural and communication barriers that prevent them from working effectively with Aboriginal offenders. Some of our clients have experienced judgemental and patronising staff, including psychiatrists, psychologists, drug and alcohol counsellors and general health workers, who have lacked patience, empathy or cultural insight. Cultural bias still remains in the literature of psychology. We need culturally appropriate training for service providers — training that takes into account our differences in experiences, ways of communicating, values, kinship and families, along with insight into healing that recognises the impact of transgenerational trauma, our history and experiences on the current life situations of our people. At the end of the day, our clients have to access these mainstream services. If we fail in these areas, what good are all the efforts we put into getting our people to these services in the first place?

The need for additional support and training

I believe that the programs and training I am calling for represent the way forward. We need to train those who work in mainstream services to be competent when dealing with our people. In the criminal justice system, we are mostly dealing with Aboriginal people with very poor education who are often isolated from the rest of society. In the past, Aboriginal people were denied an education in Standard English and were only taught a modest amount of the English language, from which developed Aboriginal English. This language is still spoken frequently within Aboriginal communities. There is also the matter of poor health to contend with.

Although there is no one solution to the problem of crime, we have to try a combination of what is working in some areas. We need circles accompanied by cultural programs and specialist counsellors to help our people deal with dual diagnosis and trauma. Men’s group programs such as Red Dust Healing (http://www.thereddust.com) and Rekindling the Spirit (http://www.rekindlingthespirit.org.au) are very effective. The Waminda women’s organisation health and wellbeing program is also very effective for Aboriginal women.5 We need to promote pride in Aboriginal identity and culture, based on the belief that this is central to the health and wellbeing of our people and that knowing who you are as an Aboriginal person is central to any positive life. We also need to forge strong partnerships between organisations and agencies so that our clients don’t fall through the gaps.

Conclusion

When we lost our lore and important cultural and traditional way of life, we reached a point where we began to normalise abnormal behaviour such as substance misuse. This is not our traditional way. It is happening mainly because we have lost our structural system of learning and control. Circle sentencing operates on the understanding that the underlying causes of crime are often broader than a single incident and that they need the active participation of the whole community to fix them.

Circle sentencing highlights a need to develop effective cultural programs that educate our people about the positive aspects of our culture and Aboriginality and enable us to take pride in ourselves. These programs should improve the overall health standards of our people by promoting social and emotional wellbeing, acknowledging culture and identity as pivotal in reaching positive outcomes, and prioritising wellbeing as a vital foundation for belonging and identity. Service providers also need to be educated about Aboriginal communication styles, to ensure equality of access to justice and health services. Courts in NSW have developed a program to overcome this problem at a grassroots level, by employing Aboriginal client service specialists in local courts to service Aboriginal clients directly at the counter, in the registry and in the courtroom. Their most important and demanding task is interpreting court rulings. Only when all of these initiatives are put in place will the statistics on our people coming into contact with the criminal justice system begin to decrease.

Above all, the circle teaches us the need to recognise that the past still affects us today. The trauma and dispossession of colonisation compound the harmful effects on our health and culture. The summary statement of the International Symposium on the Social Determinants of Indigenous Health identified colonisation of Indigenous peoples as a central and undeniable causal factor in ill health.6 Colonisation has resulted in the decimation of much traditional Indigenous culture and customary practices, rituals and systems, particularly for Aboriginal people living in urban and regional areas (Mary Goslett, Masters student, Australian College of Applied Psychology, unpublished research paper).7

We are behind the eight ball when it comes to economic and social status. It is only very recently that our culture has begun to be celebrated and accepted to an extent that will assist our next generation to take pride in themselves as Aboriginal people of this country. Reconciliation is the way forward for us, but it will take time and a lot of effort on both sides to reconcile our differences. Circles, I believe, are reconciling our differences within the criminal justice system. Thoughtful and intelligent people from all walks of life will continue to make true reconciliation happen in this country.

Can we sustain health spending?

Australian governments currently spend relatively little on health. Are cutbacks really what’s needed?

The assertion that health spending is unsustainable has been made with remarkable regularity, most recently by the Federal Minister for Health, Peter Dutton.1 Despite publication of a major review by the National Health and Hospitals Reform Commission2 less than 5 years ago, the Minister has called for a far-reaching debate about the health system.3 Consistent with the rhetoric, the recent federal Budget has introduced copayments and foreshadowed cutbacks that are expected to reduce federal health spending by $8.6 billion over the 4-year forward estimates.4

The evidence usually cited to demonstrate the unsustainability of health spending is its impact on government finances. Between the 2001–02 and 2011–12 financial years, health expenditures by all levels of government rose from 19.8% to 25.6% of total tax revenues,5 and projections by the National Commission of Audit prior to the recent Budget suggested that federal spending alone could rise from $65 billion in 2013–14 to over $120 billion in 2023–24.6 These trends are commonly linked to the ageing of the population to conclude that significant structural reforms are needed to reduce spending on health services, and the recent budget measures may be seen as a first step in this direction.

Despite these projections, the unsustainability thesis is remarkably weak. Economies are flexible and the composition of spending varies significantly over time and between countries. At the time of federation, agriculture, manufacturing and the services sector accounted for 19%, 12% and 31% of gross domestic product (GDP), respectively. By 2011–12, the shares were 2%, 6% and 56%, respectively.7 Technological change reallocates resources, and the expansion of industries is usually seen as desirable because it employs the displaced workforce and generates additional benefits. The anomalous concern with the costs and not the benefits of an expanding health sector implies comparative lack of concern or confidence in the benefits despite evidence that better health is one of the diminishingly few ways in which we can improve the quality of life of the population.

The flexibility of economic systems is also apparent when countries are compared. Australia currently devotes 9.5% of GDP to health, while the proportion in the United States has reached 17.7% (Box). The efficiency of the US health system may be questioned, but there is no suggestion that it has impaired the economy or sapped the vitality of the country.

The US case is interesting for another reason. Despite having the largest health expenditures in the world, when compared with the wealthy countries of the Organisation for Economic Co-operation and Development (OECD) the proportion of the population above the age of 65 years in the US is the smallest. In contrast, the country with the oldest population – Japan – spends little more than the OECD average on health. This illustrates a common error: the belief that health spending is tightly linked to the demographic structure and that ageing necessarily drives health expenditures. Historically, this has not been true, as health expenditures have been driven by technology and the increasingly generous provision of health services as GDP rises.12

Nevertheless, the pressure from ageing is likely to intensify. By 2050 the proportion of the population above 65 years of age in Australia is likely to rise from 14% to 22% and the proportion over 80 years to double from 4% to 8%.8 The pressure is likely to be exacerbated by expensive health technologies targeting individuals rather than broad disease categories. However, even with the slowing in the rate of per capita GDP growth to the average 1.4% per annum that occurred between 1970 and 1990, by 2050 GDP per capita will expand by 65%. Even if total health expenditures rose to the US level of 17.7% of GDP there would be an expansion of non-health-related per capita GDP of 50%, which could be devoted to the improvement of the material standard of living. This is not a paradox. Even if GDP grows more slowly than health expenditures, the absolute (not percentage) increase will be greater than the absolute increase in health expenditures. A 65% rise in GDP from a (index) base of 100 will increase resources by 65 points. A 200% rise in health expenditures from a (index) base of 9.5 increases resource use by 19 points. Resources for other uses would rise by 46 points. Given the evident sustainability of health spending for some decades, it might be asked why health has been targeted for cutbacks. At 6.6% of GDP, public health expenditures by all governments in Australia are the tenth lowest of the 33 countries in the OECD database and the lowest among wealthy countries in the group (Box). Even US governments, which channel 8.3% of GDP into public health programs, outspend Australian governments. Further, as indicated in the Box, Australia has been relatively successful in restraining the growth of health spending.

A possible reason for the Minister’s concern is that, irrespective of comparative statistics, health spending in Australia — or public health spending in particular — may be inefficient. For example, a survey by Runciman and colleagues13 found that compliance with indicators of appropriate care was highly variable as judged by a retrospective review of medical records and telephone interviews with at least 1000 Australians. However, neither this nor the many other problems with the organisation and provision of services are likely to be resolved by increased copayments or reduced public spending. Both options would increase pressure for private health insurance (PHI) to cover the gap, and there is little or no evidence that private insurers would be more willing than the public sector to undertake the reforms needed to improve the quality of care. In principle, managed care might be used by private health insurers to achieve this goal, but the evidence of its success is limited and it appears unlikely that this is an option that Australian governments would be prepared to pursue, at least in the short run.

It is possible that copayments are seen as a way of controlling total costs; however, the effect of the recent budgetary measures on economic costs — resource use — will be miniscule. Evidence unequivocally indicates that copayments have a relatively small effect on service use. The $6 copayment initially proposed by the Australian Centre for Health Research14 was estimated to reduce service use sufficiently to save $750 million over 4 years — 0.3% of federal health spending, 0.14% of total health spending. The greater part of the 4-year federal budgetary saving of $5.5 billion on Medicare Benefits Schedule items and $866 million from the Pharmaceutical Benefits Scheme will therefore be a result of cost shifting to the public, not reduced service use. However the burden of private spending falls unevenly on the public: it self-evidently falls on the sick. Bulk-billing primarily assists those who are on a low income. The principle effect of its elimination will be a redistribution of income from this group to the healthier, wealthier members of the community. Copayments will, additionally, divert patients from lower-cost general practitioner care to higher-cost outpatient care. Those who defer needed treatment are likely to eventually need more expensive specialist care.

Perversely, in the longer run, eliminating bulk-billing is likely to increase GP fees and expenditures by reducing competitive pressures. An increase in the copayment from $7 to $10 is less likely to adversely affect an individual GP practice than the cessation of bulk-billing and the initial introduction of a copayment. Inflation of fees will be accelerated when the government succumbs to pressure to allow PHI to cover the widening gap. Increased GP fees may be independently desirable given the low level of GP incomes — the lowest relative to average wages listed by the OECD after Estonia and Hungary. However, a more equitable remedy would be to increase, not decrease, the rebate.

Reduced budgetary expenditures are not a necessary response to unsustainable spending or a solution to demonstrated inefficiencies. Rather, they are a response to budgetary pressures arising from inadequate tax collections and the failure of successive governments to implement suggested reforms. The 26.5% of GDP raised by all forms of taxation in Australia in 2012 was the fourth lowest of the 34 OECD countries after Chile, Mexico and the US. Proportionally, Northern European countries collect 40%–75% more than Australia. The result of lower taxation is lower levels of community services and infrastructure, and a long-term structural problem for government finances — outcomes which are strikingly evident in the US.

The damage to be inflicted on the health sector by reduced public spending is part of the price Australians will pay for the persistent failure of government to address this problem and to raise taxation to a level that allows improvement in the economic infrastructure, better community services and spending on all of the health services which — after careful evaluation — have been shown to provide cost-effective health benefits to the Australian community.

Health spending, older population and taxes for selected countries

Total health spending*


Public spending


Population aged 65+*


Taxes


1980 (% GDP)

2011 (% GDP)

PP increase

2012 (% total)

2011 (% GDP)

2011 (% total)

2012 (% GDP)


Australia

6.1%

9.5%**

3.4

69.7%**

6.6%**

13.7%

26.5%††

France

7.0%

11.6%

4.6

76.9%

8.7%

17.1%

45.3%

Canada

7.0%

11.2%

4.2

70.1%

7.4%

14.7%

30.4%

Japan

6.4%

9.6%

3.2

82.5%

7.8%

23.3%

28.6%

Sweden

8.9%

9.5%

0.6

81.7%

7.7%

19.3%

44.2%

Netherlands

7.4%

11.9%

4.5

79.8%

9.5%

15.9%

38.6%

United Kingdom

5.6%

9.4%

3.8

82.5%

8.1%

16.2%

35.7%

United States

9.0%

17.7%

8.7

46.4%

8.3%

13.2%

24.0%

OECD

6.6%

9.3%

2.7

na

na

15.4%

34.1%


GDP = gross domestic product. PP = percentage point. OECD = Organisation for Economic Co-operation and Development. na = not applicable. AIHW = Australian Institute of Health and Welfare.

* OECD.8 † OECD.9 ‡ World Bank.10 ¶ OECD.11 ** AIHW.5 †† 2011 figure, as 2012 figure was not available.

Guidelines fall short on bariatric surgery

In reply: I appreciate the opportunity to respond to McCallum’s defence of the National Health and Medical Research Council (NHMRC) guideline development process, and appreciate the revisions that were made to the current version. With my general practice background, I understand that the 656-page systematic review will not be considered in clinical practice, but I do know that the text within the guidelines will. And unfortunately that text did not reflect either the established literature or the systematic review. I found the text regarding bariatric surgery flawed throughout, with issues not restricted to nutritional support. There were multiple statements with no evidence base, which of course means they could not be referenced, and two statements where cited references did not support the statement made.

I strongly suggest that the NHMRC carefully reviews its process as described in the letter above. There is limited value in this rigorous process if it delivers a flawed and potentially dangerous outcome. The expert multidisciplinary committee clearly lacked specific expertise in bariatric surgery, and the consultation phase failed to seek appropriate expert advice.

Register4: an Australian web-enabled resource created by the National Breast Cancer Foundation to facilitate and accelerate cancer research

To the Editor: Register4 is an online register of Australian men and women that aims to reduce the costs and time involved in recruitment for cancer research studies by matching researchers with willing participants, harnessing the speed and reach of the internet. An initiative of the National Breast Cancer Foundation, Register4 was launched in 2010 and is modelled on the US Army of Women (http://www.armyofwomen.org) and the Australian Twin Registry.1 To date, there are nearly 40 000 members (> 96% women) with a broad demographic representation: aged from 18 to over 70 years (most 30–59 years); residing in all states and territories (most in New South Wales, Victoria and Queensland); and 80% born in Australia. The membership is highly motivated to participate in research: over 20% of members are willing to provide DNA samples or participate in a clinical trial, and nearly 15% are willing to provide a sample of breast tissue.

Data on lifestyle and family health history (including reproductive history, history of breast or other cancers, and chronic illness) have been collected for more than 20% of members through the online EPI-Q Health and Lifestyle Questionnaire. Of the more than 7300 members who completed the EPI-Q, 20% have a prior history of breast cancer, and 75% have no history of any cancer. Other chronic health conditions covered by the questionnaire include asthma (20% of members), high blood pressure (16%), and osteoarthritis and osteoporosis (12%). Over 60% of participants have never smoked.

To contact Register4 members or access their data, cancer researchers join Register4 as a researcher member, then submit proposals to the Register4 Access Committee for approval. All projects must be fully funded and approved by a human research ethics committee (HREC). The operation of Register4 has HREC approval.

To date, Register4 has been used to recruit participants for 18 cancer research projects, involving nearly 13 000 members. Ample and appropriate participants were recruited within days — dramatically faster than conventional recruitment, which typically takes years.

More information about Register4 can be found at the website (https://www.register4.org.au) or obtained via email (info@register4.org.au) or by telephone (1300 709 485).

Doctor, do you have a moment? National Hand Hygiene Initiative compliance in Australian hospitals

Hand hygiene is accepted as the cornerstone of preventing infection. Thus, the maxim “first do no harm”1 should translate into the habitual practice of hand hygiene by health care workers (HCWs). In 2009, under the National Hand Hygiene Initiative,2 Australian hospitals embarked on a hand hygiene program developed around the World Health Organization program, Five Moments for Hand Hygiene.3 The “five moments” refer to the five indications for hand hygiene associated with interactions between HCWs, patients and the environment around patients. The moments are summarised in Box 1.

From 2010, mandatory quarterly reports of rates of compliance with the Five Moments program became embedded as a measure of patient safety for all Australian public hospitals. Another measure of patient safety is the rate of Staphylococcus aureus bloodstream infection (SABSI). These two rates are considered to be causally linked and are reported on the MyHospitals website4 for public scrutiny.2 Hand Hygiene Australia (HHA) reported the program a success with improvements in hand hygiene and reductions in the rate of methicillin-resistant SABSI.2 When we examined the HHA website (www.hha.org.au) for evidence of further improvements in hand hygiene compliance from the third quarter of 2010 to the first quarter of 2013, we found unremarkable changes in the national rate — 8.6 percentage points (PP) improvement (76.9% compliance by the first quarter 2013) or < 4 PP improvement per year for total compliance and 9.5 PP improvement (72.6% compliance by the first quarter 2013) or < 4 PP improvement per year for before touching a patient (Moment 1).

Our overall aims in this study were to test whether hand hygiene rates reported by HHA had translated int

  • improvements at the hospital level for medical and nursing staff and for before touching a patient during the first quarter of 2013; and
  • decreased rates of SABSI.

Methods

We analysed three datasets. The first was provided by HHA and comprised data on 82 public hospitals with more than 100 beds, contributing a total of 246 665 hand hygiene opportunities during the first quarter (1 January to 31 March) of 2013. Data were linked to hospital size (number of beds) and location (state or territory). Data included numerator data for each of the five moments (compliance) and denominator data (number of moments observed) for 34 hospitals with > 400 beds, 14 hospitals with 301–400 beds, 20 hospitals with 201–300 beds, and 14 hospitals with 101–200 beds. Participating hospitals comprised 30 from New South Wales, 19 from Queensland, 17 from Victoria, seven from South Australia, five from Western Australia, two from the Northern Territory, one from the Australian Capital Territory and one from Tasmania.

The second and third datasets were extracted from the MyHospitals website,4 where SABSI and hand hygiene rates are mandatorily reported as two separate datasets. We chose SABSI data for 1 July 2011 to 30 June 2012 from the three largest states (NSW, Queensland and Victoria) to improve the power of the analysis, and hand hygiene data for the same three states, for the third quarter of 2011 to the second quarter of 2012.

Our ethics committee deemed that our analysis and publication of previously collected de-identifiable hand hygiene compliance data that are publicly available did not require ethics approval.

Hand hygiene compliance for doctors and nurses

The questions we aimed to answer were:

  • What is the level of compliance for medical staff and nurses in hospitals of different sizes and in the three largest Australian states? and
  • Could nurses’ compliance bias the average national rate or average rate for hospitals of different sizes?

From the hand hygiene data for all five hand hygiene moments provided by HHA, we calculated the proportions of compliance and the margin of error for each estimate using 95% CIs for medical and nursing staff for all 82 hospitals. The rates and margins of error for medical and nursing staff were presented by hospital size and location (state). The potential for rates to be affected by the Hawthorne effect (changing hand hygiene compliance because you are being watched) precludes the need for proportions to be presented to one decimal place; proportions were rounded up at 0.6 and rounded down at 0.5.

The PP differences between the medical and nursing staff rates for each hospital size and for NSW, Queensland and Victoria were examined, and significant differences were tested with the χ2 test. Each of the 82 hospitals sampled different proportions of medical and nursing staff. If nurses are sampled more frequently and have higher compliance rates than medical staff, the average crude hospital rate for hospitals of different sizes may be biased. Therefore, the rate for each hospital size was adjusted for the sampling fraction and the adjusted average rates were compared with unadjusted rates for PP differences and tested for significance using the χ2 test.

Hand hygiene compliance for hospitals

The questions we aimed to answer were:

  • What proportion of hospitals have compliance below (< 70%) and at or above (≥ 70%) the national threshold for before touching a patient?
  • How biased is the average compliance rate for before touching a patient in each hospital size by the proportion of hospitals with high compliance?

It is accepted globally that HCWs have poor hand hygiene associated with perceived “clean” touches (Moment 1) and better compliance with hand hygiene performed as self-protection (Moments 3, 4 and 5). Therefore we choose before touching a patient (Moment 1) to categorise hospital compliance into below, or at or above the national threshold of 70%.

The frequency of observations for before touching a patient was uniform across the hospital sizes and is performed three to four times more frequently than the other indication for hand hygiene that directly benefits the patient, such as before a procedure (Moment 2; Box 2). We provided the average aggregated compliance rate for before touching a patient with a margin of error (95% CI) for the total number of hospitals of each size. We calculated the proportion of hospitals categorised into the two compliance levels to determine which category of compliance influenced the average rate for before touching a patient in each hospital size. To illustrate the wide variation in performance from the average hand hygiene compliance rate within each hospital size, we calculated the rate of compliance for the hospital with the highest compliance rate and the one with the lowest rate in each hospital size.

Rates of Staphylococcus aureus bloodstream infection

The question we aimed to answer about SABSI was:

  • Is there a strong inverse relationship between hand hygiene and SABSI rates in the three largest Australian states?

SABSI data were extracted for the reporting periods between 1 July 2011 and 30 June 2012, and hand hygiene rates (for all hand hygiene moments) were extracted for periods that were closest to the SABSI reporting period and averaged the third quarter of 2011 to the end of the second quarter of 2012. There were 322 public hospitals in Australia with more than 100 beds; we extracted data for 200 NSW hospitals, 46 Queensland hospitals and 76 Victorian hospitals.

The generalised linear model for the Poisson distribution was applied to calculate incidence rate ratio between SABSI and hand hygiene rates (with SABSI considered the dependent or outcome variable). In the generalised linear model, the variable bed-days was considered the offset variable and state of residence was used as a factorial or explanatory variable. Analyses for all aims were performed using Stata statistical software, version 11 (StataCorp). The exact binomial distribution was used to calculate 95% CIs for compliance for doctors and nurses and compliance for hospitals. Significance was set at the 5% level.

Results

Hand hygiene compliance for doctors and nurses

Hand hygiene rates for medical staff in hospitals of all sizes were consistently below the threshold, and ranged from 61% to 68% across the three states while nurses’ compliance ranged from 77% to 84% (Box 3). Compliance for medical staff was 17 to 18 PPs lower than that for nursing staff regardless of hospital size. After adjusting for the effect of differential sampling of high-performing nursing staff in 82 hospitals, the average adjusted total compliance fell by 5 PPs from 76% to 71%. The adjusted rate for the two largest hospital sizes (> 400 beds and 301–400 beds) fell 4 PPs to 71% (Box 4).

Hand hygiene compliance for hospitals

Compliance at 56 of the 82 hospitals (68%) was below the national threshold of 70% for before touching a patient (Box 5). The lowest compliance rate for > 400-bed hospitals was 55% and for 301–400-bed hospitals was 49%. When hospitals performed at or above the national threshold, the compliance were well above the national threshold. The highest compliance rates were 81% for > 400-bed hospitals, 78% for 301–400-bed hospitals, 87% for 201–300-bed hospitals, and 86% for 101–200-bed hospitals. A small number of hospitals with high compliance rates inflated the average compliance rates for each hospital size to reach or surpass the threshold (Box 5).

Rates of Staphylococcus aureus bloodstream infection

The average hand hygiene compliance rate for the reporting period ranged from 48% to 99%, while the SABSI rate ranged from 0 to 2.95 cases per 10 000 bed-days. Statistically, the association between hand hygiene and SABSI rates was significant for NSW only (P < 0.01), while the relationship was weak (incidence rate ratio, 0.97).

Discussion

We found that compliance by doctors was uniformly lower than that by nurses. Once adjustments were made for the inflation effect from oversampling high-performing nurses and a small number of high-performing hospitals, the average rates at the national and hospital levels were lower than those currently reported. The adjusted national average rate was 5 PPs lower than the crude rate. It is inaccurate to say hospitals on average meet the national threshold when medical staff, nationally, performed below the hand hygiene compliance threshold. Additionally, between 57% and 71% of all HCWs from our 82 Australian hospitals have hand hygiene compliance rates below the national threshold, regardless of hospital size, for before touching a patient.

We estimate that the cost of taking nurses away from clinical duties to act as auditors and to collect 246 665 hand hygiene moments over the 3-month auditing period in 82 hospitals, at 2.2 minutes per moment and up to $50 per hour, is $561 152 (authors’ personal experience, and Anna Thornton, Director of Nursing, Liverpool Hospital, personal communication) or $2.2 million per year. The initiative resulted in an average improvement of 1 PP per year in hand hygiene compliance after adjusting for sampling. Nevertheless, it can be rightly argued that the program has raised national awareness. But rates at the hospital level are not yet reliable, and to improve reliability, each hospital must record at least 1750 observations for each of five main HCW groups (doctors, nurses, allied health workers, medical students and nursing students), a total of 8750 observations. The estimated burden on each hospital is 320 hours and $16 000 every quarter.

One of us (M L M) is an adviser to the World Health Organization First Global Patient Safety Challenge — Clean Care is Safer Care, and we are committed to improving hand hygiene compliance. Our critical review of the audit data signals that it is now time to move from our obsession with auditing to the next phase — targeting practice and HCWs to effect change.5

The targeted intervention, focusing on the HCW group needing most assistance, which is currently doctors, should focus first on Moment 1 of the WHO’s Five Moments for Hand Hygiene3before touching a patient — before moving on to the remaining moments. The barrier to compliance with perceived “clean” interactions (such as before touching a patient and before a procedure) is HCWs believing they do not need to protect themselves from a clean touch and therefore do not need hand hygiene.6,7 This is supported by poor rates globally for compliance with these two hand hygiene indications.8

Until auditing is universally automated, we recommend the strategies listed below.

  • Focusing the campaign message on one moment at a time, commencing with before touching a patient.
  • Focusing on one HCW group at a time, starting with medical staff.
  • Designing an intervention to enable all health care workers to ask “Doctor, do you have a moment?” if doctors are not observed by any colleague to perform hand hygiene before touching a patient.
  • Having auditors help staff by interrupting them and respectfully reminding them to perform hand hygiene before touching patients, thus making auditors agents for behaviour change.
  • Changing the focus of auditing to documenting the number of times staff were reminded to perform hand hygiene as opposed to the previous method of not intervening and documenting the non-compliant moment.
  • Having hospitals record at least 1750 observations per quarter to achieve reliable rates for a single HCW group, focusing on a single HCW group at a time, starting with medical staff and preferably using a “roving sentinel wards” approach (eg, intensive care unit, orthopaedic and other surgical wards, a general medical ward or neurological ward) to saturate the staff with the targeted message (using one moment at a time, starting with before touching a patient).

The poor relationship between SABSI and the average hand hygiene rate suggests that the causal link between the two patient safety indicators is weak.9,10 Possible reasons for this include SABSIs being statistically rare events and currently reported hand hygiene compliance rates being inflated by a small number of high-performing hospitals, but there actually being insufficient compliance at most hospitals to influence the acquisition of SABSI.

We believe that before touching a patient is an appropriate moment on which to focus a hand hygiene behaviour change program as it is consistent with patient safety and the maxim “first do no harm”.

1 Five moments for hand hygiene3

Moment

Hand hygiene opportunity


1

Before touching a patient, such as when shaking patient’s hand, helping a patient to move and before a clinical examination.

2

Before procedures performed on the ward such as, oral/dental care, aspiration of secretions, wound dressing, catheter insertion and giving medications.

3

After potential contact with body fluids, such as during oral/dental care, aspiration of secretions, drawing and manipulating blood, clearing up urine or faeces, and handling waste.

4

After any non-procedural contact with a patient.

5

After contact with a patient’s surroundings such as bed linen, curtains and patient equipment.

2 Frequency of moments of hand hygiene observed nationally for 1 January to 31 March, 2013

Hospital size (no. of beds)

No. of hospitals in stratum

Total no. of moments observed

Frequency


> 400

34

142 910

28% Moment 1


8% Moment 2


11% Moment 3


30% Moment 4


23% Moment 5

301–400

14

38 774

30% Moment 1


9% Moment 2


12% Moment 3


31% Moment 4


18% Moment 5

201–300

20

42 484

29% Moment 1


8% Moment 2


10% Moment 3


30% Moment 4


23% Moment 5

101–200

14

22 497

28% Moment 1


7% Moment 2


10% Moment 3


29% Moment 4


25% Moment 5

3 Compliance rates for all five hand hygiene moments by doctors and nurses for 1 January to 31 March 2013, by hospital size nationally and by the three largest Australian states

Hospital size or state

No. of hospitals

Compliance rate (95% CI)


Percentage point difference between doctor and nurse compliance

P

Doctors

Nurses


Hospital size (no. of beds)


> 400

34

63% (62%–64%)

80% (80%–80%)

17

< 0.01

301–400

14

62% (61%–64%)

79% (79%–80%)

17

< 0.01

201–300

20

65% (64%–66%)

82% (82%–82%)

17

< 0.01

101–200

14

65% (63%–66%)

83% (82%–83%)

18

< 0.01

State


New South Wales

30

65% (64%–65%)

84% (83%–84%)

19

< 0.01

Queensland

19

61% (60%–62%)

79% (79%–80%)

18

< 0.01

Victoria

17

68% (67%–70%)

77% (77%–78%)

9

< 0.01

4 Unadjusted and adjusted total hand hygiene rates by hospital size for 1 January to 31 March, 2013

Hospital size (no. of beds)

Unadjusted rate

Adjusted rate

Percentage point difference


> 400

75%

71%

4

301–400

75%

71%

4

201–300

77%

72%

5

101–200

78%

72%

6

All

76%

71%

5

5 Margin of error for the current hand hygiene compliance rates for Moment 1 (before touching a patient) collected during 1 January to 31 March, 2013 by hospital size

National threshold (70%) compliance by hospital size

Proportion of hospitals (no. of hospitals at compliance levels/total number of hospitals)

Moment 1 rate (95% CI)
(no. of Moment 1 complied/total Moment 1 observations)


Average compliance rate for the hospital size (95% CI)

Highest compliant hospital

Lowest compliant hospital


> 400 beds


At or above threshold

29% (10/34)

81% (79%–83%) (1256/1557)

55% (51%–59%) (375/682)

70% (67%–73%)

Below threshold

71% (24/34)


301–400 beds


At or above threshold

29% (4/14)

78% (76%–80%) (1485/1902)

49% (45%–53%) (300/608)

70% (67%–73%)

Below threshold

71% (10/14)


201–300 beds


At or above threshold

30% (6/20)

87% (84%–89%) (568/653)

56% (50%-62%) (158/284)

75% (70%–77%)

Below threshold

70% (14/20)

101–200 beds


At or above threshold

43% (6/14)

86% (83%–89%) (385/447)

69% (63%–74%) (174/253)

75% (70%–79%)

Below threshold

57% (8/14)


Copayments for general practice visits

How do general practitioners view this possible change in financial arrangements?

There are reasons why it may be tempting to think that imposing a copayment for visiting a general practitioner is a good idea. It could instantly reduce the number of GP consultations, perhaps conserving funds for a possibly threatened Medicare. As GPs are “gatekeepers”, and therefore a bottleneck to accessing specialist services, fewer GP services might mean fewer downstream services. It might also be one of several means of reducing overdiagnosis.1 But is it really this straightforward?

Copayments are not new to health: we already encounter them between Medicare and specialist services, between the Pharmaceutical Benefits Scheme and medicines, and between health insurance and private hospital charges. On this basis, insisting that GP services should be “free” seems to devalue GPs. Why should GP services be shouldered with a bargain price while nearly all others charge more? Indeed, many GPs already charge their own “copayment” — arguing (in addition to the obvious pecuniary benefits) that patients will consequently value their care more. Moreover, most GPs are aware that some visits from patients are unnecessary, involving something that could easily have been managed at home, such as a self-limiting acute respiratory infection.

In assessing whether a GP copayment would alleviate any of these problems, there are several key questions to consider — what are the disincentives to visiting a GP; how should we define necessary consultations; and how do we continue to ensure equitable access to health care?

Although a meta-analysis of copayments for pharmaceuticals by the RAND Corporation showed that about 2%–6% of system costs are deterred for every 10% increase in copayment,2 some commentators challenge the idea of extrapolating this to copayments for consultations.3 The converse is apparently not true: making GP visits free for people aged over 70 years in Ireland in 2001 did not cause an increase in GP visits in this group.4 There are already many other disincentives to going to a GP — ringing to schedule an appointment, arranging transport to get there, and the seemingly endless waiting. Thus, for many people, especially the financially secure, a $6 copayment would be a relatively minor disincentive in comparison.

Another difficulty lies with defining “necessary” consultations. Many GP consultations can be summarised as “reassuring the patient”. Are these necessary or not? Helping patients understand that their symptoms can be self-managed is certainly something that does require a consultation. In teaching communication skills to medical students, we spend time emphasising the patient-centred approach — with its evidence of health benefits5 — which starts with eliciting the patient’s concerns, fears and expectations. Indeed, without first knowing and addressing these, it can be impossible to stem an ever increasing tide of future consultations and investigations.

Universal access to primary care is one of the essential aspects of our Medicare system and is one of the things that keeps the quality of Australian health care high.6 Among the GP consultations that a copayment would reduce, it is therefore important to consider how many would actually have been necessary. The opportunity for early detection of serious illness may be lost if a person delays or avoids a GP visit because of the copayment. Vulnerable groups, including children, Indigenous people, older people and the financially disadvantaged, may delay seeking treatment for serious illness — or even serious worry — with consequent health compromise. A study in the United States found that doubling primary care copayments from $7 to $14 halved the attendance of people aged 65 years or older, but more than doubled the cost of their inpatient hospital care, from $150 to $330.7

A $6 copayment would undoubtedly deter some people who should visit a GP from doing so, thereby harming them, while others who can afford to pay would be barely inconvenienced. Although a copayment might save a little money in the short term, it would impoverish us all — not just by the downstream increase in specialised health care68 and the harm done by missed serious illness and missed opportunities to properly reassure patients, but morally as well.

Consumers and copayments: implications for health and Medicare

Speculation that the federal government is to introduce a general practitioner copayment into Medicare arrangements persists. Whatever the basis of such speculation, the spate of commentary and media reports feeds a sense that the time for change in Medicare is upon us: a recognition that the status quo is under strain for political, economic and health system reasons.

The suggestions for reaping payments from patients include a widely applied $6 copayment, a means-tested copayment that would vary depending on the patient’s concession eligibility, and a 15% cut to Medicare rebates for general practice patients in inner metropolitan areas. Such proposals heighten the tensions facing the government in its hunt to reduce spending without hurting patients or, God forbid, voters.

In an important sense, this is a welcome development. The debate about a sustainable health system is one that failed to flower during the last health reform foray. Now, at least, the community is being encouraged to consider the personal implications of rising health care costs.

The Consumers Health Forum (CHF) this year commissioned health costs researcher Jennifer Doggett to examine copayments. Her report found, among other things, strong evidence that copayments result in decreased access to health care, with no evidence for overall cost savings.1 Similarly, a study into the 2005 increase in Pharmaceutical Benefits Scheme copayments found a significant decrease in dispensing volumes, particularly for concession patients.2

Failure to get timely care from a GP can prove expensive for both patient and taxpayer. The Productivity Commission found that 600 000 to 750 000 public hospital admissions a year could be avoided by effective community care in the 3 weeks before hospitalisation3 — an intervention that could typically reduce initial costs by more than $4000 per patient.

Doggett cites reports by institutions including the Australian Institute of Health and Welfare and the Commonwealth Fund in the United States, which show the high and rising rate of copayments individuals already make to their health care in Australia.4,5 In 2008, individuals in Australia with chronic conditions paid out more in copayments (as a percentage of total health care costs) than in any country except the US.

A crunch point in the copayments debate is the question of a means test: why should not those who can afford it pay the relatively modest cost of a GP consultation, thus saving the health dollar for worthier causes (ie, fee-free care for those on low incomes)?

As Health Minister, Tony Abbott devoted a great deal of public money to turn around the decline in bulk-billed GP consultations in the early 2000s. The absence of a patient bill in 80% of GP consultations reflects a community consensus that, where possible, seeing a GP should not have a cost barrier. As the data above indicate, minimising barriers to seeing a GP makes sense from the point of view of health care and overall cost.

The CHF opposes a GP charge, means-tested or otherwise. Introducing a means-tested approach would insert another administrative impediment for patients, doctors and the bureaucracy. More fundamentally, it would further erode the notion of universal health care in Australia at the pivotal point of primary care. Already many people, particularly low-income individuals and families afflicted with chronic disease, struggle to meet the out-of-pocket costs for medical, pharmaceutical and allied health services.

In the past year, the CHF has drawn attention to the difficulties many Australians face in accessing and paying for medical care required beyond the bulk-billing GP. An online survey CHF has been conducting this year is indicative. It shows that 60% of 472 respondents to date said they delayed seeing the doctor because of cost.6 It is such people for whom health copayments become a crucial issue.

A new impost on primary health care would raise a hurdle before the very area Medicare needs to nurture if Australia is to meet contemporary health realities, including the swelling prevalence of lifestyle-induced disease. Doggett suggests that before the government introduces any new copayment into an “already inefficient and inequitable system”, it should look to reforms that make Medicare more effective, such as making preventive care more accessible.1

A government-ordained out-of-pocket charge would signal a further lurch towards a two-tiered regime that provides world’s best specialist and hospital care to those with the means, while those without may wait in pain or die. Would any Australian leader challenge the principle that the central purpose of the national health system is to ensure access to quality health care for all, and particularly for those most in need?