×

Why Australia needs a Medical Research Future Fund

While Australia already conducts world-class research, future global leadership requires a major funding investment

The Medical Research Future Fund (MRFF) announced as part of the 2014–15 federal Budget1 will be an integral factor in Australia’s ability to continue delivering among the best health and medical research in the world. If we look beyond the political rhetoric and debate, the MRFF offers substantial value to Australia. Yet very few commentators, including those in the medical and health sectors, have acknowledged this to the degree it deserves.

Presently the Australian Government spends 0.075% of gross domestic product on health and medical research — only 64% of the Organisation for Economic Co-operation and Development (OECD) average of 0.118%.2 The MRFF, as proposed, will build to a $20 billion perpetual fund over the next decade, ultimately providing $1 billion in funding annually for health and medical research. It is vital that this size and pace of funding be achieved to bring Australia back to an internationally comparable level of government research support.

Benefits of research to health care

There is international evidence that hospitals and health care facilities that do research deliver higher-quality care, have better patient outcomes and are more efficient. In its 2009 final report, A healthier future for all Australians, the National Health and Hospitals Reform Commission presented recommendations for creating an agile, responsive and self-improving health system.3 Central to these recommendations was embedding research in clinical and health services settings, and fostering a culture of improvement.

More recently, a key theme in the Strategic Review of Health and Medical Research (the McKeon Review), presented to the federal government in 2013, was that the best performing health systems are those that embed research in health delivery, leading to better health outcomes.4 This belies the proposition that it makes more sense to spend our limited public funds on health care, especially when it comes to the vulnerable groups in our community.

It is not true to say that almost all the medical research discoveries and cures of the future will come from beyond our shores. Australian discoveries, such as the cochlear implant and the recombinant human papillomavirus vaccine against cervical cancer, show that Australia is well and truly capable of health and medical research that has a transformational effect on the health of our community and around the world. Furthermore, a strong medical research culture is required to evaluate and selectively import the fruits of the 97% of medical research performed outside Australia that is relevant to our health system.4

Research in many fields, including that on the human brain, genomics, genetic discovery for diseases such as melanoma and multiple sclerosis, and bionics, is increasingly undertaken through international collaborations. The MRFF investment will position Australia as a valuable collaborator and contributor to such global efforts. Having local scientific and public health expertise is vital for our national biosecurity and for taking urgent, effective local action to protect the Australian community against pandemics such as influenza A(H1N1)pdm09, Ebola virus and severe acute respiratory syndrome, or other worldwide health threats.

The benefits of research are also finally becoming visible among our Indigenous communities, where infant mortality is falling, life expectancy is improving and, for the first time, hope is emerging that we can “close the gap” over the coming decades.5 The health needs of Australian Aboriginal and Torres Strait Islander people are unique and will not be addressed by research conducted in Europe or the United States.

Economic effects of health research

Medicines and health products now make up one of Australia’s most valuable high-technology export industries, at almost $4 billion per year.4 Many discoveries and inventions currently underway have the potential to create high-value jobs and strengthen the economy. For example, innovations such as the continuous automatic positive airways pressure kit, to prevent the upper airways of people with sleep apnoea from closing, generate tremendous export dollars.4 Funding the “gap” in the research pathway to such innovations becoming commercially ready will benefit Australia’s health and the economy.

However, health and medical research requires substantial investment that is not driven by profit. Much early-stage discovery work is considered too immature for commercial investment and will not occur if left to the private sector. Further, much valuable medical research does not lead to marketable discoveries. The Australian research by Professor Terence Dwyer and colleagues that established the link between prone sleeping and sudden infant death syndrome is just one example.6 Thousands of infants’ lives have been saved by this important discovery and its successful translation into effective health promotion, but by its nature it could never result in commercial success.

One of the world’s largest longitudinal population-based health studies was conducted over 12 years by Melbourne’s Baker IDI Heart and Diabetes Institute, to examine the health of Australians with regards to heart and kidney disease, diabetes and obesity. This research is critical in guiding how to best spend our health dollars, where to invest in treatment, and how Australians can play an important role in improving their own health.7 This work also informs what clinicians should be talking about with their patients and which tests they should be doing to prevent complications and disability. This is not pie-in-the-sky research, but work that has a direct bearing on people’s health today.

Filling the gaps in health research

While we can be proud of the contribution Australian health and medical research makes to our nation and the world, there are gaps and weaknesses. The McKeon Review identified that we are failing to make the most of our research discoveries.4 We have a great health system, but the failure to more completely and quickly adopt our research discoveries means that we miss opportunities to improve the quality of care and the efficiency of our health care system.

We need to do more to embed research into our health system and to improve the interaction between the health sector and researchers. In this way, we can undertake research that is relevant to our health needs and ensure evidence-based improvements in health care are implemented more quickly and effectively. To reduce costs, existing practices should be examined to ensure that they are evidence-based. We also need to do more to ensure that our research discoveries translate into new drugs, medical devices and diagnostic tools that are the basis for progress in health care. This has the potential to deliver not only improvements in health, but new jobs and business opportunities for Australians.

The potential of the MRFF to support these endeavours is enormous. While there are questions to be answered, including what the MRFF will fund and how it will operate, we should not lose sight of the bigger picture. Australia has one of the best and most efficient health care systems in the world, underpinned by past and current research, and the potential to do much more is exciting. The MRFF offers us a way to achieve this potential, and the evidence shows that all Australians stand to benefit.

Metastatic non-small cell lung cancer: a benchmark for quality end-of-life cancer care?

Lung cancer is one of the most common fatal cancers in the world. In Australia, about 7500 patients die from lung cancer each year,1 and the median survival for those with metastatic non-small cell lung cancer (NSCLC) is 4–5 months.2 Despite improvements in survival, attention to symptoms and quality-of-life concerns form the mainstay of treatment for most patients.

Those with advanced lung cancer have a substantial symptom burden. Most patients experience appetite loss, fatigue, cough, dyspnoea and chest pain.3,4 In 2010, Temel and colleagues demonstrated that early introduction of palliative care integrated with standard oncological care for this population was associated with improved quality of life, reduced depression and less aggressive care at end of life.5 Following this, the American Society of Clinical Oncology released a provisional clinical opinion that patients with metastatic NSCLC “should be offered concurrent palliative care and standard oncologic care at initial diagnosis”, while national societies have endorsed timely palliative care referral.6,7

The aggressiveness of cancer care near the end of life has been proposed as an indicator of quality of care, and centres around the following criteria: overuse of chemotherapy near death; high rates of emergency department (ED) visits; hospital and intensive care unit stays; and underuse of hospice or palliative care services.8

A series of population-based studies of cancer care in the United States and Canada revealed the aggressiveness of care at the end of life had increased.9,10 Patients more likely to receive aggressive end-of-life care were young, male and rural based, experienced greater comorbidity burden, and had lung, breast or haematological malignancies.9,10

Given the recommendation for integrated palliative care services for patients with metastatic NSCLC, we sought to examine the end-of-life care for this patient group. Using routinely collected hospital discharge, ED and death certificate data for a cohort of patients with metastatic NSCLC, we aimed to examine their patterns of care. These included the aggressiveness of care, ED visits, intensive care use, timing of chemotherapy in relation to death, hospitalisation patterns, and place of death. We also aimed to determine patterns of referral to hospital-based supportive and palliative care services.

Methods

Setting

Palliative care services in Victoria, Australia, are organised into three main areas: acute hospital consultancy services; community palliative care services providing care in the patient’s residence; and specialist inpatient palliative care units. Our study sought to examine the use of hospital-based palliative care services (ie, the first and third areas above).

Data sources

Hospital discharge and ED data are compiled by over 300 individual hospitals and maintained by the Victorian Department of Health (VDH).1113 The two datasets contain demographic and clinical information on each episode of patient care; their quality is maintained using an independent audit program.14,15 Death certificate data are maintained by the Registry of Births, Deaths and Marriages.13

These three datasets undergo step-wise deterministic data linkage at VDH.16 Linkage staff assess data quality by a series of internal logic checks and manual review of randomly selected case groups. Notably, these data report on patients who have had contact with the hospital sector only.

Metastatic NSCLC cases

Metastatic NSCLC cases were extracted based on a combination of three sets of codes: lung cancer, small cell morphology (excluded), and metastatic extension (Appendix). The first data point or entry to the study was defined as hospitalisation when both NSCLC and metastases were coded. We included only NSCLC patients who were diagnosed with metastatic disease and died between 1 July 2003 and 30 June 2010.

Outcomes

Supportive care was defined as consultation by one or more of the following services — social work, physiotherapy, occupational therapy, psychology or speech pathology — using Australian Classification of Health Interventions codes.17 Palliative care was defined as consultation with a hospital-based palliative care service.

Site of death was based on a combination of hospital and death certificate data and classified into three mutually exclusive groups: outside hospital; inpatient hospice or palliative care bed; and acute care hospital bed.

Aggressiveness of care (adopted from Earle and colleagues8 and using available dataset information) was defined by the following parameters in the last 30 days of life: more than one ED presentation; more than one hospital admission; length of stay more than 14 days; intensive care unit admission; and inpatient chemotherapy administration (including same-day admissions) within 14 days of death.

Statistical analysis

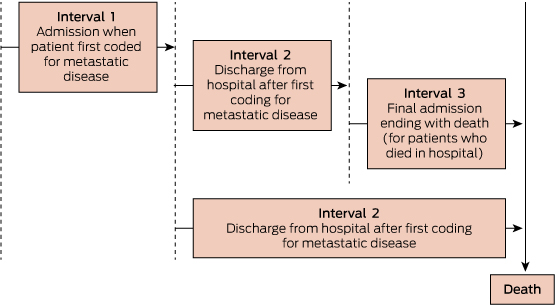
The illness course was divided into three distinct time periods based on key admissions: hospitalisation for first metastasis; interval between metastasis and just before final admission (for those who died in hospital) or death (for those who died outside hospital); and death admission for those who died in hospital (Box 1). The care was described at these time intervals using medians and interquartile ranges for continuous factors, and frequencies and proportions for categorical variables. A logistic regression model was fitted for the question: what factors predict the likelihood of death in an acute hospital bed? Stata version 13 (StataCorp) was used for all statistical analyses.

Ethics approval

This study was approved by the Monash University human research ethics committee.

Results

There were 6041 eligible NSCLC cases diagnosed with a first metastasis in the period of interest. Eighty per cent were aged ≥ 60 years and 63% were male (Box 2). At the first hospitalisation for metastatic disease, sites of metastases were: bone, 31%; lymph nodes, 36%; lung, 26%; brain, 19%; and 27% had more than one metastatic site.

Survival

Median survival after hospitalisation with first metastasis (ie, at point of entry into cohort) was 116 days, with 75% of patients (4551) surviving at least 43 days and 25% (1536) over 9 months (range 0–2324 days). This short median survival reflects our sampling frame, which included only those patients who died. Twelve per cent of patients (728) died during the first metastasis admission.

Place of death

Sixteen per cent of patients died outside of hospital, 42% in a palliative care unit, and 42% in an acute hospital bed (Box 2).

Patterns of ED and hospital use from diagnosis to death

Thirty-five per cent of patients (2104) were admitted through the ED at time of hospitalisation when metastatic disease was first coded. The proportion of patients receiving ED care was 58% for those who died during the first metastasis admission, and 42% for those who died in hospital after surviving initial admission (Box 3).

The proportion of patients receiving care in the private system reduced slightly over their cancer care, from 35% at first metastasis, to 28% at time of death.

The duration of the first admission where metastatic disease was diagnosed was a median of 43 days for those who died during this admission, compared with 6 days for those who survived the admission. Overall, patients spent a median of 38 days in hospital from first admission of metastatic disease until death.

A third of patients (1998) underwent a lung procedure (including pleuridesis, biopsy, bronchial stenting) during the admission when metastatic disease was first diagnosed, reducing to 6% during their death admission (Box 3).

Supportive and palliative care from diagnosis to death

Overall, 62% of patients were referred to palliative care (Box 2). In general, receipt of supportive care (96%) and palliative care (78%) were high for the 728 patients dying during the first metastasis admission. Sixty per cent were transferred to a hospice bed during this admission.

Of the remaining 5313 patients who survived the first metastasis admission, 10% were referred to hospital-based palliative care by time of discharge (Box 3). A further 22% were first referred to hospital-based palliative care in the interval between metastasis and death (or death admission for those dying in hospital), and 27% were referred for the first time when they returned to hospital to die.

Aggressiveness of care

In the last 30 days of life, 18% of 5313 patients surviving beyond the first metastasis admission had more than one hospital admission, and 5% had intensive care treatment. However, 61% spent more than 14 days in hospital, and less than 1% had chemotherapy in the last 14 days of life (Box 4). Thirty-three per cent (2010) were not flagged by any indicator of aggressive care.

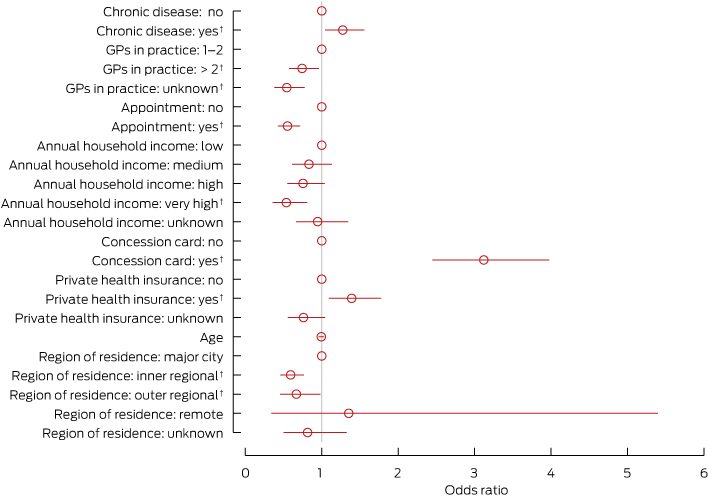
Factors associated with place of death

For patients who survived the first admission with metastatic disease, 42% died in an acute hospital bed (Box 2). Factors independently associated with increased likelihood of death in an acute bed included treatment in the private system and a rural place of residence (Box 5). Meanwhile, receipt of palliative care at any point, receipt of two or more modalities of supportive care, and English as the primary language were associated with a greater likelihood of death at home or in a palliative care unit. Notably, those surviving at least 270 days after their metastasis admission were less likely to die in an acute bed compared with those surviving less than 90 days. There was no change in the likelihood of dying in an acute bed over the time of the study.

Discussion

Our study provides an overview of care for patients with metastatic NSCLC in Victoria, Australia. It found that 42% of patients who die due to NSCLC can expect to die in an acute hospital and 42% in a hospice setting, having spent a median of 38 days in hospital after the onset of metastatic disease.

Although the patients did not generally receive aggressive care in the form of intensive care unit treatment or chemotherapy in the last 14 days of life, other parameters of aggressive care — notably, death in acute hospital and ED visits — were common. Perhaps the most important finding is the low numbers of patients discharged from hospital following the diagnosis of metastatic disease who were referred to hospital palliative care services during the first admission for metastasis (10%). This is a group of patients with poor prognostic disease, who are not being identified as requiring palliative care services.

We propose that the care of people with metastatic NSCLC is a reasonable benchmark of the quality of end-of-life care or, more broadly, palliative care, for those with eventually fatal oncological disease. This is because metastatic NSCLC is associated with a poor prognosis (less than 4 months in our study) and a high symptom burden;24 has high-quality evidence of benefits from palliative care;5 and palliative care has been recommended as part of standard practice.6,18 Such key unambiguous reasons for routinely involving palliative care for patients with metastatic NSCLC may provide the ideal model for assessing the quality of end-of-life care provision.

In this context, our study shows that for metastatic NSCLC patients, where the case for palliative care is strong, gaps remain in service provision. For example, just 18% of patients overall received hospital-based palliative care services at the first sign of metastatic disease, including those who died during that admission; referral was far less frequent among those discharged from hospital. While this proportion increased to 62% overall, about a quarter of these patients first received palliative care services in the readmission that resulted in their death.

Palliative care referrals, when they do occur, appear often to be late in the illness. Poulose and colleagues highlighted the timing of referral to palliative care as important, suggesting that referral at least 30 days before death is associated with a greater chance of dying at home or in hospice,19 the preferred options expressed by most surveyed patients.2022 Similarly, Earle and colleagues suggested that hospice admission 3 days or less before death is a marker of poor-quality care.8

In our study, referral occurred very late, at the time of death admission, for about a quarter of all patients surviving the initial admission with metastasis. This may not represent the first contact with palliative care services for all patients, as they may previously have been involved with community care, but it is likely to be the first contact for at least a significant number. Late referrals to palliative care diminish opportunities to institute community networks of support. Late referrals also do not allow sufficient time for patients and families to establish confidence in such networks. Our and other studies23,24 show that referral to palliative care services is an independent predictor of the likelihood of death outside the acute hospital and reduced hospitalisations, but it appears that time is required in order for this effect to be realised. In addition, late referral to palliative care necessarily truncates opportunities to attend to psychosocial and symptom needs.

Based on our proposition that metastatic NSCLC should represent a suitable benchmark for palliative care provision to oncology patients, it is worthwhile considering what may be the most pertinent quality indicator(s). In our study, 62% of patients were engaged with hospital-based palliative care services overall. This figure is high, and may be even higher since community-based care was not captured. Nevertheless, only 18% accessed palliative care during the admission when metastatic disease was diagnosed, potentially the most appropriate time to discuss the benefits of palliative care for this patient group. What level of palliative care should be considered the preferred standard of quality end-of-life care for metastatic NSCLC patients, and when should referral occur? Is the current proportion of 18% receiving palliative care at first admission with metastatic disease sufficient, or would 50% or even 90% of patients indicate better-quality care, in light of evidence that referral to palliative care at this time may prolong survival?5 Further, how should quality be judged in other diagnostic cohorts where the associated factors are ambiguous, such as when prognosis is longer?

Our study had several limitations. The analysis relied on routinely collected hospital data, so care events that took place outside hospital were not collected. This means that patients diagnosed with a metastasis as outpatients and never admitted were not part of our analysis. Similarly, community-based palliative care provision was not available in our dataset, and therefore receipt of palliative care is likely to be higher than we have reported. In Western Australia, this has been found to represent up to 24% of cancer patients.25 While local care patterns are likely to be influential, this community-only group may also be significant in Victoria. Oral chemotherapy regimens not requiring intravenous drug administration would not have been captured. Finally, our cohort included patients who were diagnosed and died within the follow-up period, which meant that particularly long survivors were not included. Nevertheless, our approach enabled us to document care during the whole illness period for those included, which was consistent with our focus on care at the end-of-life.

In conclusion, we sought to establish the current patterns of care and use of hospital palliative care for patients with metastatic NSCLC in Victoria. In this group, who we propose as a benchmark of quality end-of-life care, there was limited use of aggressive treatment measures such as intensive care and chemotherapy at end of life, although high numbers of people died in acute hospitals following a substantial length of stay. Most patients were referred to palliative care services, but this tended to happen later in the illness course. Future work is required to determine appropriate targets for quality end-of-life care in this and other cancer patient cohorts, with particular focus on timely palliative care engagement.

1 Schema of time intervals as basis for analysis

2 Demographic and clinical data (n = 6041)

Characteristic

No. of patients


Age


< 40 years

39 (1%)

40–59 years

1167 (19%)

≥ 60 years

4835 (80%)

Male

3815 (63%)

Australian born

3656 (61%)

English as primary language

4328 (72%)

Married

3869 (64%)

Rural residence

2058 (34%)

Histology

Adenocarcinoma

2081 (34%)

Large cell carcinoma

433 (7%)

Non-small cell, not further classified

1655 (27%)

Squamous cell carcinoma

877 (15%)

Bronchoalveolar carcinoma

33 (1%)

No histology

1181 (20%)

Total number of histological types

0

1181 (20%)

1

4557 (75%)

≥ 2

303 (5%)

Metastatic site at time of diagnosis

Bone

1890 (31%)

Brain

1156 (19%)

Lung

1565 (26%)

Lymph nodes

2157 (36%)

Other

378 (6%)

Referral to hospital-based palliative care services

3724 (62%)

Place of death

Acute hospital bed

2547 (42%)

Hospice or palliative care bed

2532 (42%)

Out of hospital

962 (16%)

3 Patterns of hospital use, and supportive and palliative care (n = 6041)*


Interval 1: first metastasis admission


Variable

Died during admission

Alive after admission

Interval 2: between metastasis and death

Interval 3: death in hospital after surviving metastasis admission


Total at beginning of each interval§

728

5313

5313

4440

Median days during each interval (range)

43 (30–254)

6 (1–181)

123 (0–2304)

10 (1–271)

Any hospitalisation

728 (100%)

5313 (100%)

4360 (82%)

4440 (100%)

Median bed days per person (range)

43 (30–254)

6 (1–181)

20 (1–515)

7 (1–195)

Any ED visit

422 (58%)

1682 (32%)

2707 (51%)

1860 (42%)

Median ED visits per person (range)

1

1

2 (1–3)

1

Median hours spent in ED per person (range)

8 (0–54)

8 (0–49)

12 (0–145)

7 (0–180)

Intensive care unit admission

72 (10%)

656 (12%)

288 (5%)

215 (5%)

Lung procedures

228 (31%)

1770 (33%)

897 (17%)

257 (6%)

Chemotherapy as inpatient

11 (2%)

221 (4%)

417 (8%)

18 (< 1%)

Radiotherapy as inpatient

78 (11%)

226 (4%)

235 (4%)

127 (3%)

No. of supportive care modalities


0

31 (4%)

2616 (49%)

1039 (20%)

1760 (40%)

1

72 (10%)

975 (18%)

935 (18%)

911 (21%)

≥ 2

625 (86%)

1722 (32%)

2388 (45%)

1724 (39%)

First palliative care

569 (78%)

531 (10%)

1176 (22%)

1448 (32%)


* Data are number of patients (%) unless otherwise indicated; percentages within rows do not reflect mutually exclusive groups. † Including death for patients who died outside hospital. ‡ Acute hospital or palliative care unit. § Within interval, this is the denominator for percentages. ¶ If the denominator for the first palliative care in this interval is 5313 (ie, patients who survived the diagnostic metastasis admission), the proportion is 27%.

4 Indicators of aggressiveness of care at the end of life* (n = 5313)

Indicator

No. of patients


More than one acute hospital admission in last 30 days of life

973 (18%)

Length of stay more than 14 days in last 30 days of life

3219 (61%)

Intensive care unit admission in last 30 days of life

251 (5%)

More than one ED presentation in last 30 days of life

68 (1%)

ED presentation in death admission in last 30 days of life

2225 (42%)

Chemotherapy in last 14 days of life

53 (1%)


ED = emergency department. * Includes death admission for patients who died in hospital.

5 Factors associated with death in the acute hospital

Death in acute hospital bed

Odds ratio (95% CI)

P


First receipt of palliative care


No palliative care

1.00


Within 30 days, during metastasis admission

0.27 (0.22–0.33)

< 0.001

≥ 30 days after metastasis and before death admission

0.25 (0.21–0.30)

< 0.001

Death admission

0.22 (0.19–0.25)

< 0.001

Sex


Male

1.00


Female

0.97 (0.85–1.10)

ns

Age, years


< 40

1.00


40–59

0.66 (0.33–1.31)

ns

≥ 60

0.59 (0.30–1.16)

ns

Private hospital

1.25 (1.10–1.42)

< 0.001

English speaking

0.82 (0.72–0.94)

0.01

Married

1.06 (0.97–1.16)

ns

Rural

1.62 (1.42–1.84)

< 0.001

Metastases


Bone

0.96 (0.83–1.11)

ns

Brain

0.88 (0.74–1.05)

ns

Liver

0.97 (0.82–1.15)

ns

Lung

1.16 (0.99–1.35)

ns

Lymph nodes

1.21 (1.04–1.39)

0.011

Other

0.95 (0.72–1.24)

ns

Total number of supportive care modalities


0

1.00


1

0.88 (0.73–1.07)

ns

2

0.65 (0.56–0.75)

< 0.001

Year of metastasis


2003

1.00


2004

1.09 (0.83–1.42)

ns

2005

1.15 (0.88–1.51)

ns

2006

1.08 (0.83–1.42)

ns

2007

1.27 (0.97–1.67)

ns

2008

1.07 (0.82–1.41)

ns

2009

1.15 (0.86–1.53)

ns

2010

1.20 (0.75–1.91)

ns

Days lived


< 90

1.00


90–179

0.89 (0.75–1.05)

ns

180–269

0.88 (0.73–1.07)

ns

270–364

0.74 (0.58–0.93)

0.012

≥ 365

0.77 (0.63–0.93)

0.006


ns = not significant.

Tolerability and outcomes of curative radiotherapy in patients aged 85 or more years

In developed nations, more than 50% of all cancer diagnoses are made in people aged over 65 years.1 It is well recognised that older patients are underrepresented in clinical trials.28 Older patients may be excluded from clinical trials because they tend to have high numbers of comorbid conditions, or because of a perception that they are unable to tolerate aggressive treatment.5,9 Population-level data show that older patients with many types of solid tumours are less likely to receive aggressive therapy,1012 which may result in poorer outcomes.9

Our primary aim in this study was to document the tolerability of radiotherapy given with curative intent in patients aged 85 years and older.

Methods

This retrospective study was approved by the Peter MacCallum Cancer Centre ethics review committee (study 13/21).

Participants

Eligible patients included those aged 85 years and over who received curative radiotherapy at any Peter MacCallum Cancer Centre site between 1 January 2000 and 1 January 2010. Treatment was delivered in three metropolitan Melbourne sites, and one regional location (Bendigo). Patients must have received a dose of at least 25 Gy to be included. Adjuvant radiotherapy or chemoradiation treatments were included. All presentations for non-metastatic cancers were included, except those for simple skin cancer treatments.

Data collection

For each patient, age, unadjusted Charlson comorbidity index (CCMI) score, Eastern Cooperative Oncology Group performance status (ECOG PS), and the type of malignancy were retrieved retrospectively. When calculating the CCMI score, the tumour diagnosis being treated was excluded from scoring. We proposed that increasing CCMI score might correlate with poor treatment tolerability.13

Radiation treatment details, including radiation dose and fractionation, the extent of treatment (primary, lymph node basins, or both), treatment body site and delivery of concurrent chemotherapy were available from electronic treatment records. The extent of treatment and treatment body site were grouped into categories that reflect the rigours of completing each course. If the radiation dose-fractionation was altered because of physician concerns about a patient’s ability to tolerate the standard radiation treatment, this was termed “altered fractionation”.

Poor treatment tolerability was defined as any instance of an interruption to or break from treatment, hospital admission from any cause, or early cessation of radiation treatment for any cause. The cause of each instance of poor treatment tolerability was assessed and assigned as either treatment-related or non-treatment-related.

Linkage with the Victorian Cancer Registry (VCR) facilitated high fidelity national-level mortality information. Overall survival was measured for all patients included in the VCR, and was measured from the first radiotherapy fraction. A closeout date of 31 December 2011 was used, as VCR survival data are complete up until this date. All patients without a recorded death date before the closeout date were considered alive on that date. All patients were censored at the closeout date.

Statistical analysis

The statistical package R, version 3.0 (R Foundation for Statistical Computing; http://www.R-project.org) was used for statistical analysis. Quantitative variables were described using summary statistics. Poor treatment tolerability was described using counts and percentages, with 95% confidence intervals calculated using exact methods. Logistic regression was used to evaluate the impact of possible prognostic factors of poor tolerability. Overall survival and cancer-specific survival were estimated using Kaplan–Meier methods with 95% confidence intervals. As patients with more than one cancer diagnosis were included in the study, cancer-specific survival was measured in respect to the cancer being treated during the study period. Cox proportional hazard models were used to test whether ECOG and CCMI were associated with overall survival. ECOG and CCMI were treated as ordinal variables. Cumulative incidence curves for cause of death were provided assuming competing risks. Median follow-up was calculated using the reverse Kaplan–Meier method with 95% confidence interval.

Results

Between 1 January 2000 and 1 January 2010 a total of 327 radiotherapy courses were delivered to 325 patients who met our inclusion criteria. In two courses, information regarding treatment breaks could not be retrieved. The baseline patient and treatment characteristics for the study population are available online (Appendix 1). The most common sites treated were pelvis (30%), head and neck (25%), breast (18%) and thorax (13%). The 10 most common diagnosis groups and prescribed total radiation dose and fractions are available in Appendix 2.

Tolerability analysis

Poor treatment tolerability was observed in 70 patients (21%; estimated 95% CI, 17%–26%). Only 16 patients (5%) ceased treatment prematurely. The characteristics of treatment tolerability are described in Appendix 3.

Univariate analysis of the predictors of poor treatment tolerability showed that only unfavourable ECOG PS scores before treatment commencement predicted poor treatment tolerability (odds ratio [OR], 1.73; P = 0.001). Rates of poor treatment tolerability for patients with ECOG PS scores (higher scores indicate poorer performance) of 0, 1, 2 and 3 were 16% (16/97), 15% (20/132), 49% (18/37) and 33% (5/15), respectively. We also analysed ECOG PS score as a categorical variable, reflecting clinical practice, of patients with “good” PS (ECOG score 0–1) and “poor” PS (ECOG scores 2–3). On multivariate analysis, ECOG PS score remained statistically significant (OR, 1.80; P = 0.005; 95% CI, 1.23–2.69), and increasing age was found to be a statistically significant predictor of poorer tolerability (OR 1.18; P = 0.018; 95% CI, 1.04–1.34). Because of the small number of patients with a ECOG PS score of 3, the multivariate analysis was repeated with ECOG PS scores grouped as described above, and again only ECOG PS remained significant (data not shown). The Box shows the results of the univariate and multivariate analyses.

Survival analysis

Registry-level survival data were available for 97% of the patient cohort (314/325). Survival estimates for 1, 3, 5 and 8 years were 81.2%, 52.7%, 38.1% and 20.2%, respectively. The overall survival curve can be viewed in Appendix 4. Cancer-specific survival estimates at 1, 3, 5 and 8 years were 87%, 66%, 56% and 44%, respectively. The median follow-up period was 6 years (95% CI, 5.1–6.6 years) and median survival was 3.3 years (95% CI, 2.7–4.1 years).

Cause of death was available from the VCR in all but two cases. The competing risks analysis (312 patients; Appendix 5) showed that the risk of cancer-related death exceeded that of death from other causes.

Five-year overall survival decreased with unfavourable ECOG PS (overall survival estimates with PS of 0, 1, 2 and 3 were 53%, 33%, 22% and 8%, respectively). Increasing ordinal ECOG PS scores correlated significantly with poorer overall survival (hazard ratio [HR], 1.53; P = 0.001; 95% CI, 1.29–1.81). Figures describing overall survival curves by ECOG PS score are available in Appendix 6. Increasing CCMI was also associated with poorer survival outcome (HR, 1.16; P = 0.023; 95% CI, 1.02–1.31).

Discussion

In this large cohort study of elderly patients treated with curative radiotherapy, our primary objective was to assess the tolerability of high-dose radiotherapy. Our data show that, with judicious patient selection, patients over the age of 85 years can tolerate aggressive radiotherapy regimens. The treatment completion rate of 95% was higher than in other cohort studies with less stringent entry criteria.1416 The limited number of existing publications often included low numbers of elderly patients17 or were small,1416 included palliative treatments,1416 or were limited by short follow-up time.16

The outcomes of our study may be affected by selection bias and inclusion of the “well” old; 70% of the patients in our study had an ECOG PS score of 0 or 1 and 72% had a CCMI score of 0. In contrast, a study of comorbid conditions in patients with breast cancer who were over the age of 80 years found that only 35% of patients were free of common comorbid conditions.9 Such selection bias is difficult to avoid as it may begin before patients are referred by treating doctors to be considered for radiotherapy. That is, treating doctors may not refer frailer patients on the presumption they will not tolerate treatment, when, in fact, they may have proceeded through radiotherapy without problems. Referring only relatively fitter patients who are more likely to tolerate side effects may create undertreatment biases.

In our cohort of patients, 22% were prescribed alternative dose-fractionation radiotherapy courses, which are easier for patients to tolerate because there are a smaller number of fractions. We included these patients, as excluding a poor prognosis group from analysis would have introduced further selection bias. On balance, altered fractionation was included in the multivariate analysis of predictors of poor treatment tolerability, and was found not to predict poor tolerability. As frail patients are often offered altered fractionation regimens that are easier to tolerate, treatment tolerability was preserved.

ECOG PS is related to the concept of geriatric “frailty”, which defines the progressive age-related loss of self-management skills. Frailty is also associated with poorer outcome after other health interventions.18 Among patients for whom radical treatment is contemplated, we found that ECOG PS score predicts both tolerability and survival. ECOG PS thus remains a useful predictive factor despite its lack of granularity. Ideally, a formal comprehensive geriatric assessment (CGA)19 should be used as pre-treatment assessment. The CGA has been shown to predict survival20 and the incidence of side effects20,21 and, most importantly, to change clinical treatment decisions.22

This study reinforces the findings of the limited literature describing the favourable tolerability of radiotherapy in very elderly patients. It is perhaps incorrectly perceived that a high rate of natural attrition in this age group lessens the need for long-term cancer control. We challenge this assumption; the median survival in our study was 3.4 years, which is shorter than the life expectancy for an 87-year-old Australian (6.2 years for men and 7.2 years for women).23

In summary, loco-regional radiotherapy is well tolerated by older patients with cancer. Patients of advanced age whose performance status is good should still be referred to be assessed for treatment.

Univariate and multivariate analyses of factors associated with poor tolerability of radiotherapy in 325 patients aged over 85 years

Variable

Number of patients

Poor treatment tolerability

Univariate analysis

Multivariate analysis


Odds ratio (95% CI)

P

Odds ratio (95% CI)

P


Extent of radiation treatment


0.092


0.145

Primary tumour plus lymph node basins

131

27%

1


1


Primary tumour only

174

18%

0.57 (0.33–0.99)


0.85 (0.43–1.69)


Lymph node basins only

21

14%

0.44 (0.10–1.40)


0.24 (0.01–1.35)


Concurrent chest x-ray


0.379


0.920

No

251

19%

1


1


Yes

71

24%

1.33 (0.70–2.46)


1.03 (0.46–2.23)


CCMI score (ordinal)


1.03 (0.80–1.30)

0.806

1.05 (0.78–1.38)

0.605

ECOG performance status score (ordinal)


1.73 (1.23–2.44)

0.001

1.80 (1.23–2.69)

0.005

ECOG performance status score (grouped)


< 0.001


0 or 1

229

16%

1


2 or 3

52

44%

4.3 (2.21–8.19)


Age (continuous)


1.10 (0.99–1.22)

0.088

1.18 (1.04–1.34)

0.013

Altered fractionation


0.784


0.113

No

236

20%

1


1


Yes

81

19%

0.92 (0.47–1.71)


0.53 (0.23–1.15)


CCMI = Charlson comorbidity index. ECOG = Eastern Cooperative Oncology Group.

Chronic suppurative lung disease and bronchiectasis in children and adults in Australia and New Zealand Thoracic Society of Australia and New Zealand guidelines

Correction

Incorrect provenance statement: In “Chronic suppurative lung disease and bronchiectasis in children and adults in Australia and New Zealand: Thoracic Society of Australia and New Zealand guidelines” in the 19 January 2015 issue of the Journal (Med J Aust 2015; 202: 21-23), the provenance statement incorrectly stated that the guidelines were not peer reviewed. The guidelines were externally peer reviewed.

What doctors should know about the Trans-Pacific Partnership Agreement

How this new breed of trade agreement could affect public health and access to medicines

Macroeconomic policy decisions can seem far removed from day-to-day medical practice; however, these high-level policy decisions about trade and economic policy have far-reaching consequences and can undermine effective health policy and practice.

The Trans-Pacific Partnership Agreement

The Trans-Pacific Partnership Agreement (TPPA), currently under negotiation, represents a new breed of trade agreement.1 It will include the traditional focus areas, like removing import taxes and enabling foreign companies to provide services in Australia; and it is believed it will provide new protections for investors and intellectual property. The TPPA is aimed at changing policy making within countries and harmonising domestic policy requirements affecting trade and investment across the countries involved.2

As a new-style agreement, the TPPA has greater potential to affect domestic health policy and, ultimately, the quality of health services and public health.3 For example, leaked documents show that an investor–state dispute settlement mechanism is being negotiated for the TPPA. This enables foreign investors — including companies that manufacture, market and distribute health-damaging products — to directly seek compensation from governments for policies that negatively affect them. A similar mechanism in another treaty enabled Philip Morris Asia to sue the Australian Government over plain tobacco packaging.4 Similarly, moves to harmonise policies within signatory countries that affect traded goods can result in a move to the lowest common denominator and can limit public health protections related to medicines, tobacco, alcohol and food.

Australia, Brunei Darussalam, Canada, Chile, Japan, Malaysia, Mexico, New Zealand, Peru, Singapore, the United States and Vietnam are involved in TPPA negotiations.5 These countries have diverse approaches to health care and public health, which are likely to be reflected in their negotiating platforms. While the Australian Government has stated it will not enter into an agreement that compromises public health, independent assessment of the implications for public health is severely limited by lack of transparency in the negotiations (the agreement will not be made public until after it is signed).6

Main areas of concern for doctors

One of the key concerns for doctors is access to medicines. Intellectual property rules proposed for the TPPA, if adopted, are likely to prolong monopolies over new medicines and delay the availability of cheaper generics.4,7 Resulting cost blowouts to the Pharmaceutical Benefits Scheme (PBS) would play out for patients in higher copayments and reduced access to expensive new treatments, with disadvantaged patients bearing much of the burden.8 Changes to PBS processes also proposed for the TPPA could compound these problems by preventing effective price regulation and giving the pharmaceutical industry more say in PBS decision making.4,7 In addition, pharmaceutical companies may be able to use the investor–state dispute settlement mechanism to sue, or threaten to sue, governments over their pharmaceutical policies. Pharmaceutical company Eli Lilly and Company is currently using an investor–state dispute settlement mechanism to sue the Canadian Government for invalidating patents for two drugs that were found not to deliver the promised benefits.8

The TPPA could also make the shared task of tackling chronic non-communicable diseases such as diabetes and heart disease more difficult. Prevention through supportive environments is an essential corollary to general practitioner-based primary prevention. Nevertheless, the rules of these new trade agreements that are focused on domestic policy can reduce the options available to government for regulating products associated with non-communicable disease prevention, namely tobacco, alcohol and food.9 For example, proposed rules on transparency and regulatory coherence in the TPPA would enshrine the right of industry (both local and international) to contribute to national nutrition policy making. This works against public health efforts to reduce the influence of vested interests on policy design and implementation. Without strong population-based prevention, such as clear labelling of health risks, limitations on advertising and price incentives to reduce consumption (all strongly opposed by industry), the burden falling on GP-based primary prevention will continue to grow.

Doctors should also be concerned about the implications of the TPPA for health services. The TPPA is expected to include rules to ensure private companies can compete on an equal footing with publicly funded or provided services.10 Owing to limited public information, it is difficult to establish how current and future public health services will be affected. But if parts of the health system are privatised (such as Medicare claims processing and primary health care networks), this may not be reversible under the TPPA, regardless of any subsequent evidence of detrimental effects of such privatisation.

What doctors can do

The Australian Medical Association and the Public Health Association of Australia have raised concerns about the potential impact of the TPPA on public health and access to medicines.6,11 Such input is essential for awareness among policymakers of the cross-sectoral implications of trade policy decisions. Doctors can help to protect public health by highlighting the effects of proposed provisions on patients, opposing health-damaging provisions, arguing for the agreement to be worded in ways that protect public health and seeking greater transparency in the TPPA negotiations.

Patient safety in primary care: more data and more action needed

A better understanding of patient safety threats and incidents is needed to inform preventive action

Although most health care services are delivered in the community-based primary care sector, little is known about medical errors and near misses (here referred to as patient safety threats) and the consequent adverse events and harms (here referred to as patient safety incidents) in primary care. In Australia, research and data on patient safety comes almost exclusively from the hospital sector. The common assumption is that the problem is at least as common in primary care as in other areas of medical practice, but there is currently no mechanism to capture and analyse national data. A better understanding of patient safety threats and incidents in primary care is needed, along with resources to enable preventive action.

In Australia, little is known of patient risks of harm in primary care, and the few studies that have been done in this area are dated. Given the size of the sector, the diversity of providers, the frequency with which people access services, and the central role of primary care in the system, it is essential that the quality and safety of primary care are continuously improved and efforts made to prevent patient safety incidents. However, there is currently no mechanism to capture and analyse national data, and there is no agreed taxonomy to underpin effective incident monitoring; although as far back as 1997, Britt and colleagues developed a taxonomy and showed that an incident monitoring process could be successfully applied in general practice.1

Most research is based on surveys and questionnaires of general practitioners. The overall incidence of GP-reported errors has been estimated at about one per 1000 Medicare services and two for every 1000 patients seen by a GP.2 In 1998, Bhasale and colleagues used an incident monitoring approach to show that 76% of GP errors were preventable and 27% had the potential for severe harm.3 Fifty-one per cent of incidents related to pharmacological management, and the biggest contributory factor was poor communication. Despite the fact that diagnostic uncertainty is a key feature of general practice, most of the errors reported in this study were generated by basic oversights rather than uncertainty: failure to review the patient’s history, or abnormal test results missed or not acted on.

A literature review prepared in 2009 for the Australian Commission on Safety and Quality in Health Care (ACSQHC)4 showed numerous and substantial gaps in current knowledge about threats and incidents that present a risk to patients in primary care, with most of this information relating to general practice and pharmacy. The gaps are even more serious when it comes to knowledge of interventions and strategies to improve patient safety in primary care, and the review found a lack of rigour in the research in this field.

The three most common factors thought to contribute to harm in primary care are clinical complexity, human factors and systems causes;5 and they are not mutually exclusive.

Human factors in the clinical setting are about “enhancing clinical performance through an understanding of the effects of teamwork, tasks, equipment, workspace, culture, organisation on human behaviour and abilities, and application of that knowledge”.6 Put another way, “human factors are all the things that make us different from logical, completely predictable machines. In simple terms they are all those things that enhance or reduce human performance in the workplace”.6 Understanding human factors is an important aspect of understanding the causes of patient safety threats and incidents and preventing them.

Challenges related to clinical complexity include managing multiple conditions and multiple medications. As the prevalence of multimorbidity is high and increases with age, this is a growing problem for primary care.7 Studies to improve the management of these patients have focused on quality of care rather than safety and error prevention. Calls have been made to adapt guidelines to take account of multimorbidity8 and to make better use of electronic prescribing and medication reviews when multiple medications are involved.5

System causes that contribute to patient safety threats and incidents include a lack of coordination, including between primary and secondary and tertiary care sectors; cost-cutting measures; and environmental and design factors. For example, the transition from community to hospital and back into the community has been associated with duplications and omissions of tests and treatments, prescribing errors and adverse events.9

Adverse drug events (ADEs) constitute the most important subset of patient safety incidents in general practice, and one study has shown that 7.6% of ADEs result in hospitalisation.10 In older patients, ADEs resulting from commonly prescribed drugs at therapeutic dosages are frequent and are associated with morbidity.11 In Australia, it is not mandatory to report adverse drug events, so the true size of the problem remains unknown. The Royal Australasian College of Physicians, in its 2013–14 Budget submission, has called for making reporting of ADEs compulsory, but at the same time has requested reimbursement for physicians doing this.

Despite the potential size and impact of this problem, there is a conspicuous lack of information about what works in this area. A comprehensive review undertaken in 2009 found that neither community-based, pharmacist-led interventions (including medication reviews) nor primary care physician education programs were effective in reducing hospitalisation for ADEs.12 Another article concluded that “deprescribing in older persons likely results in reduced medication usage and cost and is unlikely to cause harm to patients”, but there is a “lack of high-quality, long-term, prospective evidence to show that deprescribing results in clinically meaningful outcomes”.13

These complex patient safety problems require solutions across the whole health care system and not just a focus on acute care or general practice. In particular, there must be a greater focus on patient safety in allied health areas.

The one constant in all of these patient safety concerns is the patient. Putting patients at the centre of health care also means putting them — and their carers — at the centre of questions around quality and safety, reporting and management. Patients have a key role to play in helping to identify safety incidents and taking appropriate action to prevent them,14 but this is rarely done. Where such work has been undertaken, it shows divergences in views about what is important.

Interviews with primary care patients suggest that breakdowns in access to and relationships with clinicians may be more substantial than technical errors in diagnosis and treatment.15 Patients were more likely to report being harmed psychologically and emotionally, suggesting that the current preoccupation of the patient safety movement with adverse drug events and surgical mishaps could overlook other patient priorities. Problems such as failure to get a timely appointment, a busy doctor who does not take the time to adequately explain and educate, even perceived racism, can have harmful consequences and show that patient dissatisfaction and poor-quality care share common origins. They also highlight that a focus on technical errors is insufficient to ensure patient safety.

The goal of quality and safety initiatives is to reduce harm, and the stories that patients tell of their view of deficiencies in the system highlight system design flaws that are amenable to analysis and change. Harmful adverse events have consequences that linger. One study found that nearly a third of patients who reported adverse events causing harm also reported long-term or permanent emotional effects, and over 20% described long-term physical consequences.16

This poses an awkward problem for GPs: the high levels of trust that Australians have in their GPs are translated into their positive attitudes to GPs’ role in patient safety. When adverse events occur, especially if the incident is not managed well, patients may experience considerable psychological trauma. Unintended adverse events can be confronting, even for experienced and skilled GPs, and patients who are harmed often experience the incident as a violation of trust and lose confidence in their GP and practice.

For now, Australia’s lack of system-wide reporting on patient safety is a black hole that means there are no data and no contextual information for patient safety improvements. The work done in this regard by the ACSQHC in 2009–2011 appears to have ceased with the publication of the Patient Safety in Primary Health Care — Consultation Report July 2011.17 This report called for work to be undertaken to ensure the development of a nationally coordinated, systematic and effective means of reporting errors and near misses in primary health care, based on an agreed set of safety measures. But it also chose to highlight the Australian Medical Association’s contrarian view, “‘Our view is that the organisation of primary care in Australia is in for such a shake up over the next two or three years that it is the worst time to be contemplating some sort of safety intervention or initiative”.17

That was a very prescient statement, given the changes proposed by the Australian Government with respect to the replacement of Medicare Locals with Primary Health Networks (PHNs). But quality and safety are too important to put aside any longer, and efforts must be made to advance the admirable but false start made in primary care. Quality and safety must be an integral aspect of the new PHNs and they can be further advanced by practice-based research networks and a primary care patient safety collaborative.

If Australia is to regain the momentum to improve patient safety in primary care, there needs to be:

  • recognition that patient safety incidents in primary care matter;
  • national data collection to evaluate the full extent of the harms caused;
  • a concerted research effort to better understand the problems and their causes; and
  • collaboration across jurisdictional and professional boundaries to implement improvements.

There needs to be action at every level of the health system and policy initiatives and resources to drive this. The role of the patient needs to be central and that of general practice paramount, and an opportunity needs to be provided for primary care networks to take the lead.

The name at the head of the bed

To the Editor: Our hospitals and hospital-based colleagues provide wonderful care and, unfortunately, most of us will require inpatient care at some stage in our lives: we are all aware of increasingly complex comorbidity and polypharmacy problems as we age.

An apparent impasse between community care and hospital discharges and admissions remains, even though information technology in the 21st century should make life easier. This has fiscal, medical and social sequelae.

Finding a solution to this requires a complex debate, which should remain focused on the best outcomes for our patients.

Who looks after the patient in hospital? There is naturally a team of doctors and allied health personnel. The team leader is usually a consultant whose name is listed at the head of the patient’s bed.

The Academy of Medical Royal Colleges in the United Kingdom recently endorsed this concept, ensuring that patients, their relatives and carers will know “which doctor is ultimately responsible for all aspects of their care”.1

So where do community physicians fit into all of this? Because real life does happen outside hospitals, and patients actually return to their communities!

My patients, especially those with complex problems, complain recurrently about a loss of continuity between their hospital and their general practitioner.

A critical innovation could be that the patient’s GP is listed alongside the name of the relevant specialist colleague at the head of the bed.

The patient would then be reassured that their prime medical carer has close alignment with the hospital staff, and junior hospital staff would know who to contact on admission and discharge, ensuring a smoother transition and reducing fragmentation.

This would be a win-win situation for all concerned!

Factors affecting general practitioner charges and Medicare bulk-billing: results of a survey of Australians

Data from Medicare Australia show that 76.9% of all Medicare Benefits Schedule (MBS) services were bulk billed (charged directly to the Commonwealth without a patient copayment) in the December quarter of 2013.1 The proportion was 81.9% for general practitioner services.1 These historically high rates of direct-to-government charges have in part led to calls for the introduction of minimum patient copayments for GP services. While much has been written in the media about the potential impact of such copayments, perhaps less is understood about the factors affecting decisions to bulk bill or to charge patient copayments, and how these factors are linked to patient-reported characteristics of general practices.

Studies of bulk-billing have largely focused on GP-specific factors, using data from surveys or large administrative datasets to explore bulk-billing behaviour. Studies of the impact of GP density (number of GPs in a given area) on bulk-billing behaviour have shown that the greater the number of GPs, the greater the propensity to bulk bill.2,3 Some surveys of GPs have specifically explored factors determining bulk-billing. One study identified that among a sample of GPs practising in New South Wales, the odds of bulk-billing were higher for those in major cities compared with those in rural areas, for overseas-trained doctors compared with locally trained doctors, and for those with a higher caseload.4 Patient income level has also been cited as a factor influencing GPs’ bulk-billing decisions.3,5

Surveys of patients’ experiences of making an appointment with and being treated by a GP have also been done.68 However, to our knowledge, no Australian survey has captured general practice service-related factors together with detailed information about the personal and health characteristics of patients to enable analysis of associations between GP charging behaviour and the characteristics of patients, visits and practices.

We surveyed Australians on recent experiences when visiting a GP to investigate the extent to which bulk-billing is explained by patient characteristics, visit characteristics and practice characteristics. The ability to combine information about respondents with information on the types of primary care services they use (albeit as recalled by patients) offers a new source of data on patient–GP interactions.

Methods

Our survey was administered to the Pureprofile online panel (http://www.pureprofile.com/au) in July 2013 using the Qualtrics platform (http://www.qualtrics.com). Australians aged 16 years or older were invited to participate via an invitation on their member’s home page.

Members of this panel are reimbursed for survey completion according to the time required to complete the survey. The invitation to complete our survey stated that the survey would take up to 15 minutes to complete and that those who completed the survey would be reimbursed $4.00.

Respondents were asked about their most recent visit to a GP. The questions focused on: their perceptions of the general practice structure; whether they were bulk billed for the visit, and the fee paid if not bulk billed; their use of primary health care services; and demographic details.

Data were analysed using STATA version 12 (StataCorp LP) and conducted using the robust standard errors command to account for the survey nature of the data.

Where a respondent reported paying a fee for their most recent visit, this was compared with the MBS fee for that visit type (for the reported visit duration) to derive a net out-of-pocket cost.

Initial analyses considered frequencies of and correlations between variables thought to be associated with bulk-billing. Associations between these factors and the dependent variable (whether or not the respondent was bulk billed at their most recent GP visit) were first tested using univariate analyses.

Factors for which there was a significant odds ratio (OR) (ie, the 95% CI excluded the value 1) were included in a multivariate logistic regression analysis. This type of analysis produces results that can be interpreted as the odds of respondents with a given characteristic, or respondents visiting practices with a certain characteristic, being bulk billed compared with those for whom the characteristic is absent. For parsimony, only results of the multivariate logistic regression analysis are presented in this article.

The respondent factors tested for association were: presence of chronic disease (yes or no); annual household income (low, $0–$39 999; medium, $40 000–$79 999; high, $80 000–$149 999; very high, > $150 000; or unknown); use of any form of government concession card other than a Medicare card (yes or no); having private health insurance (yes, no or unknown); age; region of residence (major city, inner regional, outer regional, remote, or unknown); sex (female or male); and duration of visit (< 5 min, 5–19 min, 20–39 min or > 40 min).

The practice characteristics tested for association were: the number of GPs in the practice (one or two, more than two, or unknown); and whether the respondent had an appointment for the GP visit (yes or no).

As the survey was anonymous, it was not possible to retrospectively collect information from respondents who did not provide it at the time of survey completion. Missing responses were therefore categorised as “unknown”.

The study was part of a research program approved by the University of Technology Sydney Human Research Ethics Committee.

Results

The survey was completed by 2477 individuals. Their characteristics are shown in Box 1 together with those for the Australian adult population. The respondents were comparable to the Australian population with respect to sex and income (median weekly household income for Australia is $12349, and the median weekly household income category reported by respondents was $1150–$1529). The youngest and oldest age groups were underrepresented in the survey compared with the Australian population and the proportion of respondents living in major cities was higher compared with that for Australian Health Survey participants.6

Respondents were in poorer health compared with those in the Patient Experience Survey8 in terms of the proportion who reported having a chronic disease and reported numbers of GP visits in the past year. Nearly two-thirds of respondents (1579/2477; 63.75%) reported going to the GP three or fewer times in the past year.

Most visits (1888/2477; 76.22%) lasted 5–19 minutes (consistent with a level B consultation). A lower proportion of respondents reported having private health insurance cover compared with those in the Patient Experience Survey.8

Most respondents reported that they had a usual general practice (2222/2477; 89.71%) and that they usually saw the same GP in the practice that they went to most often (1989/2477; 80.30%).

The survey question on bulk-billing referred to the most recent GP visit, regardless of whether that visit was with the respondent’s usual GP. Most respondents (2064/2477; 83.33%) reported that the practice they went to for their most recent visit bulk billed some or all patients. A majority of respondents (1763/2477; 71.17%) reported that their most recent GP visit was bulk billed, and the remaining 714 provided information about fees paid at their most recent visit.

Of those who were not bulk billed, the mean fee charged was $64.04. Taking into account durations of visits and corresponding MBS rebates, the mean out-of-pocket cost was estimated to be $34.09. These values exclude 189 respondents who reported being charged a fee less than the MBS fee associated with their visit duration (ie, those for whom an out-of-pocket cost estimate could not be calculated).

Of those who were not bulk billed, 39.92% (285/714) had an annual household income of less than $80 000. Of those who were bulk billed, 53.37% (941/1763) had an annual household income of less than $80 000.

The univariate analyses showed that all factors other than sex and duration of visit were associated with bulk-billing. Results of the multivariate logistic regression analysis, containing the remaining factors, are shown in Box 2. An OR of 1 or close to it indicates no association between a given factor and the odds of bulk-billing. Factors for which the 95% CI does not include the value 1 are statistically significant (P < 0.05).

These results show that there are higher odds of being bulk billed among patients with chronic diseases (OR, 1.28; 95% CI, 1.04–1.56), those with a concession card (OR, 3.12; 95% CI, 2.45–3.98) and those with private health insurance (OR, 1.39; 95% CI, 1.09–1.78). However, the odds of being bulk billed are lower for those on very high incomes compared with those on low incomes (OR, 0.54; 95% CI, 0.36–0.81) and for those living in inner and outer regional areas compared with major cities (OR, 0.59; 95% CI, 0.46–0.77 and OR, 0.67; 95% CI, 0.45–0.98, respectively).

Service-related characteristics were also important in explaining bulk-billing behaviour. Respondents with an appointment for their last visit had a lower odds of being bulk billed compared with those without an appointment (OR, 0.55; 95% CI, 0.43–0.72). Similarly, respondents who visited practices that had more than two GPs and those who reported not knowing how many practitioners were in a practice, had a lower odds of being bulk billed than those who attended a practice with one or two GPs (OR, 0.74; 95% CI, 0.57–0.96 and OR, 0.54; 95% CI, 0.38–0.78, respectively). The results of separate regressions including sex and duration of visit showed that neither of these factors was significant and did not add to the explanatory power of the analysis (data not shown).

Discussion

Our results indicate that while a high proportion of GP visits are bulk billed, nearly one-third of respondents paid a fee at their most recent visit. For some respondents, introduction of additional copayments would therefore not be a significant departure from the status quo. However, additional copayments would be novel for many patients and our analysis suggests that these could cause difficulties for a substantial proportion of those individuals.

We found a higher propensity to bulk bill individuals with lower income levels, those with chronic diseases and those with concession cards. These are the groups who would be the most disadvantaged by the introduction of additional copayments for GP visits.

Perhaps more surprising was the finding that having private health insurance was positively linked with being bulk billed, after adjusting for income and presence of a chronic disease. In a recent study, it was observed that Australian holders of private health insurance were more likely to be healthier than those without insurance.10

We speculate that healthier individuals might be more willing to discriminate between GPs on the basis of bulk-billing and better able to find bulk-billing practices. A more direct relationship between private insurance and bulk-billing is expected to emerge if a pilot program currently underway by IPN (Independent Practitioner Network) and Medibank Private to guarantee bulk-billing of GP appointments for Medibank members proves to be successful.11

Respondent region of residence was also associated with bulk-billing, with lower rates among residents of inner and outer regional areas despite higher bulk-billing incentive payments for GPs in regional, rural and remote areas. This is consistent with the results of a previous study in which an almost sevenfold higher odds of bulk-billing among GPs in metropolitan areas was observed compared with rural areas.4 This could reflect GP density rather than respondent-related factors; GP concentrations in major cities lead to greater price competition between practices for respondents, which results in an increased likelihood of bulk-billing.2,3 This diminishes as the concentration of practices reduces in less densely populated areas.

As well as respondent-specific factors, we analysed factors relating to visits and practices. Having an appointment was found to halve the odds of being bulk billed compared with not having an appointment. This might indicate that practices which are able to accept non-urgent “walk-ins” (owing to flexible schedules or availability of practitioners) have spare capacity hence are more likely to bulk bill to encourage demand. Alternatively, practices might discriminate and select patients who are prepared to pay by offering reduced waiting times. This requires further investigation at the general practice level.

Similarly, the impact of practice size on bulk-billing behaviour warrants closer investigation. Our results indicate that smaller practices (one or two practitioners) had a higher odds of bulk-billing than those with more practitioners and those in which the number of practitioners was not known by respondents (assuming that most respondents would be able to recall if a practice had one or two practitioners only, the latter category could be grouped with the “two or more” group). In practices with one or two practitioners, there may be less capacity to compete on the basis of service offerings (eg, multiple practitioners, co-located pathology services) and amenities, resulting in greater price competition. For these practices, increased rates of bulk-billing might be a key point of differentiation from other practices. This would reinforce the notion that practice structure, even allowing for the potential effects of flexible arrangements, is a determinant of billing practices.

A limitation of our study is that the sample differed in terms of chronic diseases, numbers of GP visits in the past year, age, region of residence and private health insurance status. The sample was representative in terms of income and sex distributions, but it is possible that there were other unmeasured differences related to self-selection into the online panel. Despite the differences, the large sample size meant that there were sufficient numbers within the relevant subgroups to provide the power to detect differences in the likelihood of being bulk billed, while controlling for effects of the remaining population characteristics.

We combined respondent-specific factors with respondent-reported practice characteristics to investigate demand and supply influences on bulk-billing. Both are important since changes in patient factors (eg, ability to pay for care) and GP factors (supply of care) influence the use of primary health care services.12 As expected, people with chronic diseases and those with low household incomes were less likely to be charged. We also found several interesting associations that warrant further research, such as that between health insurance status and bulk-billing, and that between general practice structure and bulk-billing. Nonetheless, our findings are relevant when considering potential changes to Medicare funding that might affect bulk-billing by GPs, which will affect individuals’ capacity to access services.

1 Characteristics of a sample of patients who completed a survey on their most recent visit to a general practitioner and of the Australian adult population (n = 2477)


Sample, number (%)

Australian adult population, %*


Chronic disease

1488 (60.07%)

45%

GP visits in past year


0 or 1

557 (22.49%)

32%

2 or 3

1022 (41.26%)

31%

4–11

748 (30.20%)

27%

12 or more

150 (6.06%)

10%

Female

1291 (52.12%)

51%

Age, years


16–24

134 (5.41%)

17%

25–34

540 (21.80%)

17%

35–44

520 (20.99%)

18%

45–54

509 (20.55%)

17%

55–64

421 (17.00%)

14%

65–74

296 (11.95%)

9%

75 or more

51 (2.06%)

8%

Unknown

6 (0.24%)


Region of residence


Major city

1824 (73.64%)

63%

Inner regional

365 (14.74%)

20%

Outer regional or remote

168 (6.78%)

17%

Unknown

120 (4.84%)


Private health insurance


Yes

525 (21.19%)

55%

No

1732 (69.92%)


Unknown

220 (8.88%)


* Data on chronic diseases, GP visits and private health insurance were obtained from the Patient Experience Survey;8 data on sex and age were obtained from the Census;9 and data on region of residence were obtained from the Australian Health Survey.6

2 Odds ratios for factors associated with bulk-billing (n = 2467)


* Multivariate regression statistic Wald χ2 = 222.68 (< 0.001). Bars represent 95% CIs. For each category except age, the base factor appears without a 95% CI and straddles the line at 1. The number of respondents included was reduced by 10 due to six missing observations for age and four missing observations for concession card status. † P < 0.05 compared with base factor.

Thanks for the ride, Gough

Being involved in politics during the Whitlam era was exhilarating

I have met every Prime Minister since Gorton, save Rudd. Most of these encounters have been fleeting and now, as those who were the young Ottomans of the seventies approach the age where they put their 70-year-old feet on the ottomans, it is interesting to reflect on Gough Whitlam, whose memorial service echoes in my ears as I write.

Everybody has an anecdote about Gough. Mine is about a night in 1973 when I was leaving Parliament House with John Knight, who later became Senator for the Australian Capital Territory before tragically dying in 1981 at the age of only 37. On the steps of Parliament House, we encountered Graham Freudenberg, who was working for Gough at the time. Both John Knight and I were on opposition leader Bill Snedden’s staff. However, staffers, irrespective of party affiliation, were generally on good terms, and Graham — Freudy, as he was known when we were all in a bibulous frame of mind — in the ecumenical spirit of the times, invited us both to a party.

We got lost going to the party in John Knight’s Datsun, but, spying a phone box, Freudenberg suggested we call for reinforcements. Five minutes later, after a brief phone conversation, around the corner came nothing other than C1, the Prime Minister’s car. I said to Freudenberg, “Not every day of the year that the principal private secretary of the leader of the opposition has the opportunity to ride in C1. You go with Knighty and follow us.” Freudenberg agreed; Gough’s driver, whom I also knew, agreed — and for about 5 minutes of borrowed splendour, I did what no other opposition staffer had, to my knowledge, ever done — ride in solitude in the back seat of the Prime Minister’s car, chatting with the PM’s driver.

It was a bloody good party. I never knew why the car was there. Gough was not. After this escapade, there were apparently some murmurings, but nothing of any moment until, one day some weeks later, I met the Prime Minister coming up the stairs of Parliament House. He half turned and, with that Gough smile, boomed: “I hope you enjoyed the ride the other night, Jack.” And that was that. Generosity, wit, tolerance. That was 1973. Kerr and Fraser with their “genius” Barwick were yet to come.

Gough was one of those figures who, in a short time, oversaw long overdue social changes. Even working on the opposite side of the House, it was an exhilarating period in Canberra. Gough with all his expansionary vision for his Australia, however, was “easy meat” in the first Budget, when the worldwide recession hit with the collapse of the Bretton Woods agreement, coupled with the oil crisis when petrol prices soared. His lack of economic savvy was at the heart of Gough’s ultimate failure, and, although his oratory has not lasted down the ages, Bill Snedden made a very good speech in reply to this first Budget.

The pathway Whitlam strode along was littered with an array of beautiful bulbs, some of which germinated into delightful blooms. Others (such as Salvado in Western Australia, one of a number of projected growth centres) barely germinated.

I remember the battle over the introduction of Medibank, and the calm, logical manner with which Bill Hayden confronted his adversaries. He was well briefed by John Deeble and Dick Scotton, Medibank’s architects, with the ubiquitous man in black, Paddy McGuinness, Hayden’s then economic adviser, lurking in the background. That Medibank involved changes to the payment systems to both doctors and hospitals was perceived as a direct challenge to the private health funds and the Australian Medical Association (as if fee-for-service medicine was ever at risk and hospital funds would be run out of business).

Much of the political noise was about disturbing the sanctity of the doctor–patient relationship and subjecting doctors to compulsion. Abortion and the rights of the woman versus those of the unborn child were debated as a form of subplot, a surrogate for Whitlam wickedness. There was talk about socialised medicine and dark forebodings about the consequences if Medibank came to fruition. There was the Hospitals and Health Services Commission, which fitted more to the grand Whitlam design because it spread the federal umbrella of centralised control. That exercise ultimately failed, existing only from 1972 till 1978, but the Hayden Medicare plan did succeed after the double dissolution election of 1974 resulted in Whitlam being re-elected.

To Whitlam’s credit, the legislation was passed by a joint sitting of the two houses of federal parliament, although he was never as sure-footed with this as he was with other of his proposals because it needed the detailed financial attention that Hayden could provide in ensuring it ultimately came into being in 1975.1 However, Whitlam was the chief steward, and if he had not supported it as he did, then even with Hayden and the myriad Labor doctors such as Moss Cass, they would never have seen it through.

At the heart of the Medibank system was community rating and a sense of equity in that everybody was entitled to both a government-paid hospital bed and treatment as a public patient. The government pricing system in what is now Medicare has been more or less successful. It is long overdue for review — but that is another tale.

It is interesting that the United States is experiencing similar hysteria about Obamacare, which, although untidy, is attempting to do what has long been accomplished in Australia — make reasonable health care available to the whole population.2 There are elements of compulsion in the provisions of the Affordable Care Act, just as there were in Australia’s original Medibank proposal. A taxation levy was designed to pay for Medibank. This provision was resisted longest by the conservative forces.

The other provisions that send the reactionary teabag wavers into a political spin is the centralisation of power, whether this be in Washington or Canberra. Most of the debate then degenerates into power struggles. The US Republican states call the current White House the bastion of socialised medicine. So long as the matters of compulsion and federal–state imbroglio are allowed to fester, any national health scheme is at risk. In the US, the threat is to repeal — but to what?

I pondered as I listened to the Whitlam memorial service and the litany of achievements that Gough promoted. Had those eulogists not missed one very significant achievement — the 1974 passage at a joint session of the federal parliament, the enabling legislation? The health debate after 1974 was reduced to skirmishes which, at times, became personal and ugly, but the integrity of Medibank, transmuted into Medicare, has remained. Not a bad achievement and, for a period, I was there.

Thanks Gough. I enjoyed the ride.

What can we do to help Australians die the way they want to?

A different service mix could better meet end-of-life care needs for little additional cost

Australians are not dying as they would wish. Surveys consistently show that between 60% and 70% of Australians would prefer to die at home, and that residential care facilities are their least preferred option.1

Dignity, control and privacy are important for a good death. Choice over who will be present, where people will die and what services they will get, matters. People want their symptoms to be well managed, and they want personal, social and psychological support. It is important to have the opportunity to say goodbye and leave when it is time to go without pointlessly prolonging life.2

But dying is now highly institutionalised. Over the past century, the proportion of deaths at home has declined and that of deaths in hospitals and residential aged care has increased. Today only about 14% of people die at home in Australia. Fifty-four per cent die in hospitals and 32% in residential care. Home and other non-institutional deaths are about half as prevalent in Australia as they are in New Zealand, the United States, Ireland and France.3

Paradoxically, the likelihood and timing of death is now more predictable and there is more opportunity and time to prepare for death because people are now much more likely to die from chronic disease in old age. But dying is not discussed, and we are not taking the opportunity to help people plan and prepare for a good death. As a result, many experience a disconnected, confusing and distressing array of services, interventions and relationships with health professionals when they are dying.

Having the conversation

When asked, most people have clear preferences for the care they want at the end of their life. But these preferences are rarely articulated, and they are not supported by the open, systematic conversations that are needed to ensure effective end-of-life care plans. Instead there is an unspoken faith that science and medicine can put off the inevitability of death.4,5

As a result, intrusive and burdensome interventions, including emergency and hospital admissions and intensive care often continue when there is little point. Palliative care is not discussed, offered or provided, and services are variable, inconsistent and fragmented, particularly for support at home and in the community. Women, single people, older people and Indigenous people die in hospital at a higher rate than the general population. People with culturally and linguistically diverse backgrounds and those from rural communities are more likely to find access to services more difficult.6 These issues will become more prominent in public policy as the baby boomers age and the crude death rate doubles over the next 25 years.7

Four reforms would facilitate a good death. First, we need more public discussions about the limits of health care as death approaches, and what we want for the end of life. Second, the public discourse needs to be translated into personal choices. People need to plan better to ensure that their desires for the end of life are complied with. Third, we need to ensure that if patients have expressed wishes about the care they want at end of life, those wishes are followed. Fourth, services for those dying of chronic illness need to be reoriented so that they focus more on people’s wishes to die at home and in homelike settings, rather than in institutions.

Encouraging people to plan for death

Failure to talk about and plan for death in advance is one of the most significant obstacles to improving the quality of dying. Having these conversations and making these plans is not easy. When death is near and the quality of life is low, it is hard to know how far to pursue treatment, especially when the treatment is stressful, intrusive and likely to further reduce quality of life. Decision making is even more stressful if there has been no previous discussion about treatment preferences so that choices must be made in the pressure cooker environment of a hospital.

Public education programs have been used with great success in other parts of the health sector to educate the public and set the preconditions for policy change.

People could be encouraged by a public education campaign to consider and discuss their end-of-life preferences with their families and appropriate health care professionals, and document them in advance care plans. A national public education campaign would focus on encouraging people to discuss their preferences and choices for end-of-life care with health professionals, including general practitioners.

We estimate that a national campaign of 12 to 18 months’ duration that encompassed mass media, public relations, online and digital media, direct marketing and education campaigns would cost $10 million.

There are now well developed and effective approaches for systematic discussion of end-of-life treatment and care and the development of advance care plans. Yet much greater encouragement and incentives are required to ensure that those plans are much more widely implemented.8

Health professionals are in the best position to initiate end-of-life discussions. However, they must shift their focus from prevention, cure and rehabilitation at appropriate points in time if these conversations are to occur. It is therefore important that it becomes normal and expected practice for health professionals to discuss and plan for end of life with their patients when it is appropriate. End-of-life plans are personal expressions. They should set out personal choices about the type and level of intervention a person wants: from aggressive intervention through to less interventionist and palliative care.

Initiating discussions about intentions at the end of life can be hard so we propose that “trigger points” for mandatory discussions about intentions be introduced:

  • during health assessments for people aged over 75 years;
  • for all residents of aged care facilities and for high-needs recipients of home-based care packages as part of assessment and care planning; and
  • for all hospital inpatients who are likely to die in the next 12 months.

Advance care plans are important, but are not in themselves enough to ensure that the wishes of dying people are met and that end-of-life care is improved. Additional measures need to be in place to ensure that plans are implemented as part of systematic and patient-centred end-of-life care.

What is needed for good end-of-life care?

Good care at the end of life is coordinated and multidisciplinary. Yet this is difficult in Australia’s largely siloed health system. As well, people receiving palliative care often transfer between health care settings, such as home, general practice, specialist medical, outpatient subacute, residential care and hospital.

It is essential to improve the coordination of end-of-life care, as hard as that is to do in a fragmented system. Effective strategies include the use of care coordination, case conferencing and team discussion. People who are dying often need a well qualified and authoritative health professional to act as an advocate for them to get the care they need.

Legislative frameworks and guidelines for advance care plans need to change. They should include clear mechanisms for assigning specific responsibility to health care professionals to coordinate and implement plans when people enter end-of-life care.

If the wishes of most Australians to die at home are to be met, end-of-life care will have to change. More support for dying at home will be required.

Carers say they do not get the support they need from partners, family or health professionals. The end of life does not follow a common trajectory. Often patients who have been discharged home will have a crisis episode that carers have to manage. The inability to manage a crisis at home is one of the main reasons that people at the end of their life are admitted to hospitals via emergency departments. It is not surprising that carers struggle to cope: only 13%–18% of carers report that they could access services such as health professionals, community organisations and government services in a crisis.9

It is clear that community-based palliative care can reduced the burden on carers and significantly increase the proportion of people who are able to die at home. But this will require a significant increase in the availability of community-based palliative care. Packages to support dying at home include coordination, nursing and personal care, specialist medical services where required, carer support and respite.

The number of people dying at home would have to double to reach 30% of all deaths, a level comparable to Korea, Singapore, Ireland, France, Austria, Croatia, the United States, Cyprus and New Zealand. To support these people with home-based care packages would require 39 000 more packages per year to be made available for those who are likely to die within the next 3 months.3

What will it cost?

We estimate that the average cost of community palliative care packages is about $6000 for the last 3 months of life. Extending the availability of community packages to enable 30% of Australians to die at home would require an additional investment of $241 million.10

Increased home and community care for the dying is likely to reduce the demand on hospital and residential aged care services. If that demand declined in proportion to the increased number of people dying in the community, we estimate that costs would reduce by $324 million in acute and subacute hospital sectors and $275 million in residential care institutions for an overall saving of $50 million.

Taking into account the additional estimated cost of community-based palliative care packages and the savings in residential and hospital services, a net cost of $84 million is estimated as a result of the increase in community-based support for people who are dying.