×

Health at the core of closing the gap

AMA President Associate Professor Brian Owler has warned that governments need to increase their investment in health in order to close the yawning gap in life expectancy and wellbeing between Indigenous people and other Australians.

In a veiled swipe at the Federal Government’s policy focus on school attendance and employment in Indigenous communities, A/Professor Owler told a major international conference on the social determinants of health that too often the importance of wellbeing was overlooked.

“Health is the cornerstone on which education and economics are built,” the AMA President said. “If you can’t go to school because you or your family are sick, truancy officers won’t work. If you can’t hear because of otitis media, you won’t learn. If you miss training opportunities because of depression or ill health, you won’t progress to employment. You can’t hold down a job if you keep having sick days.”

His remarks to a British Medical Association symposium on the role of physicians in addressing the social determinants of health came a month after Prime Minister Tony Abbott admitted that the nation had fallen behind on meeting most of its Closing the Gap targets.

While there has been some improvement in the life expectancy of Aboriginal and Torres Strait Islander people, Indigenous men still on average 10.6 years earlier than other Australian males, and the gap for women is 9.5 years.

In his speech, A/Professor Owler said that in many respects the term ‘social determinants of health’ was misconstrued, because health was in fact a determinant of social and other outcomes.

He said the fact that chronic and non-communicable diseases and other preventable occurrences such as suicide, trauma and injury accounted for a major proportion of the gap in life expectancy underlined the need for greater investment in health care, particularly Aboriginal community controlled health services.

“While those with chronic disease need to be cared for, prevention, particularly in the early part of life, is the key if we are going to see a generational change in health outcomes,” A/Professor Owler said.

He said hard-earned experience showed that health was fundamental to closing the gap, as was the need to work in partnership with Indigenous communities themselves.

“There have been many examples of governments trying to address the social determinants of health – but often they have failed,” he said, referring to policies including building inappropriate housing and taking children from their families.

The AMA President said any attempt to improve Indigenous health needed to acknowledge the fundamental importance for Aboriginal and Torres Strait Islander people of their connection with the land, and understand that in many Aboriginal languages health was a concept of social and emotional wellbeing rather than a physical attribute.

He told the London conference that this was one of reasons why the AMA was a foundation member of the campaign to achieve constitutional recognition for Indigenous Australians.

“Constitutional recognition is a vital step towards making Aboriginal and Torres Strait Islander people feel historically and integrally part of the modern Australian nation,” A/Professor Owler said. “Recognising Indigenous people in the Constitution will improve their self-esteem, their wellbeing, and their physical and mental health.”

Prime Minister Tony Abbott has taken a personal interest in Indigenous affairs, concentrating responsibility for many Indigenous policy areas within the Department of Prime Minister and Cabinet and overseeing the development of the Indigenous Advancement Strategy.

Priorities for the Strategy include improving school attendance, boosting Indigenous employment and improving community safety.

A/Professor Owler said these were all worthy aims, but the Strategy overlooked the central importance of health.

“What is missing from the core of the IAS is a focus on health,” the AMA President said. “Health underpins many of these outcomes. We need to get the balance right and we, the AMA, need to ensure that health is seen as a foundation to these outcomes.”

He said that “spending on health is an investment. Investing in health must underpin our future policies to Close the Gap, and to address what is, for Australia, a prominent blight on our nation”.

Adrian Rollins


AMA in the News – 7 April 2015

Your AMA has been active on policy and in the media on a range of issues crucial to making our health system better. Below is a snapshot of recent media coverage.

Print/Online

E-health record scheme a $1b flop, Hobart Mercury, 27 February 2015
The botched Personally Controlled Electronic Health Record program has been operating for nearly three years but fewer than one in 10 Australians has one. AMA President A/Professor Brian Owler said the scheme remains in limbo, and to have spent that much money and yet still not have anything of widespread value was terrible.

Upfront payments for doctors, Australian Financial Review, 3 March 2015
Health Minister Sussan Ley could end Medicare’s universal “fee for service” approach and pay GPs a lump sum per patient, rather than for each visit. Ms Ley has been in constant contact with AMA President A/Professor Brian Owler about potential changes to Medicare.

Dumped policy to cost $1bn, The Australian, 4 March 2015
Tony Abbott has dumped the GP co-payment but maintained a freeze on Medicare payments to general practitioners. AMA President A/Professor Brian Owler warned the freeze would force bulk billing rates down and increase out-of-pocket expenses for private health insurance policyholders.

Medicare rebate freeze to stay, Australian Financial Review, 4 March 2015
The Federal Government will keep more than $1 billion by freezing indexation of Medicare rebates, but has dumped the GP co-payment. AMA President A/Professor Brian Owler welcomed the decision to axe the co-payment, but said keeping the Medicare rebate indexation freeze was lazy reform.

Ley rules out bulk billing means test, Australian Financial Review, 5 March 2015
Health Minister Sussan Ley has ruled out means testing bulk billing as fix in the search for savings to replace the dumped $5 GP co-payment. The Minister said the Government will persist with its search for policies that would impose a value signal on Medicare. AMA President A/Professor Brian Owler said he was happy to co-operate with Ms Ley but did not agree a price signal had a place in primary care.

Don’t be shy about health, MX Sydney, 5 March 2015
New research shows Australians are still choosing to suffer in silence, instead of talking about an awkward health problem. AMA Chair of General Practice Dr Brian Morton said self-treating basic conditions is fine, but alarm bells should ring if the conditions are recurring.

Co-payment could still happen as GP gap-fee option considered, The Age, 9 March 2015
Despite declaring its Medicare co-payment dead, the Government is considering proposals to give GPs the option of charging gap fees for bulk billed patients. AMA President A/Professor Brian Owler said the AMA had long supported such a change, which he said would benefit patients who are currently privately billed.

Why we can’t keep trusting celebrity diet books, Women’s Weekly, 10 March 2015
AMA Vice President Dr Stephen Parnis said we live in an era where people sometimes equate celebrity with expertise, which is not the case. At best, alternative health and diet advocates may advocate something which is supposed to be therapeutic, but actually has no effect. But, at worst, it can be dangerous, he warned.

‘Price signal’ would hit old, poor hardest, The Age, 19 March 2015
Patients who visit the doctor most often tend to be older and poorer than those who visit their GP less, and would be hardest to hit by the introduction of a price signal. AMA President A/Professor Brian Owler said the data undermined the arguments of some proponents of a Medicare co-payment.

Valley of the unwell, The Herald Sun, 19 March 2015
The Goulburn Valley has emerged as the sickest spot in Victoria, with more than one in six residents seeing a GP more than 12 times a year. AMA President A/Professor Brian Owler said the report showed people who most frequently visited their GP have complex and chronic conditions.

Make vaccination law, The Sunday Telegraph, 22 March 2015
The Sunday Telegraph has launched a national campaign for pregnant women to get free whooping cough boosters in the third trimester. AMA President A/Professor Brian Owler called on Federal Health Minister Sussan Ley to fund the boosters.

Call to name medical ‘bad apples’, Sydney Morning Herald, 24 March 2015
Medical specialists who charge exorbitant fees should be named and shamed in a bid to rein in excessive charging. AMA Vice President Dr Stephen Parnis said more doctors than ever were accepting fees set by private health insurers, and almost 90 per cent of privately insured medical services were delivered with no out-of-pocket cost to the patient.

Doctors to anti-vaxxers: you’re endangering kids, The News Daily, 24 March 2015
AMA Vice President Dr Stephen Parnis told The News Daily that anti-vaccination groups don’t know better than the weight of evidence from the medical and scientific profession.

Misogyny in medicine: don’t put up with it, The Age, 25 March 2015
AMA President A/Professor Brian Owler said he was proud of Australia’s medical profession and added it was challenging to hear assertions that doctors were acting in unacceptable ways, particularly when it came to sexual harassment.  

Radio

A/Professor Brian Owler, 666 ABC Canberra, 18 February 2015
AMA President A/Professor Brian Owler talked about the proposed $5 cut to Medicare rebates and the prospect of a $5 co-payment for GP visits still on the table. A/Professor Owler said the idea floated by the Federal Government had not been raised with him.  

Dr Stephen Parnis, Radio Adelaide, 23 February 2015
AMA Vice President Dr Stephen Parnis said he was concerned about the Trans-Pacific Partnership trade agreement and what it could mean for affordable health care, with fears it could raise the cost of drugs and limit access to biological agents used in treatments.

A/Professor Brian Owler, 666 ABC Canberra, 3 March 2015
AMA President A/Professor Brian Owler discussed the Federal Government’s decision to abandon the GP co-payment. A/Professor Owler said it was a good result for GPs and their patients because the policy was poorly designed.

A/Professor Brian Owler, Radio National, 3 March 2015
AMA President A/Professor Brian Owler talked about the Federal Government dumping the Medicare co-payment. A/Professor Owler said the AMA would not support a mandatory price signal, but did not see it as unreasonable for patients who can afford it to make a modest contribution to the cost of their care.

A/Professor Brian Owler, 4BC Brisbane, 31 March 2015
AMA President A/Professor Brian Owler talked about the Federal Government changing aviation rules to require two people in a cockpit at all times. The AMA is not sold on the idea of doctors who treat pilots being able to break doctor-patient confidentiality if they think a pilot is unfit to fly.

Television

A/Professor Brian Owler, ABC News 24, 3 March 2015
AMA President A/Professor Brian Owler talked about the Government dumping the GP co-payment. A/Professor Owler said the tragedy of this whole negotiation period was that other pressing health issues had been neglected.

A/Professor Brian Owler, Sky News, 3 March 2015
AMA President A/Professor Brian Owler discussed the dumped Medicare co-payment and the Medical Research Future Fund.

A/Professor Brian Owler, Channel 9, 17 March 2015
AMA President A/Professor Brian Owler discussed suggestions that teenagers should undergo a psychological assessment before any cosmetic surgery. A/Professor Owler said cosmetic surgery was the source of a number of patient complaints.

Mapping the diagnosis of autism spectrum disorders in children aged under 7 years in Australia, 2010–2012

The early diagnosis of children with autism spectrum disorder (ASD) is a critical step in gaining access to early intervention, providing optimal opportunity for developmental benefits by taking advantage of early brain plasticity.1 The age at which intervention begins has been associated with improved outcomes, with younger children showing greater gains from intensive early intervention.2,3 Although research suggests ASD can be reliably diagnosed by the age of 24 months,4,5 a recent review found that, on average, diagnosis is delayed until 3 years, with the average age at diagnosis ranging from 38 to 120 months across 42 studies conducted across the United States, United Kingdom, Europe, Canada, India, Taiwan and Australia.6

Many factors have been found to influence the age at which ASD is diagnosed, including the characteristics of the child, the clinical presentation, sociodemographic characteristics, and parental concerns and behaviour.6 These factors may interact with characteristics of the local community, the health professional and health service to differentially influence the age at which children are identified and diagnosed with ASD in any local area.6

There are limited data on the age and frequency of ASD diagnoses across all states and territories in Australia which, given the ethnically diverse and geographically dispersed population, would provide an important national and international comparison.

In this study, we sought to establish the age at which children registered with the Helping Children with Autism Package (HCWAP) in Australia currently receive a diagnosis. We also investigated trends in diagnosis across states, regional and rural areas, and child characteristics. Diagnostic groups within the autism spectrum, as specified in the fourth edition of the Diagnostic and statistical manual of mental disorders (DSM-IV),7 as well as the combined ASD group (consistent with fifth edition of the DSM8) were examined, to facilitate comparisons over time.

Methods

Study population and measures

We used de-identified data on 15 074 children (12 183 boys [81%] and 2891 girls [19%]) who received support through the HCWAP between 1 July 2010 and 30 June 2012. Data were collected and managed by the former Australian Government Department of Families, Housing, Community Services and Indigenous Affairs (FaHCSIA; now the Department of Social Services). To be eligible for the HCWAP, children must be Australian residents, aged under 7 years and have a documented diagnosis of ASD consistent with DSM-IV criteria from a paediatrician or psychiatrist, or after a multidisciplinary team assessment (involving a psychologist and speech pathologist).

The database contained the following information: age at diagnosis (months), state and postcode of residence, diagnosis, sex, Aboriginal and Torres Strait Islander status and culturally and linguistically diverse (CALD) status. The postcode was used to match age at diagnosis to geographical and population data.

Ethics approval was received from the La Trobe University Faculty of Science, Technology and Engineering Human Ethics Committee.

Age at diagnosis

Children’s age at diagnosis was calculated by subtracting their date of birth from the month and year that their diagnosis was confirmed, and rounded to the closest month.

Accessibility/remoteness index of Australia

The Accessibility/remoteness index of Australia (ARIA), developed by the Australian Bureau of Statistics, is a measure of remoteness, aggregated into the following categories: major cities; inner regional; outer regional; remote; very remote and migratory.

Estimates

The numbers of children at each year of age under 7 years (obtained from Australian Bureau of Statistics estimates) were summed and averaged over the period of 30 June 2010 to 30 June 2012 to create population estimates aligned to the study period and age group.

The estimated incidence of ASD was conservatively calculated as 1% of the population of children aged 0–7 years, based on estimates presented in the research literature from Australia (1/119 or 0.84%,9 1/106 or 0.94%10) the UK (98/10 000 or 0.98%)11 and US (1/68 or 1.47%).12

Statistical analysis

We conducted non-parametric comparisons (Kruskal–Wallis and Mann–Whitney U-Tests) because age at diagnosis for the study population was not normally distributed, and sample size varied across groups. Bonferroni adjustments controlled for multiple comparisons, and a conservative α (P < 0.01) was adopted.

Results

Age at diagnosis

The average age at diagnosis of ASD between 1 July 2010 and 30 June 2012 in children aged under 7 years and registered with the HCWAP was 49 months. As shown in Box 1, children with autistic disorder were diagnosed 7 months earlier than children with pervasive developmental disorder — not otherwise specified (PDD-NOS) and 16 months earlier than children with Asperger’s disorder (AspD) (χ2 = 1614.67; df = 2; P < 0.001; ɳ² = 0.11). Less than 3% of children with ASD were diagnosed by 24 months (Box 2). A clear spike in the frequency distribution of age at diagnosis was evident at 71 months (Box 3), indicating the most frequently reported age at diagnosis of ASD (under 7 years) nationwide in the HCWAP database.

Mapping the average age at diagnosis of ASD in children registered with the HCWAP across Australia showed small but significant differences between states (χ2 = 146.69; df = 7; P < 0.001; ɳ² = 0.01). To reduce the number of post-hoc comparisons, states were grouped into logical clusters by ascending age at diagnosis. There were significant differences in age at diagnosis between these clusters of states, with children registered with the HCWAP in Western Australia and New South Wales diagnosed earlier than in other states (Box 4).

Frequency of autism spectrum disorder diagnoses

On the basis of HCWAP data, 0.74% of children aged under 7 years in Australia (72/10 000) were diagnosed with ASD between 2010 and 2012. Case ascertainment rates were calculated to determine if differences could be attributed to the number of children at an eligible age. Using 95% CIs, state-level differences were evident, with the highest ascertainment rate in Victoria and lowest in the Northern Territory (Box 4). Differences were also evident between states across diagnostic subgroups; using 95% CIs, a smaller proportion of children than expected with AspD were diagnosed in WA, Tasmania and the NT compared with other states (Appendix 1).

Age at diagnosis by remoteness

Significant differences in age at diagnosis were evident between major cities and regional areas (χ2 = 61.64; df = 4; P < 0.001; ɳ² = 0.004; Appendix 2). There was no statistically significant difference in age at diagnosis across major cities, remote and very remote areas, probably because of differences in sample size between these groups. However, ASD was diagnosed, on average, slightly earlier in remote areas, and 5 months later in very remote areas, compared with in major cities, although these differences were not significant.

Age at and frequency of diagnosis by child characteristics

Although girls registered with HCWAP were diagnosed, on average, 1 month earlier (48 months) than boys (49 months), this difference was not significant considering the conservative α adopted (U = 17 177 845; z = − 2.06; P = 0.04; r = 0.02). No difference was evident in the age at diagnosis of children of Aboriginal and Torres Strait Islander origin registered with HCWAP (U = 3 455 468.5; z = − 1.77; P = 0.08; r = 0.02), but children from a CALD background were diagnosed, on average, 5 months earlier (U = 9 444 467.5; z = − 10.36; P < 0.001; r = 0.08). On the basis of 95% CIs, a smaller than expected proportion of children of CALD and Aboriginal and Torres Strait Islander backgrounds with AspD were identified (Appendix 3).

Discussion

The average age at diagnosis of ASD in children aged under 7 years registered with HCWAP is 49 months, with the most frequently reported age being 71 months. Given that research suggests a reliable and accurate diagnosis is possible for many children with ASD at 24 months,4,5 this finding represents a possible average delay of 2 years (and common delays of up to 4 years).

The increase in frequency of ASD diagnoses at 6 years of age may be attributable to children’s ASD being identified when they enter school, aged about 5 years, and the associated delay for diagnostic assessments. The end of the eligibility period for funding through the HCWAP (at age 7) may also contribute to the increase in diagnoses at 6 years of age. Further, there may be a subgroup of children who are diagnosed later because of factors in their clinical presentation, such as comorbid conditions or the presentation being less severe.

Previous research reported an average age at diagnosis of 4 years in WA and 3 years in NSW in 1999 to 2000,13 with a decrease in age at diagnosis from 4 to 3 years in WA between 1983 and 2004.14 In comparison, we found an average age at diagnosis of 3 years and 10 months in WA and 3 years and 11 months in NSW. These differences may reflect differences in study methods; for example, Nassar et al used the year of entering the data registry as a proxy variable for age at diagnosis in 77% of cases, and the difference between studies may therefore be explained by the limited accuracy of this variable.14

The number of children currently diagnosed with ASD and registered with the HCWAP suggests that the incidence of ASD in Australia has increased substantially from previous estimates. In 1999–2000, the incidence of ASD in 0–4-year-olds was reported to be 5.1 per 10 000 in NSW and 8.0 per 10 000 in WA.14 The national prevalence of ASD in 0–5-year-olds was estimated to increase from 16.1 to 22.0 per 10 000 from 2003 to 2005.15 Our study indicates that more than three times this many children are currently diagnosed with ASD and registered with the HCWAP. While reasons for the observed increase in ASD diagnoses remain largely unknown, many possible contributing factors have been suggested, including changes to the diagnostic criteria, improved awareness and diagnostic sensitivity.16

Delays of 3 to 6 months in age at diagnosis were evident between states, which may be clinically meaningful if they translate into equivalent delays in access to early intervention and family support services. Local differences in age at diagnosis have also been reported in the UK,17 US18 and Canada;19 suggesting that characteristics of local health care systems play a role in determining diagnostic timing.

Case ascertainment rates indicate that a larger proportion of children with ASD were identified in Vic and less than half of the expected children with ASD were identified in WA, the ACT and NT. There are many possible reasons for these differences, including the uptake of HCWAP across states, diagnostic substitution, and/or a greater tendency to diagnose ASD after the age of 7 years.

Children were diagnosed earlier in major cities compared with regional Australia. This is consistent with international research and probably the result of reduced access to health services.17,20,21 The possible earlier diagnosis of children in remote areas compared with major cities may reflect longer waiting times for specialist services in highly populated areas.22

This is the first study to investigate trends in the diagnosis of ASD in Indigenous Australians, with results indicating no difference in age at diagnosis. A smaller proportion of children of Aboriginal and Torres Strait Islander origin than expected were diagnosed with AspD before age 7 years, suggesting that children of Aboriginal and Torres Strait Islander origin with a less severe clinical presentation may not currently be identified early.

Children from a CALD background received a diagnosis 5 months earlier than other children. Most studies investigating age at diagnosis in ethnic minority groups have reported either no association21,23 or that children from a minority background are diagnosed later.24,25 A smaller proportion of children from a CALD background were diagnosed with AspD, which may account for the overall earlier age at diagnosis in these children.

A few limitations should be noted. The exclusion of children aged 7 years and over (in accordance with HCWAP eligibility) may have resulted in an underestimation of the age at diagnosis of ASD in Australia. The dataset only included families who registered to receive funding through the HCWAP. Although this is the most complete dataset currently available in Australia, it is possible that some cases were missed as families either chose not to register or were unaware of the HCWAP. Also, we were not able to confirm the reliability of diagnoses.

Despite these limitations, this study provides an important examination of trends in the diagnosis of ASD and suggests there may be a substantial gap between the age at which a reliable and accurate diagnosis is possible and the average age at which ASD is diagnosed in Australia. Future research should examine this gap, and investigate barriers that delay the diagnosis of ASD to ensure that families and communities can benefit from best-practice approaches to early intervention.

1 Average age at diagnosis of autism spectrum disorders across diagnostic groups

Diagnostic group

No. (%) of children

Mean age in months (SD)*

Median age in
months (95% CI)


Autistic disorder

10 263 (68.1%)

46.5 (13.6)

45 (45–46)

Asperger’s disorder

2 164 (14.4%)

59.5 (10.6)

61 (60–62)

Pervasive developmental disorder —
not otherwise specified

2 626 (17.4%)

51.1 (13.5)

52 (51–53)

Autism spectrum disorder (combined group)§

15 074

49.2 (14.0)

49 (49–49)


* Mean age in months (SD) is reported for comparison with other studies. † Significantly different from autistic disorder (P < 0.001). ‡ Significantly different from Asperger’s disorder (P < 0.001). § Children with childhood disintegrative disorder and Rett’s disorder are included in the total sample but are not reported by diagnostic group because of the very low frequency of these disorders.

2 Frequency of diagnoses and proportion of children diagnosed with autism spectrum disorder by age group

Age group

No. of children diagnosed

Percentage (95% CI)


< 24 months

395

2.6% (2.4%–2.9%)

25–36 months

2905

19.3% (18.6%–19.9%)

37–48 months

4052

26.9% (26.2%–27.6%)

49–60 months

3914

26.0% (25.3%–26.7%)

61–72 months

3578

23.7% (23.1%–24.4%)

73–84 months

230

1.5% (1.3%–1.7%)

3 Frequency distribution of age at diagnosis of autism spectrum disorder in children younger than 7 years in Australia


PDD-NOS = pervasive developmental disorder – not otherwise specified.

4 Frequency of and age at autism spectrum disorder diagnoses as a proportion of state population estimates


No. of children diagnosed

Age at diagnosis (months)


Case ascertainment


Cluster*

State

Median (95% CI)

Range

Population (N)

Expected Incidence

Ascertainment (95% CI)


1

Western Australia

930

46 (45–47)

15–81

218 051

2 181

42.6% (40.3%–45.8%)


New South Wales

4 735

47 (46–47)

19–83

656 880

6 569

72.1% (70.0%–74.0%)

2§

Tasmania

335

49 (48–51)

22–83

44 561

446

75.1% (67.0%–83.0%)


Victoria

4 771

50 (49–50)

15–84

489 659

4 897

97.4% (94.3%–99.8%)


South Australia

1 076

50 (48–51)

17–81

136 348

1 363

78.9% (74.3%–83.7%)

3§

Australian Capital Territory

149

51 (47–55)

16–83

33 411

334

44.6% (37.8%–52.2%)


Queensland

2 980

52 (51–52)

16–83

425 968

4 260

70.0% (67.5%–72.5%)


Northern Territory

97

53 (50–58)

25–75

25 811

258

37.6% (30.5%–45.5%)


Total

15 074

49 (49–49)

15–84

2 030 690

20 307

74.2% (72.8%–75.2%)


* WA and NSW were combined for analysis as there was no statistically significant difference in the average age at diagnosis between states (P = 0.36). There were no statistically significant differences between Tas, Vic and SA (P = 0.94), or between ACT, QLD and NT (P = 0.84), with these states also grouped for analysis. † State population estimates of children aged under 7 years. ‡ Expected incidence is calculated as 1% of the population (N). § Significantly different from cluster 1 (P < 0.001). ¶ Significantly different from cluster 2 (P < 0.001).

Reduced breast milk feeding subsequent to cosmetic breast augmentation surgery

Breastfeeding is beneficial for infants and their mothers. It protects against diarrhoea, respiratory tract and other infant infections, atopic dermatitis, asthma, obesity, diabetes and cancer.1,2 Although exclusive breastfeeding achieves optimal infant growth and development, the World Health Organization recognises that providing some breast milk to the infant is better than none.3 For mothers, breastfeeding has a contraceptive effect, and reduces the risk of type 2 diabetes, breast cancer and ovarian cancer.1

Cosmetic breast augmentation is the most common plastic surgical procedure, and its use is rising dramatically. In Australia, this surgery increased by 150% between 2001 and 2011.4 In the United States, the estimated increase for this period was 45%, although this followed a 550% increase from 1992 to 2000.5 In the United Kingdom, rates increased by 200% from 2005 to 2013.6 In this article, cosmetic breast augmentation (or breast implants) refers to procedures that change the size, shape and texture of healthy breasts. This is distinct from reconstructive breast augmentation, such as following mastectomy.

Although most cosmetic breast surgery occurs among women of reproductive age, there has been little research into pregnancy outcomes, including breastfeeding. A systematic review of breastfeeding outcomes associated with cosmetic breast augmentation surgery identified only three small, observational studies.7 One study reported reduced rates of any breastfeeding among women with breast augmentation, while meta-analysis of all three studies suggested a reduced likelihood of exclusive breastfeeding (pooled rate ratio, 0.60; 95% CI, 0.40–0.90).7 The authors recommended that studies using larger cohorts and more representative study populations be used to explore the observed association.

To test the null hypothesis that augmentation has no effect on breast milk feeding, we conducted a population-based study to determine the effect of cosmetic breast augmentation: (i) on any breast milk feeding in a subsequent pregnancy; and (ii) on exclusive breast milk feeding among women who breast milk fed.

Methods

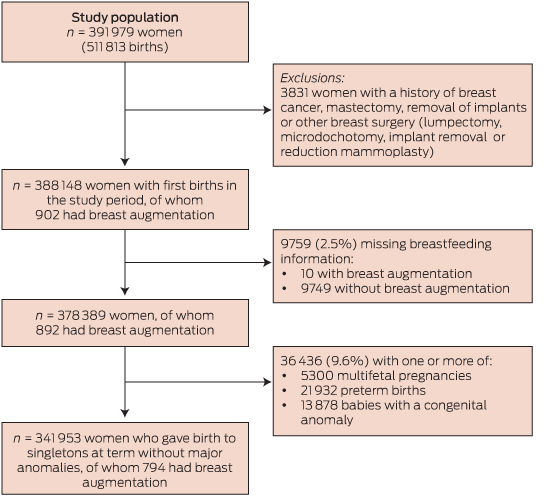
The study population was derived from the 391 979 women who gave birth in New South Wales from 1 January 2006 to 31 December 2011 (Box 1). As our intention was to examine the effect of cosmetic breast augmentation, women with breast cancer, mastectomy, breast reconstruction or other breast surgery before giving birth were excluded (n = 3831; Box 1 and Appendix 1). The remaining 388 148 women had 506 942 births. The first birth in the study period or the first birth after breast augmentation surgery was used in the primary analysis.

Data for the study were obtained from two linked population health datasets: the NSW Perinatal Data Collection (PDC; referred to as birth records) and the NSW Admitted Patient Data Collection (APDC; referred to as hospital records). The PDC is a statutory surveillance system of all births in NSW of at least 20 weeks’ gestation or at least 400 g birthweight. Information on maternal characteristics, pregnancy, labour, delivery, and infant outcomes are recorded by the attending midwife or doctor. The APDC is a census of all NSW inpatient hospital discharges from both public and private hospitals, and day procedure units, and includes demographic and episode-related data. Diagnoses and procedures are coded for each admission from the medical records according to the International Classification of Diseases, 10th revision, Australian modification (ICD-10-AM) and the Australian Classification of Health Interventions.8

Hospital records for individual women were linked cross-sectionally to birth records from 2006 to 2011 and longitudinally (from July 2000 to December 2011). Thus, the minimum lookback period for prior breast surgery ranged from 5.5 to 11.5 years. Record linkage was undertaken by the NSW Centre for Health Record Linkage (CHeReL). For this study, the CHeReL reported the quality of the record linkage9 as 3/1000 false-positive links. We were provided with anonymised data. Ethics approval for the study was obtained from the NSW Population and Health Services Research Ethics Committee.

Breastfeeding information at discharge has been collected in birth records since 2006. One or more of the following three options can be reported in tick-boxes: “breastfeeding”, “expressed breast milk” or “infant formula”.

The primary outcome was any breast milk feeding (any breast milk, with or without infant formula) at discharge from birth care. Consistent with other studies,7 the secondary outcome was exclusive breast milk feeding (only breast milk, either directly from the breast and/or as expressed breast milk) among those with any breast milk feeding.

The exposure of interest was cosmetic breast augmentation, which has a specific surgical procedure code (45528-00) in the Australian Classification of Health Interventions.4,8 This code is distinct from unilateral breast augmentation and breast augmentation following mastectomy. Hospital records from 2000 onwards were available for identification and date of surgery.

Other factors potentially predictive of breast milk feeding at discharge from maternity care that were available for analysis included: maternal age, country of birth, socioeconomic status according to the Australian Bureau of Statistics Index of Relative Socio-economic Disadvantage,10 marital status, urban or rural residence, private care, parity, multifetal pregnancy, antenatal care before 20 weeks’ gestation, smoking during pregnancy, morbid obesity, hypertensive disorders of pregnancy, diabetes (pregestational or gestational), labour analgesia, labour induction or augmentation, mode of birth, severe maternal morbidity,11 maternal postnatal length of stay, gestation, small for gestational age (< 10th birthweight for gestational age percentile), major congenital anomalies (eg, cleft lip or palate, spina bifida, tracheoesophageal fistula), neonatal intensive care unit admission, and perinatal mortality. These factors are known to be reliably reported.12

Statistical analysis

Descriptive statistics were used to summarise the distributions of maternal and pregnancy characteristics among all women with and without breast augmentation. Poisson regression modelling with robust standard errors13 was employed to determine the association of breast augmentation with (i) any breast milk feeding (compared with none) and (ii) exclusive breast milk feeding (compared with non-exclusive) among the “any breast milk feeding” group.

To avoid confounding by factors likely to be associated with reduced breastfeeding,14,15 regression analyses were limited to women who had a singleton infant with no major congenital anomalies and born at term (≥ 37 weeks). Crude and adjusted relative risks (RRs) with 95% confidence intervals were estimated for characteristics likely to be associated with breastfeeding.

Finally, among women with at least two births in the study period, we examined the primary and secondary breastfeeding outcomes across births in the following groups: no breast augmentation, breast augmentation between births, and breast augmentation before both births. The before-and-after effect of breast augmentation among women who had breast augmentation surgery between births was assessed using the McNemar test of paired data, with continuity correction.

Results

Of the 388 148 women who were eligible for the study, 902 had documentation of cosmetic breast augmentation surgery (Box 1). Breastfeeding information at discharge was missing in 9759 records (2.51%). Among the remaining 378 389 women, 892 (0.24%) had breast augmentation before a birth. The median age at the time of breast augmentation surgery was 28 years (range, 18–43 years), and the median interval between surgery and birth was 3.1 years (range, 1.0–10.1 years).

Maternal, pregnancy and birth characteristics for all women with and without breast augmentation are presented in Box 2. At discharge, 705 women (79.0%) with breast augmentation provided any breast milk to their infants, compared with 88.5% of women without breast augmentation.

Breast milk feeding outcomes were then assessed among 341 953 singleton infants with no major congenital anomalies born at term. Compared with women without, women with breast augmentation had reduced likelihood (adjusted RR, 0.90; 95% CI, 0.87–0.93) of feeding their infant with any breast milk at the time of discharge from birth care. Factors controlled for that were positively associated with breast milk feeding included: older maternal age, non-Australian-born, high socioeconomic status, nulliparity, non-smoker, no obstetric interventions, and longer hospitalisation after birth (Appendix 2). Women with breast augmentation in the 2 years preceding birth had similar rates of any breast milk feeding to women with a longer period since breast surgery (77% v 81%; P = 0.17).

For women whose infants received any breast milk, there was no association between breast augmentation and exclusive breast milk feeding. Among these, 593 women (94.0%) with breast augmentation exclusively breast milk fed. The adjusted RR for exclusive breast milk feeding among women with breast augmentation, compared to those without, was 0.99 (95% CI, 0.97–1.01).

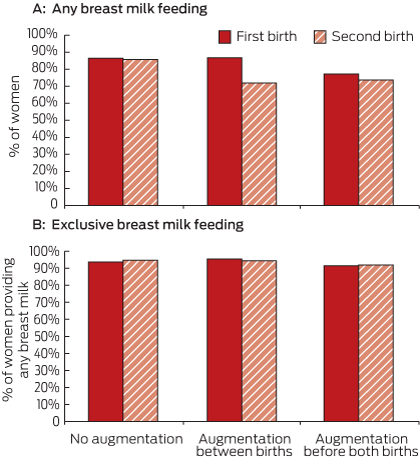
Among the 106 835 women with two births during the study period, 106 593 had no record of breast augmentation, 167 had breast augmentation before both births, and 75 had breast augmentation between the two births. The rates of any breast milk feeding and exclusive breast milk feeding at the first and second births were compared for these three groups of women (Box 3). The rate of any breast milk feeding was the same for both births among women with no augmentation (87%). Among women with breast augmentation between the births, the rate declined from 87% in the first birth to 72% in the second birth (P = 0.02). There was no evidence of significant change among women with augmentation before both births (77.2% v 73.7%; P = 0.29; Box 3, A). However, among women who provided any breast milk, the rate of exclusive breast milk feeding was similar in first and second births for women with and without breast augmentation (Box 3, B).

Discussion

This is the first study to document the population prevalence of cosmetic breast augmentation in a maternity population, and the largest to compare breast milk feeding outcomes for women with and without cosmetic breast augmentation. We found that women with breast augmentation are less likely to provide their infants with any breast milk at the time of discharge. However, among women who provide breast milk, women with breast augmentation are no more or less likely to exclusively breast milk feed their infants. Both the main population analysis and the subgroup analysis of women with breast augmentation between births showed lower rates of any breast milk feeding following augmentation surgery. This consistency of findings strengthens the case that there is an effect, although possible mechanisms are unclear.

Uptake of breast augmentation surgery is increasing, with 8000 Australian, 10 000 British and 307 000 American women undergoing the procedure in 2011.46 We found that 79% of these women can be expected to breast milk feed at discharge, compared with 89% of women without surgery. As maternity care affects breastfeeding success,2 these findings underscore the importance of identifying, supporting and encouraging all women who are vulnerable to a lower likelihood of breastfeeding.

Underlying breast hypoplasia and insufficient lactogenesis have been suggested as a reason for reduced breastfeeding rates among women with breast augmentation.16 However, we found that among women who had breast augmentation between births, any breast milk feeding fell from 87% in the “before augmentation” birth to 72% in the “after augmentation” birth, while the rates in comparison groups remained stable. A demonstrated ability to provide breast milk before augmentation surgery suggests that hypoplasia is not the explanation for lower breastfeeding rates among women with breast augmentation. Similar to the one existing population-based study,17 we found no association between breast augmentation and adverse birth outcomes, including preterm birth, small for gestational age, congenital anomalies, neonatal intensive care unit admission or perinatal death.

Lower breastfeeding rates may reflect maternal and family attitudes and expectations, may be a consequence of surgery, or the breast implants may reduce the ability to lactate. Although a variety of health outcomes have been investigated among women who have silicone breast implants, and their breast milk fed infants, epidemiological studies have not substantiated links with adverse outcomes.1821 Nevertheless, women with breast implants may fear transmitting silicone or other breast implant materials into breast milk. They may also fear, or have been told by their surgeon, that breastfeeding could undo a satisfactory augmentation result. Another explanation is that lactiferous ducts, glandular tissue or nerves of the breast are damaged during surgery, or by pressure from the implants on breast tissue.22 Furthermore, complications of the surgery including capsular contracture, haematoma formation, infection or pain may reduce the ability or desire to breastfeed.22 Future qualitative research is needed to better understand why women with prior breast augmentation are less likely to breastfeed.

Our findings of reduced rates of any breastfeeding are consistent with the only study that reported rates of any breastfeeding after augmentation among women who attempted breastfeeding.16 However, the latter study reported a stronger effect at 2 weeks postpartum (RR, 0.67; 95% CI, 0.50–0.91). In contrast, our findings differ from the systematic review of three small studies, which found women with breast implants who breast milk fed were less likely to exclusively breastfeed.7 We believe our whole-population findings are more robust. The previous studies had selected populations (eg, lactation referral clients) and variable end points (eg, exclusive breastfeeding, insufficient lactogenesis), used historical controls and made limited attempts to control for potential confounders.7 However, it is possible that differences in the rates of exclusive breastfeeding may become apparent after discharge, as follow-up in the three studies was longer (minimum 2 weeks postpartum).

A strength of our study is the use of recent, large, linked population health datasets that include a third of all births in Australia. Breastfeeding information is reported by a midwife, and previous validation studies show events occurring around birth or immediately postpartum are well reported.12 Longitudinal record linkage allowed the ascertainment of cosmetic breast augmentation surgery. Although a longer lookback period may have increased case ascertainment,23 some missed cases among a population of more than 300 000 women without breast augmentation are unlikely to change the findings. Similarly, women who have cosmetic surgery overseas or interstate are not captured in this study. Identification of breast augmentation surgery in routinely collected data has not been evaluated but, in general, surgical procedures are reliably identified in hospital discharge data, and other breast surgery, such as mastectomy, is accurately reported (sensitivity, 97%; positive predictive value, 97%).12,24

Another strength is that breastfeeding was assessed at the same time for both exposed and unexposed women, unlike prior studies.7 The 89% breastfeeding rate at discharge in our study is similar to the rate reported in the Australian National Infant Feeding Survey (90.2% for < 1 month).25

However, information on breastfeeding initiation was not available. If women with breast augmentation initiated breastfeeding but gave up before discharge, the rate of exclusive breastfeeding could be lower if these women were included in the “any breastfeeding” denominator. Another limitation of the study is that breastfeeding is only assessed at one time point (discharge). Breastfeeding rates decline steadily over the first months of infancy25 and it is unclear whether this decay would be the same for women with and without breast augmentation. Information was not available on intention to breast milk feed, paternal support for breastfeeding, nor on the details of the breast augmentation surgery, such as the incision type or the type and volume of the breast implant.

An absolute rate of one in five women with breast augmentation who subsequently give birth may be unable or unwilling to breast milk feed their infants. This information should be provided as part of informed decision making to women contemplating breast augmentation surgery.

1 Study population flowchart, 2006–2011

2 Maternal, pregnancy and birth characteristics for participants, by breast augmentation status


Breast augmentation (n = 892), no. (%)

No breast augmentation (n = 377 497), no. (%)

P*


Mother’s age at birth (missing = 106)


< 0.001

< 20 years

3 (0.3%)

15 406 (4.1%)


20 to < 35 years

608 (68.2%)

276 043 (73.2%)


≥ 35 years

281 (31.5%)

85 942 (22.8%)


Region of birth (missing = 1489)


< 0.001

Australia or New Zealand

761 (85.5%)

264 041 (70.2%)


Asia

45 (5.1%)

58 811 (15.6%)


Other

84 (9.4%)

53 158 (14.1%)


Married or de facto

718 (80.5%)

308 709 (81.8%)

0.32

Socioeconomic status (missing = 6140)


< 0.001

Most disadvantaged

103 (11.6%)

79 232 (21.3%)


Disadvantaged

134 (15.1%)

71 517 (19.3%)


Average

159 (17.9%)

75 027 (20.2%)


Advantaged

210 (23.7%)

71 656 (19.3%)


Most advantaged

282 (31.8%)

73 929 (19.9%)


Urban residence at birth

653 (73.2%)

263 218 (69.7%)

0.02

Private care

370 (41.5%)

120 211 (31.8%)

< 0.001

Nulliparous

378 (42.4%)

206 078 (54.6%)

< 0.001

Multifetal pregnancy

18 (2.0%)

5282 (1.4%)

0.12

First antenatal visit < 20 weeks’ gestation

834 (93.5%)

344 892 (91.4%)

0.02

Smoking during pregnancy

85 (9.5%)

45 073 (11.9%)

0.03

Hypertensive disorders

70 (7.9%)

38 568 (10.2%)

0.02

Diabetes

32 (3.6%)

26 621 (7.1%)

< 0.001

Morbid obesity

0

1277 (0.3%)

0.08

Regional labour analgesia

284 (31.8%)

101 925 (27.0%)

0.001

Labour induction

256 (28.7%)

103 368 (27.4%)

0.38

Mode of birth (missing = 287)


0.62

Unassisted vaginal

485 (54.4%)

210 506 (55.8%)


Instrumental vaginal

130 (14.6%)

51 447 (13.6%)


Caesarean section

276 (31.0%)

115 258 (30.6%)


Severe maternal morbidity

12 (1.4%)

6102 (1.6%)

0.52

Mother’s postnatal length of hospital stay


0.78

1–2 days

327 (37.2%)

132 944 (35.7%)


3–4 days

359 (40.8%)

157 913 (42.4%)


5–6 days

168 (19.1%)

70 634 (19.0%)


≥ 7 days

25 (2.8%)

10 869 (2.9%)


Preterm birth (< 37 weeks’ gestation)

61 (6.8%)

21 871 (5.8%)

0.18

Small for gestational age

75 (8.4%)

35 722 (9.5%)

0.28

Neonatal intensive care unit admission

119 (13.3%)

53 510 (14.2%)

0.48

Major congenital anomalies

36 (4.0%)

13 842 (3.6%)

0.50

Perinatal mortality

0

8

0.89

Infant feeding at discharge


Any breast milk feeding

705 (79.0%)

334 250 (88.5%)

< 0.001

No breast milk feeding (formula only)

187 (21.0%)

43 247 (11.5%)


Exclusive breast milk feeding among women who provided any breast milk

653 (92.6%)

308 552 (92.3%)

0.76

Breast-related readmission within 6 weeks

13 (1.4%)

4471 (1.2%)

0.42


χ2 test.

3 Breast milk feeding outcomes for women with two births, showing the before-and-after effect of breast augmentation, 2006–2011

Your AMA Federal Council at work – 7 April 2015

What AMA Federal Councillors and other AMA members have been doing to advance your interests in the past month:

Name

Position on Council

Activity/Meeting

Date

A/Prof Brian Owler

AMA President

Meeting with Australian Health Practitioner Regulation Agency (AHPRA) and the Medical Board of Australia

5/3/2015

Meeting with Royal Australasian College of Surgeons and Australian Plastic Surgery Association Presidents

4/3/2015

Dr Brian Morton

AMA Chair of General Practice

GP Roundtable

17/3/2015

Dr Stephen Parnis

AMA Vice President

Meeting with Australian Health Practitioner Regulation Agency (AHPRA) and the Medical Board of Australia (MBA) on improving practitioner experience with notifications

5/3/2015

Dr Andrew Miller

AMA Federal Council Representative for Dermatologists

MSAC (Medical Services Advisory Committee) Review Working Group for Skin Services

20/2/2015


Dr Antonio Di Dio

AMA Member

Meeting with Australian Health Practitioner Regulation Agency (AHPRA) and the Medical Board of Australia (MBA) on improving practitioner experience with notifications

5/3/2015

Dr Roderick McRae

AMA Federal Councillor – Salaried Doctors

Meeting with Australian Health Practitioner Regulation Agency (AHPRA) and the Medical Board of Australia (MBA) on improving practitioner experience with notifications

5/3/2015

Dr Susan Neuhaus

AMA Federal Councillor – Surgeons

Meeting with Australian Health Practitioner Regulation Agency (AHPRA) and the Medical Board of Australia (MBA) on improving practitioner experience with notifications

5/3/2015

Dr Robyn Langham

AMA Federal Councillor – Victoria nominee and Chair of AMA Medical Practice Committee

Australian Health Practitioner Regulation Agency’s (AHPRA) Prescribing Working Group (PWG)

5/3/2015

Dr David Rivett

AMA Federal Councillor

IHPA Small Rural Hospitals Working Group

5/2/2015

Dr Chris Moy

AMA Federal Councillor

PCEHR Safe Use Guides consultation (KPMG/ACSQHC)

11/3/2015

NeHTA (National E-Health Transition Authority) Clinical Usability Program (CUP) Steering Group

19/2/2015

Dr Richard Kidd

AMA Federal Councillor

PCEHR Safe Use Guides consultation (KPMG/ACSQHC)

10/3/2015


Gateway Advisory Group

9/2/2015


The cost of freezing general practice

Australia’s universal health insurance scheme, Medicare, began as Medibank in 1975 and aimed to provide “universal coverage of the population, equitable distribution of costs, [and] administrative simplicity”.1 Funded by the Australian Government, Medicare reimburses general practitioner services on a fee-for-service basis. General practice is the most widely used health service; 85% of the population see a GP in any given year.2

Currently, patients using GP services are either bulk billed or privately billed. Bulk-billed patients have no out-of-pocket expenses, and the GP receives a rebate directly from Medicare. Privately billed patients pay for their services at the fee set by the GP and claim the eligible rebate from Medicare.

In 1978, the rebate was decreased from 85% of the Medicare schedule fee to 75%, and bulk-billing was restricted to pensioners and socially disadvantaged people. Since then, federal governments have encouraged bulk-billing. In 1984, the rebate returned to 85% and bulk-billing was reintroduced for all patients. In 2004, incentives were introduced for GPs to bulk bill concessional patients (ie, children < 16 years of age or Commonwealth concession card holders).3 In 2005, the rebates were increased to 100%.4 These measures made it financially viable for many GPs to bulk bill all patients, and bulk-billing increased from 66.5% of all Medicare-claimed GP services in December 2003 to 84.0% in September 2014.5

The 2014–15 federal Budget proposed the introduction of a $7 patient copayment for GP, pathology and imaging services; and an increase in the copayment for subsidised prescribed medications. The financial impact of these proposals was shown to be highest among patients with a Commonwealth concession card.6

Facing strong opposition, the government withdrew the policy in December 2014, and replaced it with three new policies. The first, a 10-minute minimum time for standard GP consultations, was retracted in January 2015. The second, a $5 reduction in the Medicare rebate for “common GP consultations” for non-concessional patients to commence 1 July 2015, was retracted in March 2015. The government had suggested GPs could charge a $5 copayment to non-concessional patients to cover the rebate reduction. While referred to as a copayment, it was technically a gap payment where GPs privately charged their patients and the patients claimed the lowered Medicare rebate.

The third policy was a continuation of the indexation freeze for all Medicare schedule fees until July 20187 (henceforth referred to as the freeze). The $5 copayment would not have covered income lost through the freeze. Using publicly available data, Duckett calculated the combined effect of the second and third policies, estimating they would reduce GPs’ rebate income by 10.6% by 2017–18 (assuming a consumer price index [CPI] of 2.5%). To cover all the costs generated by these two policies, Duckett hypothesised that GPs may move to charge non-concessional patients a copayment similar to the gap payment currently charged privately by some GPs ($30–$40),8 well above the 10.6% reduction.

The study we report here was conducted in February 2015, before the retraction of the $5 rebate reduction. Using data that measured GP clinical activity, we aimed to assess the effect of the indexation freeze and the (now retracted) $5 rebate reduction on a GP’s Medicare income for an average 100 eligible consultations; and, assuming all concessional patients are bulk billed, we aimed to estimate for all consultations with non-concessional patients the patient copayment required for GPs to recoup the lost Medicare rebate income.

Methods

Bettering the Evaluation and Care of Health (BEACH)

We analysed data from the BEACH program, from April 2013 to March 2014, inclusive. BEACH is a continuous cross-sectional, national study of the content of GP–patient encounters in Australia. Every year, about 1000 ever-changing randomly selected GPs each record details of 100 consecutive encounters with consenting patients, on structured paper forms. BEACH methods are described in detail elsewhere.2

The age–sex distribution of patients at Medicare-claimable encounters in the BEACH program is representative of that of patients at all GP services claimed through Medicare.2

Ethics approval for the BEACH program was obtained from the University of Sydney Human Research Ethics Committee.

Information recorded for each encounter includes: patient age, and whether he or she holds a Commonwealth concession card or a Department of Veterans’ Affairs (DVA) repatriation health card; whether it was a direct consultation (patient was physically seen by the GP); and whether the consultation was intended to be claimable by the GP or patient through Medicare or the DVA (for up to three items) or through another source.

Using BEACH data to assess the effect of proposed policies on GP income

We limited our analysis to direct encounters for which at least one Medicare Benefits Schedule (MBS) or DVA general practice consultation item was claimable. These account for about 94% of all recorded encounters, with the other encounters being indirect (eg, by phone), having no charge or being paid through other sources.2 Only consultations for which patient age was recorded were included, so patients aged less than 16 years could be identified.

General practice consultation items included were: all surgery consultations, residential aged care facility (RACF) visits, home and other institution visits, GP mental health care, chronic disease management items, health assessments and case conferences. These were selected and allocated to one of two groups: those with concessional patients (defined as people aged less than 16 years, those holding a Commonwealth concession card and those holding a repatriation health card); and those with non-concessional patients (all other patients).

To estimate the total income claimable from Medicare and DVA items for 100 consultations in the 2014–15 financial year, if all had been bulk billed, we identified the mean rates at which doctors claimed for each item over 100 consultations for concessional patients and non-concessional patients; we then multiplied these rates by the rebatable amount for each item number in the MBS.9 These values were summed to provide the total rebate income.

We assumed the bulk-billing GP in our model claimed the bulk-billing incentive item for all concessional patients. We modelled a GP who claimed the urban item (10990) and a GP who claimed the rural item (10991). Based on unpublished BEACH data, when calculating the rebate for visits to RACFs we assumed GPs saw three patients on average, while for visits to other institutions (primarily home visits) we assumed GPs saw one patient. Finally, we assumed that GPs would continue billing a similar distribution of items across the years.

We estimated the expected income for GPs over the 3 years 2015–16 to 2017–18 by repeating the above calculation for 2014–15 using the reduced rebate for consultation items for non-concessional patients. The items for which the $5 reduction applied to non-concessional patients were: all surgery consultations, home and other institution visits and after-hours care. Due to the freeze, our estimate remains constant for all financial years from 2015–16 to 2017–18.

To calculate the loss due to the $5 reduction in Medicare rebates, we subtracted the 2014–15 estimate from the 2015–16 estimate.

To measure the effect of the freeze, we calculated the amount GPs would need to earn to maintain an equivalent income rebate level from Medicare and DVA rebates to that of 2014–15 by multiplying the amount the average bulk-billing GP earned per 100 consultations in 2014–15 by 2.5% (the average CPI increase for the previous 5 years,10 and the mid-point of the Reserve Bank’s target CPI increase of 2%–3% per year11). The result was multiplied again by the same CPI to get the 2016–17 estimates and again for the 2017–18 estimates. The 2017–18 result was then subtracted from the 2014–15 result, to provide an estimated financial loss due to the freeze.

The size of a copayment required from non-concessional patients to cover this lost income was calculated by dividing the resulting difference in earnings from the policies by the number of non-concessional patients per 100 consultations.

Results

Between April 2013 and March 2014, there were 95 897 patient encounters recorded in the BEACH study, 83 510 being direct consultations for which patient age and one or more Medicare or DVA items were recorded. At least one GP consultation item number was recorded at 82 211 (98.4%) of these consultations, including 44 723 (54.4%; 95% CI, 53.0%–55.8%) with concessional patients and 37 448 (45.6%; 95% CI, 44.2%–47.0%) with non-concessional patients.

$5 rebate reduction

In the 2014–15 financial year, for an average 100 claimable consultations, a bulk-billing-only GP would receive rebates of $2925.59 for consultations with concessional patients and $2072.69 for those with non-concessional patients, a total of $4998.28. Applying the $5 rebate reduction, the same GP would receive total rebates of $4778.75 in the 2015–16 financial year, a decrease of $219.53 per 100 average consultations due to the $5 reduction for non-concessional patients for most GP items (income from concessional patients staying constant). This equated to a 4.3% decrease in rebate income in 2015–16 and to a 4.0%–4.1% decrease in 2017–18 (Box 1). Averaged across all consultations with non-concessional patients, this equates to a decrease of $4.81 per consultation (Box 2).

The freeze

Assuming a CPI increase of 2.5% by 2015–16, rebate income would need to increase by $124.96 per 100 eligible consultations to match this CPI (2.5% of total 2014–15 rebates). This relative loss of $124.96 equates to 2.4% of relative rebate income and $2.74 per consultation with non-concessional patients.

From 2014–15 to 2017–18, the estimated CPI increase would be 7.7%. By then, rebate income would need to increase by $384.32 per 100 eligible consultations to match this increase. This means the freeze alone would cost GPs 7.1% (range, 5.8%–8.5%) of their relative rebate income (Box 1), equivalent to $8.43 (range, $6.71–$10.17) per non-concessional patient consultation (Box 2).

As the rural incentive is higher than the urban, GPs claiming the rural bulk-billing incentive item would face a greater relative loss in rebate income due to inflation: 10 cents more per non-concessional patient in 2015–16 ($2.84) and 29 cents more in 2017–18 ($8.72).

The policies combined

Combining the effect of both policies (and assuming an urban setting for the bulk-billing incentive), the total estimated loss in rebate income to GPs per 100 average consultations would be $603.85 in 2017–18 — a reduction of 11.2% (range, 9.9%–12.5%) (Box 1). Assuming concessional patients are bulk billed, if GPs charged a copayment for all non-concessional patient consultations to make up the shortfall in total rebate income, it would need to be $7–$8 in 2015–16, and increase to $12–$15 by 2017–18 (Box 2).

Discussion

If both the policies recently proposed by the Australian Government had come into effect as originally proposed, GPs would have had to charge non-concessional patients substantially more than the suggested $5 copayment to maintain their 2014–15 relative gross income. GPs would have needed to charge a copayment of $7–$8 for non-concessional consultations in 2015–16 and a copayment of $12–$15 by 2017–18 to maintain a gross income equivalent to that of 2014–15. They would have lost the equivalent of 11.2% of their rebate income from the combined effect of both policies by 2017–18. This is similar to, but more precise than, the 10.6% found by Duckett, who relied on published data.8

The now retracted rebate cut to selected items for non-concessional patients would have had a considerable immediate impact on GP income, averaging $4.81 per consultation with non-concessional patients. However, the freeze showed a larger impact over time, increasing from a loss of $2.74 per consultation with non-concessional patients in 2015–16 to $8.43 in 2017–18, nearly twice the amount of the rebate cut.

The 7.1% reduction in GP rebate income by 2017–18 due to the freeze may force GPs who currently bulk bill to cover their loss by charging non-concessional patients a copayment. The freeze is therefore likely to have a greater impact on practices that serve socioeconomically disadvantaged populations. GPs practising in these circumstances would have to absorb the reduction in gross income, and this may not be viable.

Our estimates are conservative. We have not included in our model financial loss to GPs from:

  • the freeze on other Medicare items (such as procedures, practice incentive items);
  • administrative costs involved in implementing new billing systems;
  • increased bad debts;
  • previous indexation of schedule fees below CPI (notably since 201212); and
  • lost income when a GP chooses to bulk bill any non-concessional patients facing financial hardship.

It is therefore probable that GPs will charge more than our estimates. Once GPs stop bulk billing non-concessional patients, they may take the opportunity to charge more than what is required merely to recoup their losses. Further, there is no guarantee that copayments will only be charged to non-concessional patients.

We modelled our study on GPs who bulk billed all patients but changed to privately billing non-concessional patients after the policies were implemented. GPs who currently bulk bill concessional patients and privately bill non-concessional patients would still lose income from the schedule fee freeze for consultations with concessional patients. Using the assumptions of this study, the GP would have to charge this loss of income to non-concessional patients over and above whatever they are already charging.

Our study has some limitations. By using the average distribution of Medicare item numbers from all BEACH GPs, we assumed that GPs who bulk bill all patients had a similar distribution of Medicare items to GPs who privately bill some or all of their patients. A recent article has suggested this is a reasonable assumption.13 We also assumed that GPs will continue billing a similar distribution of items in the future.

If both policies had gone ahead, GPs would have needed to charge significantly more than the suggested $5 copayment for all consultations with non-concessional patients in order to maintain their 2014–15 relative gross income. Public discussion has mainly focused on the now retracted $5 reduction, and the freeze has received far less attention. Yet, with time, it will have a greater impact: $8.43 per non-concessional patient consultation by 2017–18, nearly double the amount of the rebate reduction.

Our estimates are conservative and there is no way we can predict the amount GPs will charge once they are forced, for economic reasons, to introduce a copayment. The freeze will result in Medicare savings; however, patient out-of-pocket expenses will be higher than these savings because GPs will need to charge more than their lost income to recoup the additional implementation and operational costs we have discussed. The results of our study inform public debate by providing an objective measure of the minimum likely effect of the continuation of the freeze on Medicare schedule fees on general practice.

1 Decrease in relative rebate income with either or both of the rebate reduction and indexation freeze policies in place, compared with 2014–15


CPI = consumer price index.

2 Copayment required for non-concessional patient consultations to maintain relative 2014–15 income with either or both of the rebate reduction and indexation freeze policies in place


CPI = consumer price index.

Implementing telehealth as core business in health services

The many benefits for the rural sector suggest it is time to integrate telehealth models into routine clinical practice

The uptake of telehealth in Australia has been increasing steadily, but continued uptake relies on clinical champions. Australian telehealth models cover a wide range of medical specialties and subspecialties.1 However, most telehealth services in Australia are currently optional, which acts as a barrier to the growth and uptake of these models.

Many successful telehealth networks have been established by incorporating telehealth models of care as part of the core business of hospitals and health services, rather than as an academic activity or a pilot project. While some may argue the evidence base for telemedicine is “weak”,2 we assert there is sufficient evidence for these models to be integrated into routine clinical practice.

Successful telehealth models

Telehealth models focus on a range of specialties and use telehealth for different purposes.1 For example, a telehealth model in South Australia focuses on providing mental health services from tertiary hospitals in Adelaide to patients in country hospitals and health centres. The burns unit at the Princess Margaret Hospital in Western Australia uses videoconferencing and “store and forward” digital photography to provide an integrated multidisciplinary assessment and review service for rural and remote burns patients. The Centre for Online Health at the University of Queensland coordinates the telepaediatric service between Brisbane and rural and remote towns in Queensland, to provide paediatric subspecialty care closer to home for patients.1 The Townsville Teleoncology Network in northern Queensland provides patients in rural and remote locations with access to medical and radiation oncologists, negating the need for long-distance travel.3

Established international telehealth models include the Veteran Affairs Telehealth Services (http://www.telehealth.va.gov) and the University of Kansas Center for Telemedicine and Telehealth (http://www.kumc.edu/community-engagement/ku-center-for-telemedicine-and-telehealth.html) in the United States, and TEMPiS (http://www.tempis.de), Germany’s telestroke network.4

Benefits of telehealth for the rural sector

Evaluation studies on the cost-effectiveness of telehealth models have produced varying results. A systematic review of the economic benefits of telehealth did not find evidence of net savings.5 This review included studies of rural centres at variable distances from the tertiary centres, a range of subspecialties and various study methods. However, in two Australian studies where telehealth negated the need for patients to travel long distances to access specialist care, there were cost savings to the health system.6,7 Therefore, pooling the results of studies from centres serving short travel distances may not show the true cost savings of telehealth models that are intended for improving specialist access for patients in rural and remote areas.

Patients welcome telehealth models mainly due to the convenience of receiving their care closer to home. Clinicians find these models are important for connecting with larger centres, professional development through case-based discussions, and the continuity of care they provide.8 Another benefit is that they enable clinicians to provide consultations to rural patients in a timely manner.3

Safety considerations

Just as face-to-face models of care have potential problems, telehealth models are not without risk. However, if appropriate risk mitigation strategies are in place, safety concerns will be minimal. For example, rates of complications of thrombolysis and post-stroke outcomes at remote sites in the TEMPiS network were similar to urban figures.4

Selection of patients suitable for telehealth requires sound clinical judgement. As such, these decisions may not be determined by protocols or guidelines alone.

Improvement in rural service capability

To provide care closer to home for patients, rural centres, as well as the regional or city hospital, need adequate resources to meet the requirements of the service capability frameworks set out by various jurisdictions and accreditation bodies. Current telehealth research tends to ignore or underestimate other benefits in terms of rural capacity building, support for the rural-based health professionals and the benefits to continuity of care for the patient. We believe that building capacity of the rural system is essential to close the gap in clinical and survival outcomes between rural and urban patients.9

Where clinicians are expected to employ telehealth models, heath administrators and managers must ensure that the resources are adequate and the governance structures are in place to enable sustainable implementation and delivery. We assert there is sufficient evidence to support the role of telehealth in mainstream service delivery, and it is now time to implement these models as core business. Key performance indicators for managers and clinicians, keeping telehealth as a standing agenda item in management meetings, and attending to the resource requirements for implementation can be useful enablers to achieve this outcome.

Should we continue to isolate patients with vancomycin-resistant enterococci in hospitals?

The routine use of contact precautions for patients with vancomycin-resistant enterococci cannot be justified once colonisation with this multidrug-resistant bacterium becomes endemic

Infections with vancomycin-resistant enterococci (VRE), which have become more common in Australian hospitals since the late 1990s, are associated with poor patient outcomes. Patients with gastrointestinal colonisation of VRE are at greater risk of infection, and patients infected with VRE are at higher risk of all-cause mortality.1

During outbreaks, VRE is assumed to spread between patients mainly via the hands of health care workers or in the hospital environment. Widely recommended strategies for minimising the risk of VRE transmission include screening to identify colonised patients, and subsequent contact precautions to minimise cross-transmission. Many hospitals use contact precautions for patients colonised or infected with VRE on current and each subsequent hospital admission, assuming VRE colonisation is lifelong. These recommendations for contact precautions are based on observational studies conducted primarily during outbreaks, inductive reasoning based on the known transmission potential, and expert opinion. However, dissent has been expressed against the routine use of contact precautions, particularly in hospitals where VRE is endemic.2

VRE is endemic in many Australian hospitals.3 We have recently changed our policy requiring the routine use of contact precautions for patients found to be colonised with VRE, to a risk-based policy applied to all patients at Alfred Health. By outlining the rationale for this change, we hope that it will inform VRE control policies at other Australian hospitals.

By comparing routine passive surveillance with a point prevalence survey, we found that a strategy of screening of close contacts of patients with VRE did not identify the majority of VRE carriers in hospital.4 This may be due to exposure to antibiotics having a major role in VRE acquisition in the endemic hospital setting. Consistent with other studies, we have recently shown that antibiotic exposure, particularly to meropenem, is an important risk factor for VRE colonisation among patients.4 Although the magnitude of the effect of re-exposure to antibiotics on detectability and transmissibility of VRE has not been definitively established, we note that no patients who had colonisation detected more than 4 years prior were found to have VRE, despite 40% being exposed to antibiotics within the previous 3 months.5

In an earlier study where VRE transmission through contacts was documented, exposure to broad-spectrum antibiotics was an important risk factor among incident cases.6 Therefore, these studies suggest that during cross-transmission of VRE in hospital, antibiotics are the major facilitator and predictor of new VRE acquisition. Similarly, a recent study based on phylogenetic analysis and mapping of the vanB gene suggested that about half of hospital-acquired vancomycin-resistant Enterococcus faecium had recently acquired a transposon coding for vancomycin resistance.7 This sequence was the same as a Tn1549 sequence present in anaerobic bacteria, but was inserted in different sites in the E. faecium genome, suggesting that a substantial proportion of new VRE may have emerged through de-novo generation due to antibiotic selection pressure rather than cross-transmission.7

Studies also suggest that most patients clear detectable levels of VRE carriage in a relatively short period.5,8 Hospitals have varying policies by which patients are defined as cleared, based on screening of rectal swabs or faecal culture. Although a negative culture may not necessarily prove clearance, as intermittent shedding has been described, it is likely that a VRE-negative culture from a faecal specimen indicates either complete clearance or at least a very low density of VRE, which may have only marginal clinical significance. Recently, we studied the long-term carriage of VRE in a retrospective cohort study, and observed that only 12.6% of patients were positive for VRE if the initial detection was between 1 and 4 years before follow-up sampling, and none were positive if the initial detection was more than 4 years before follow-up.5 In addition, molecular typing suggested that at least half of the patients who remained VRE-positive at the time of the study were recolonised with new strains.5

Although contact precautions have been shown to minimise the risk of cross-transmission of VRE during outbreaks, there is accumulating evidence that they adversely affect the care of patients and impair patient flow. Studies, mostly conducted in hospitals in the United States, have found contact precautions are associated with adverse impacts on psychological outcomes, poorer satisfaction with care and perception of quality of care, less timely patient management, and fewer visits by health care workers.9 In studies conducted at our hospital, we have also found increased rates of non-pressure-related injuries and medication errors, and delayed access to radiological investigations among patients colonised with VRE.10,11 While these impacts may be justified and mitigated where there are few colonised patients or in an acute outbreak setting, they are less justified in an ongoing endemic setting. This is particularly true for VRE, where subsequent clinically significant bloodstream infection is uncommon among colonised patients.12

What are the alternatives to contact precautions? Recent studies have shown that interventions that are universally applied (termed “horizontal” interventions) are more effective than those that are targeted to specific pathogens (“vertical” interventions, including contact isolation of patients colonised with VRE) in controlling multidrug-resistant organisms.13 In a systematic review, we found that the universal daily topical application of 2% chlorhexidine gluconate using impregnated washcloths was associated with a reduction in new VRE colonisation, and also reduced methicillin-resistant Staphylococcus aureus colonisation and central line-associated bloodstream infections.14 Thus, the use of chlorhexidine washcloths provides an example of a universal intervention not directed towards a specific pathogen, but rather having an impact on a wider range of important multidrug-resistant organisms.

Similarly, effective antimicrobial stewardship programs should be another area of focus, as antibiotic selection pressure appears to be a significant factor associated with both emergence and spread of VRE in hospitals. In addition, elements of standard care such as adherence to hand hygiene, cleaning and disinfection after room separation and during room occupancy, hospital design elements including provision of sufficient toilets and bathrooms, and cleanable furnishings should be improved to reduce the risk of potential transmission of any multidrug-resistant organism in hospital. Furthermore, continued surveillance and review of hospital infection rates in high-risk areas are required to monitor for changes in epidemiology.

In conclusion, emerging evidence suggests that a significant proportion of VRE colonisation is attributable to exposure to broad-spectrum antibiotics; however, the clearance of carriage appears to be the rule, rather than the exception. Both these factors imply that only broad-based, continuous surveillance can identify patients with VRE.

If patients with VRE cannot easily be identified with faecal screening, then universal interventions, such as daily topical application of 2% chlorhexidine gluconate using washcloths, are likely to be more effective in preventing transmission in high-risk settings, such as intensive care units. Although the evidence supporting its use outside of intensive care units is weaker, we have found it to be feasible to provide washcloths to patients to self-apply after routine bathing in other high-risk settings such as haematology–oncology units.15 However, supervision and adherence may be a problem outside intensive care settings. Topical application of chlorhexidine gluconate using washcloths is also likely to reduce other significant infections, such as central line-associated bloodstream infections. A focus on horizontal rather than vertical interventions also avoids the adverse consequences associated with contact precautions. Limited facilities for isolating patients might then be better allocated to other hospital threats, such as norovirus or other multidrug-resistant pathogens.

HIV testing rates and co-infection among patients with tuberculosis in south-eastern Sydney, 2008–2013

The association between HIV infection and tuberculosis (TB) is well recognised, and the rationale for offering a routine HIV test to all people with TB has been presented previously.1 Recent clinical trials found that commencing antiretroviral therapy for HIV infection before the completion of TB therapy is associated with improved survival, and treatment should be commenced simultaneously for HIV and TB in people with co-infection and a CD4 T-cell count less than 50 cells/mm3.2,3 These recent clinical end point data reinforce the patient benefit of being tested for HIV infection when diagnosed with TB.

In Australia, HIV testing was undertaken in 76%–81% of patients with TB between 2008 and 2010.4,5 In 2010, 3.4% of patients with TB with a known HIV test outcome were reported as testing positive for HIV.5

South Eastern Sydney Local Health District (SESLHD) is a NSW Health district with a population of more than 800 000 people, and is an area of relatively high HIV prevalence and incidence in Australia.6 The district has four publicly funded chest clinics for the management of TB. At 53%, the rate of HIV testing among patients with TB managed in SESLHD in 2008 was statistically significantly lower than the national rate in 2008.

We evaluated changes in the HIV testing practices across the health district after a simple intervention and examined the rate of HIV co-infection in this population.

Methods

Clinicians managing publicly funded chest clinics had regular clinical meetings between 2008 and 2012. These meetings involved discussion of diagnosis and management of TB, and included senior respiratory physicians, senior nursing staff, a microbiologist and an infectious diseases physician. Publications about HIV and TB co-infection were made available to the clinicians managing TB in the health district from 2008, and HIV testing data were fed back and discussed at clinician meetings.13,7,8 Cases of TB in SESLHD residents and others treated at SESLHD clinics were notified to the SESLHD Public Health Unit; these included microbiologically confirmed cases and cases that were treated for TB without microbiological confirmation. Data about patients’ HIV testing status were collected routinely by chest clinic staff.

TB notification data for 2008–2013 were extracted from the NSW Notifiable Conditions Information Management System, accessed through the Secure Analytics for Population Health Research and Intelligence.

Variables extracted for analysis were date of notification for TB, name of treating chest clinic, local health district of residence, HIV test offered and HIV test result, including CD4 T-cell count for new diagnoses. For the analysis, HIV status was categorised as known (tested for HIV antibody and found to be positive, including known before the diagnosis of TB, or negative), or unknown (not tested or declined an offer of testing).

The χ2 test was used to test for differences in the proportions of HIV testing and co-infection between clinics and over the study period. Statistical analyses were conducted using SPSS, version 22 (IBM Corporation) and SAS Enterprise Guide 6.1 (SAS Institute).

Ethics approval was not sought, as the data were aggregated and de-identified in a form suitable for feedback to clinical services as part of quality activities.

Results

During the 6-year study period, 539 cases of TB were notified, and 506 of these were managed in SESLHD chest clinics (Box). Thirty-three SESLHD residents were managed at other chest clinics and were excluded from this analysis. Of the 506 patients treated at SESLHD chest clinics, 107 were not residents of SESLHD.

The proportion of patients tested for HIV co-infection varied between clinics from 62% to 85% (χ2 = 25.5; df = 3; P < 0.001), and the proportion of people with known HIV status increased over time from 53% in 2008 to 87% in 2013 (χ2 = 27.1; df = 5; P < 0.001).

Of patients for whom HIV status was known, the proportion of cases with HIV co-infection varied between clinics, ranging from 1.5% to 9.7% (χ2 = 10.0; df = 3; P = 0.02). Only seven people offered an HIV test declined this intervention in the 6-year period. The overall rate of HIV co-infection among people managed for TB in SESLHD was 5.4% of those in whom the HIV status was established. Based on these data, the lowest possible rate of co-infection is 4.0% if it is assumed that the 27.1% not tested were not infected.

Eleven of the 20 patients who were HIV positive were diagnosed with HIV infection at or after the time of their TB diagnosis. The median CD4 T-cell count at the time of HIV diagnosis for these people was 30 cells/mm3 (range, 10–250 cells/mm3).

Discussion

Between 2008 and 2013, there was an increase in the proportion of patients treated for TB for whom HIV status was known. Of these patients, 20 were HIV positive (5.4%), and 11 of these were diagnosed with HIV at the time of, or after, their TB diagnosis.

Although Australia has a low prevalence of both HIV and TB, the two conditions coexist worldwide, and the early diagnosis and treatment of both conditions is of benefit to the individual and the population as a whole. Recent data have confirmed the reduction of HIV transmission risk to sexual partners of people with HIV when antiretroviral therapy is used.9

The proportion of people diagnosed with advanced HIV infection (CD4 T-cell count less than 200 cells/mm3) has not declined over time in Australia, and HIV testing at the time of TB diagnosis may enable earlier HIV diagnosis in a population who may not be perceived to be at risk for HIV infection otherwise.10 It is notable, however, that most of the newly diagnosed cases of HIV infection in SESLHD had severe immunodeficiency at the time of diagnosis. Treatment at this level of immunodeficiency is still associated with a survival benefit, and the potential to trace contacts of sexual partners and reduce further HIV transmission.

The increase in known HIV status over the study period may be associated with the clinician-led intervention described here or to other secular trends. Clinicians may have independently determined that HIV testing was of benefit to their patients, or they may have been responding to the 2009 NSW Health policy directive recommending assessment of HIV antibody status at the time of TB diagnosis.11 Due to the retrospective nature of our study, causes for this increase could not be ascertained.

The proportion of TB cases with HIV co-infection in SESLHD is numerically, but not statistically significantly, higher than that reported in national data. The identified co-infection rates among people treated for TB in SESLHD reinforces the recommendation that the routine offer of HIV testing to all patients with TB is cost-effective, and may increase early detection and reduce the consequences of untreated HIV infection in this population.1 It is possible, however, that referral bias may have influenced the co-infection rate in this population.

There is an ongoing need to aim for universal testing for HIV infection early after the diagnosis of TB in SESLHD and nationally.

Cases of tuberculosis managed in South Eastern Sydney Local Health District, 2008–2013, by patient HIV status and clinic or year of notification


TB cases managed

HIV status known

HIV positive (of known HIV status)

HIV not tested

HIV test offered but declined


Clinic


A

143

113 (79.0%)

11 (9.7%)

27 (18.9%)

3


B

213

131 (61.5%)

2 (1.5%)

79 (37.1%)

3


C

89

76 (85.4%)

6 (7.9%)

12 (13.5%)

1


D

61

49 (80.3%)

1 (2.0%)

12 (19.7%)

0


Year


2008

85

45 (52.9%)

4 (8.9%)

39 (45.9%)

1


2009

80

56 (70.0%)

3 (5.4%)

20 (25.0%)

4


2010

100

79 (79.0%)

5 (6.3%)

21 (21.0%)

0


2011

98

72 (73.5%)

4 (5.6%)

24 (24.5%)

2


2012

73

56 (76.7%)

1 (1.8%)

17(23.3%)

0


2013

70

61 (87.1%)

3 (4.9%)

9 (12.9%)

0


Total

506

369 (72.9%)

20 (5.4%)

130 (25.7%)

7 (1.4%)


Telling the story of mental health

It is unusual for Foreign Affairs, a magazine published by the United States Council on Foreign Relations in New York, to contain articles on health, but the first issue of 2015 carries an essay (Darkness invisible: the hidden global costs of mental illness) by three distinguished scientists from the National Institute of Mental Health about the hidden costs of mental health.1 Based on evidence from a 2010 Harvard University study on the current and future burden of disease,2 they state that “the direct economic effects of mental illness (such as spending on care) and the indirect effects (such as lost productivity) already cost the global economy around $2.5 trillion a year”, an amount projected to rise by 2030 “to around $6 trillion, in constant dollars — more than heart disease and more than cancer, diabetes, and respiratory diseases combined”.1

The World Health Organization estimated in 2012 that about a quarter of all time lost to disability is due to mental illness, putting it at the top of the league chart.3 Unlike many other chronic illnesses, mental illness frequently strikes the young. Further, of the 800 000 people who commit suicide each year, 75% are in low-income and middle-income countries.4

Extraordinary failure

Yet, the authors of “Darkness invisible” say, the 2010 Harvard report had no impact. In wealthy countries, mental illness is still perceived as an individual or family problem rather than “as a policy challenge with significant economic and political implications”. In many low-income and middle-income countries mental care for the mentally ill is seen as an unaffordable luxury.1 The authors also point to breakthroughs in therapy, especially new medications and the capacity to communicate using mobile phones, that are now more affordable, yet are frequently overlooked.1

So what are we doing? Globally we are spending around $2 a year per individual on mental health, averaging about 25 cents per person in low-income countries. In Australia in 2004–2005 the average national per capita expenditure on mental health services was $117.5 As we have seen in Australia, the advantages of dismantling mental hospitals that “once oversaw care for the mentally ill”,1 especially those with long-standing severe illness, are accompanied by failures to provide community care for these people. The criminal justice system comes into play by default, in both the acute and long-term management of people with mental illness. In the United States, “30 percent of the country’s chronically homeless and more than 20 percent of the people incarcerated … suffer from a mental disorder”.1 The scene is dismal in Australia as well.

Darkness invisible explores new technologies including using the Internet and mobile devices to provide psychotherapeutic interventions supported by inexpensive generic medications that could be administered by health workers in the vast tracts of the earth where there are very few medical practitioners and no psychiatrists. The authors may well have wondered about the lethargy among the medical profession worldwide in creating opportunities for the training and deployment of more psychiatrists. We don’t look good as we pass this mirror. There is no substance to our defence when wealthy communities are well supplied with psychiatrists and psychologists.

A call for better advocacy

Darkness invisible concludes with a call for mental health advocates to multiply their efforts and “do a better job of explaining to officials and the public the true costs of mental illness”, and “win more allies within the medical profession by drawing attention to the fact that improved mental health leads to better overall health”.1

This call will resonate with those who perceive the lamentable consequences of unexplained political propositions and proposals: bankrupt policy replaced by sound bites and slogans. There’s a powerful story to be told about mental health, with chapters on the consequences of inadequate care on individual wellbeing and the national economy.

As a senior business executive put it to me recently, “To succeed, first you must have a convincing story, then good leadership, then the metrics”. More light, more storytelling please.