
The Australian Cancer Atlas aims to make a difference for cancer patients by mapping the geographical patterns of cancer data across the country.
There is a well established association between the health and wellbeing of people and where they live. This may reflect the scenario where people with similar characteristics tend to live in similar areas. It may also be due to the characteristics of the geographical area, such as how remote it is, the level of socio-economic disadvantage, and access to medical and other services. To reduce these geographical inequalities and their impact on Australian lives, decisions about priority setting and allocating of finite resources need to be based on the best available evidence, including understanding the extent and patterns of geographical inequalities in the impact that cancer has across Australia.
The Australian Cancer Atlas (ACA), first launched in 2018 and recently updated to version 2.0 in 2024, provides much of that evidence.
In the following, we will describe the ACA 2.0 through four main perspectives of HOPE.
H: How?
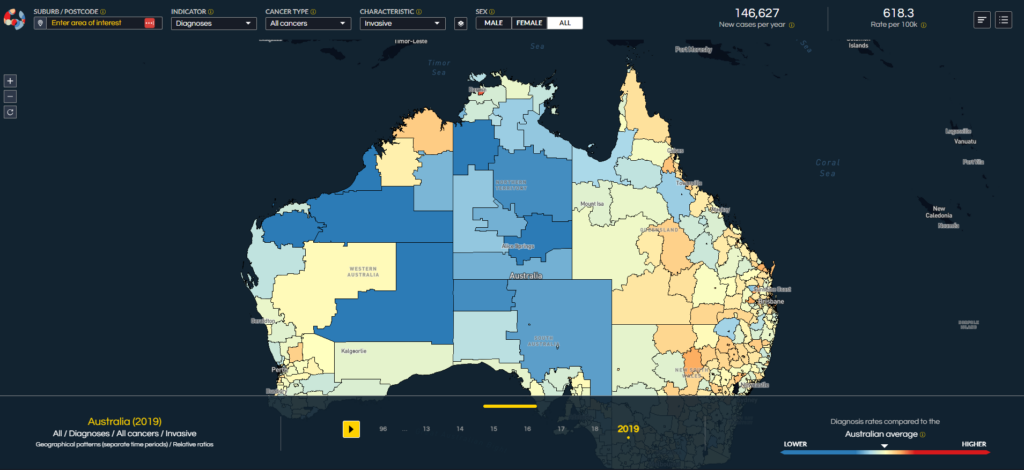
The ACA is a publicly available digital product that presents modelled estimates and visualisations of cancer incidence and relative survival for 30 different types of cancer, as well as details about cancer risk factors, clinical features, cancer screening and testing, and some hospital treatment information. Absolute and relative measures are provided, and changes in geographical patterns are also depicted. Importantly, we have designed ACA 2.0 in a modular format, providing us with the opportunity to include additional measures in the future as more data and funding become available.
Most of the data sources for the cancer atlas are population-based, including cancer registries, Medicare and hospital data collections. The process of data extraction relies on first obtaining ethics and data custodian approvals, and the ongoing support and engagement with the data custodians. The use of these data collections ensured the ACA provides complete population and geographical coverage. The prevalence estimates for cancer risk factors were derived by applying newly developed statistical models to data from the National Health Survey.
In addition to state-of-the-art digital technology, the ACA is underpinned by advanced Bayesian statistical models that provide spatially smoothed estimates of cancer incidence and survival, along with the uncertainty associated with these results. These models increase the robustness and privacy of the estimates, and facilitate probabilistic insights and comparisons. With a greatly expanded range of cancer-related measures, ACA 2.0 provides a full view of how the impact of cancer varies by small geographical area across Australia.
O: Outcomes
The ACA 2.0 provides unparalleled insights into many questions that were unanswered in the ACA 1.0. For example, what were the geographical patterns for a wider range of cancer types, in particular the less common types that receive far less attention (and less funding) but are equally important? Have the geographical patterns changed over time? What are the patterns for cancer screening and known risk factors?
While ACA provides many unique insights, we wanted to highlight two in this article. First, we can view the modelled diagnosis counts (absolute) with the modelled standardised diagnosis ratios (relative). For many cancer types, we can see that while many areas, particularly those in regional and remote parts of Australia might have a higher than average diagnosis rate, they have lower numbers of cancers diagnosed. This effect is highly influenced by population numbers, and highlights the need to consider both the relative risk of diagnosis in an area and the actual demand for medical services in that area. Finding the best balance is complex when you consider that better clinical outcomes are typically achieved with centralisation of services and higher caseloads, but then this centralisation of services means that Australians in rural and remote areas face an increased socio-economic burden to access treatment and support services.
The second insight is the lack of changes in the geographical patterns across Australia since the mid-1990s. That is, the extent and characteristics of geographical disparities across Australia in 1996 was very similar to that observed in 2019. In 2007, reducing inequalities in cancer was highlighted as one of the most important health challenges that Australia faces. While it must be acknowledged, and appreciated, that Australia has one of the best health systems in the world, the challenge to ensure all Australians have access to this best care remains a very difficult one.
P: Partnerships
The ACA is a testament to the power of collaborative research projects, since it could only have been achieved through a consortium of multidisciplinary and multi-institutional researchers, practitioners and funders. First starting in early 2021, the project team comprised over 25 members across multiple disciplines such as biostatistics, epidemiology, visual design, digital architecture and visual communication, drawn from four Australian universities (led by the Queensland University of Technology, QUT) and two state cancer councils (led by Cancer Council Queensland, CCQ). The team was guided by a project advisory group of nationally and internationally recognised experts in their field. From its genesis, the ACA has been variously funded by the Australian Research Council, Frontier SI, the Australian Institute of Health and Welfare, QUT and CCQ, with additional support from the Centre for Research Excellence in Prostate Cancer Survivorship and the QUT Centre for Data Science. The project wouldn’t have happened without this funding, so we are deeply grateful for this support.
E: Extensions
We will continue to expand the statistical methodology required to more effectively uncover the patterns within these spatial data, including emerging techniques such as federated learning, smart statistical analyses and foundational models. Most importantly, we want to extend this work by investigating “why”. Through the ACA 2.0, we now know much more about the “what, where and when” of cancer incidence and survival. However, we still know little about why the observed spatial patterns and inequalities occur. This is not a one-size-fits-all solution – it is likely the reasons contributing to the spatial patterns vary across cancer types, so input from consumers, patient support groups, industry groups and other researchers will be vital. The ACA 2.0 provides a great platform to encourage users to contribute details about their own experiences, which could then be geo-tagged, analysed and combined with the quantitative data.
Together, the four letters indexing the perspectives described above form the word, “HOPE”. It’s a small word, but it has huge ambitions: hope for advances in collaborative research, hope for continued partnerships and research translation and, most importantly, hope that our Australian Cancer Atlas can make a difference for cancer patients across Australia.
Peter Baade is a Research Lead at Cancer Council Queensland where seeks to describe the patterns of cancer-related outcomes and better understand why these outcomes depend on where people live, along with the role of remoteness, area disadvantage and ethnicity.
Professor Kerrie Mengersen is a statistician, distinguished Professor of Statistics at Queensland University of Technology, and 2024 winner of the Ruby Payne-Scott Medal from the Australian Academy of Science.
The statements or opinions expressed in this article reflect the views of the authors and do not necessarily represent the official policy of the AMA, the MJA or InSight+ unless so stated.
Subscribe to the free InSight+ weekly newsletter here. It is available to all readers, not just registered medical practitioners.
If you would like to submit an article for consideration, send a Word version to mjainsight-editor@ampco.com.au.